Repaints Machine Learning: Logistic Regression For ThinkOrSwim

Repaints

jmoney99

New member
With the volatility filter enabled I've found it pretty accurate at predicting long / short signals on the 3 minute timeframe.

The Author states:
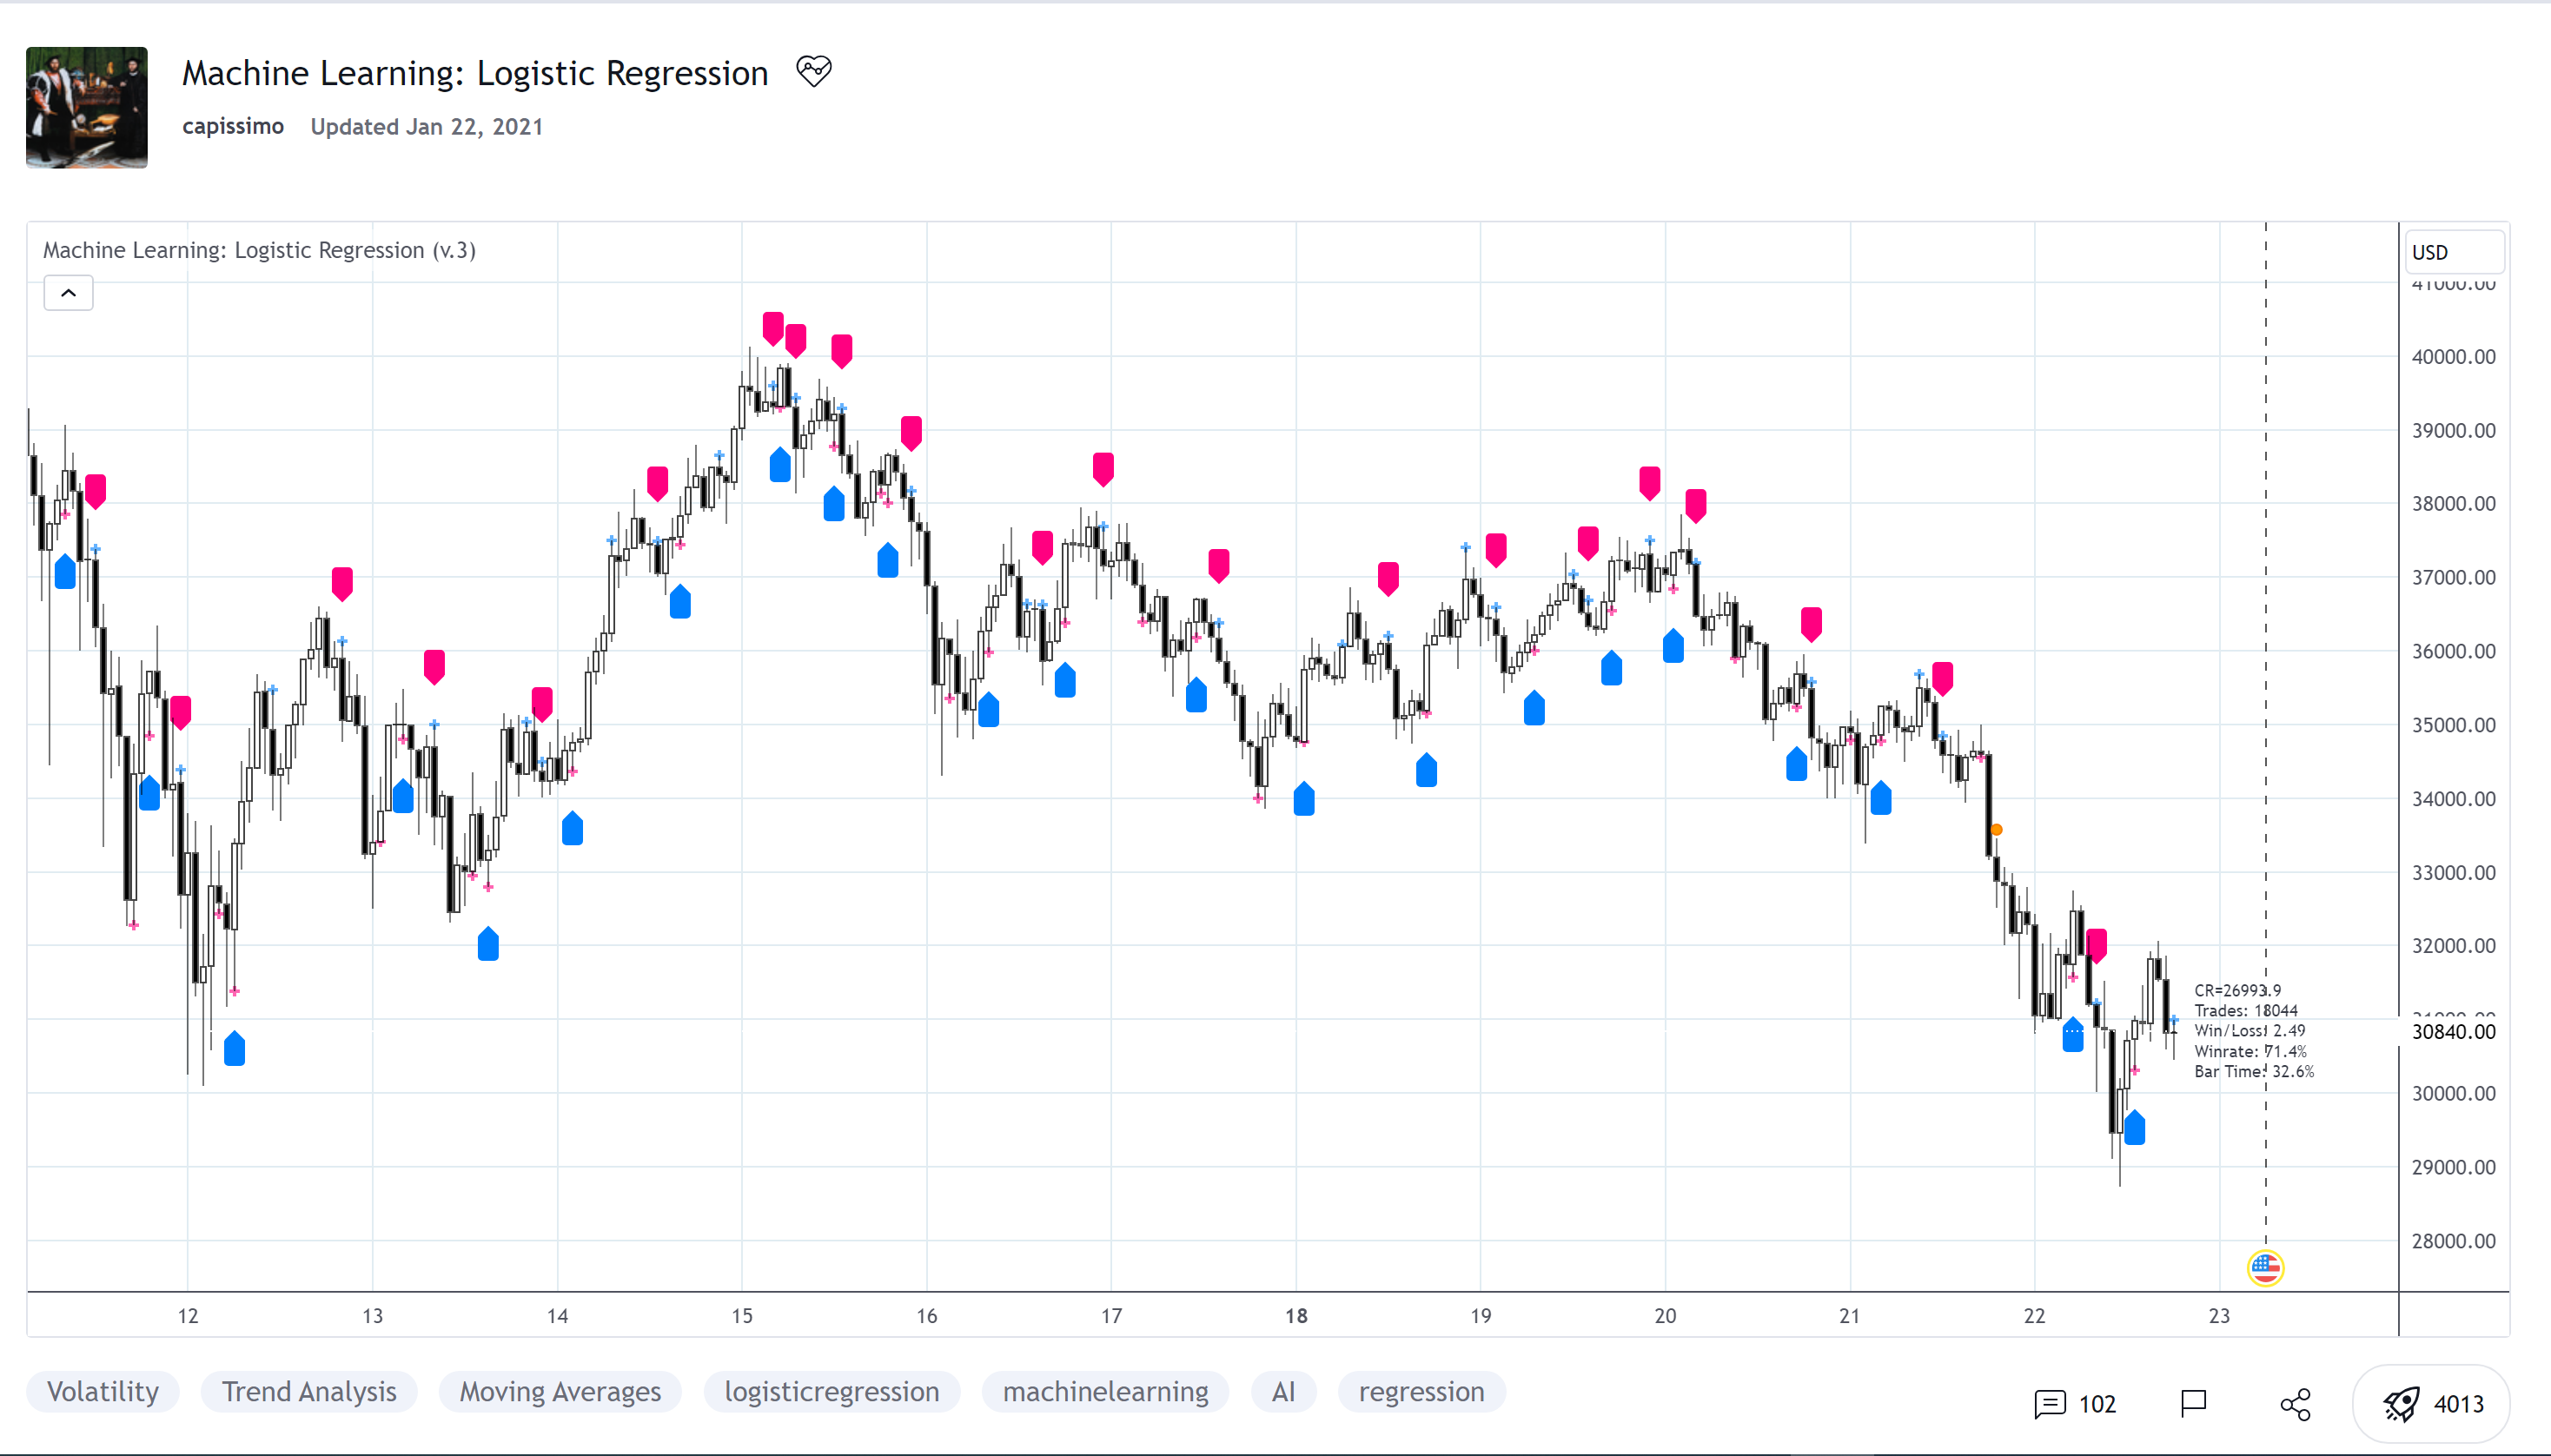
This strategy uses a classic machine learning algorithm that came from statistics - Logistic Regression (LR).

The first and most important thing about logistic regression is that it is not a 'Regression' but a 'Classification' algorithm. The name itself is somewhat misleading. Regression gives a continuous numeric output but most of the time we need the output in classes (i.e. categorical, discrete). For example, we want to classify emails into “spam” or 'not spam', classify treatment into “success” or 'failure', classify statement into “right” or 'wrong', classify election data into 'fraudulent vote' or 'non-fraudulent vote', classify market move into 'long' or 'short' and so on. These are the examples of logistic regression having a binary output (also called dichotomous).

You can also think of logistic regression as a special case of linear regression when the outcome variable is categorical, where we are using log of odds as dependent variable. In simple words, it predicts the probability of occurrence of an event by fitting data to a logit function.

Basically, the theory behind Logistic Regression is very similar to the one from Linear Regression, where we seek to draw a best-fitting line over data points, but in Logistic Regression, we don’t directly fit a straight line to our data like in linear regression. Instead, we fit a S shaped curve, called Sigmoid, to our observations, that best SEPARATES data points. Technically speaking, the main goal of building the model is to find the parameters (weights) using gradient descent.

In this script the LR algorithm is retrained on each new bar trying to classify it into one of the two categories. This is done via the logistic_regression function by updating the weights w in the loop that continues for iterations number of times. In the end the weights are passed through the sigmoid function, yielding a prediction.

Mind that some assets require to modify the script's input parameters. For instance, when used with BTCUSD and USDJPY, the 'Normalization Lookback' parameter should be set down to 4 (2,...,5..), and optionally the 'Use Price Data for Signal Generation?' parameter should be checked. The defaults were tested with EURUSD.
ruPoeHm.png


I'm trying to use chatgpt to convert a trading view script (Machine Learning Logistic Regression by Capissimo) but getting errors in thinkscript. With the volatility filter enabled I've found it pretty accurate at predicting long / short signals on the 3 minute timeframe. Anyone have any ideas how to convert it or if there is a conversion app available? Sorry I'm not that familiar with Thinkscript coding and just started using ThinkorSwim. Any help would be appreciated. Here is the link to the script: https://www.tradingview.com/script/49YIV1jW-Machine-Learning-Logistic-Regression/
 
Last edited by a moderator:
I'm trying to use chatgpt to convert a trading view script (Machine Learning Logistic Regression by Capissimo) but getting errors in thinkscript. With the volatility filter enabled I've found it pretty accurate at predicting long / short signals on the 3 minute timeframe. Anyone have any ideas how to convert it or if there is a conversion app available? Sorry I'm not that familiar with Thinkscript coding and just started using ThinkorSwim. Any help would be appreciated. Here is the link to the script: https://www.tradingview.com/script/49YIV1jW-Machine-Learning-Logistic-Regression/

Anyone know if this is possible with thinkscript ?
check the below/

CSS:
#// Indicator for TOS
#// Multi-timeframe Strategy based on Logistic Regression algorithm
#// https://www.tradingview.com/v/49YIV1jW/
#// © capissimo
#// For more information on KernelFunctions refer to to the original open source indicator by @jdehorty located here:
#// https://www.tradingview.com/script/...son-Rational-Quadratic-Kernel-Non-Repainting/
#// Nadaraya-Watson Kernel Regression Settings
#study('Machine Learning: Logistic Regression (v.3)
# Converted by Sam4Cok@Samer800    - 02/2024
#//-------------------- Inputs
input show_label = yes;            # 'Show Info?'
input signalStyle = {Default "Arrows", "Bubbles"};
input priceType  = {"Open", "High", "Low", default "Close", "HL2", "OC2", "OHL3", "HLC3", "OHLC4", "HLCC4"};
input timeframe = {Default "Chart Timeframe", "Custom Timeframe"};
input customTimeframe = AggregationPeriod.FIFTEEN_MIN;    # 'Resolution'
input LookbackWindowSize   = 3;                                # 'Lookback Window Size |2..n| (2)'
input NormalizationLookback = 2;                     # 'Normalization Lookback |2..240| (120)'
input LearningRate      = 0.0009;                    # 'Learning Rate |0.0001..0.01|'
input TrainingIterations = 1000;                     # 'Training Iterations |50..20000|'
input FilterSignalsBy  = {default Volatility, Volume, Both , None};    # 'Filter Signals by'
input ShowLossAndPredictionCurves     = no;          # 'Show Loss & Prediction Curves?'
input useOptionalCalculation  = yes;                    # 'Optional Calculation?'
input UsePriceDataForSignalGeneration   = yes;       # 'Use Price Data for Signal Generation?'
input HoldingPeriod  = 5;                            # 'Holding Period |1..n|'
input lot_size  = 1.0;

#//-------------------- System Variables
def na = Double.NaN;
def arrow = signalStyle==signalStyle."Arrows";
def lookback = LookbackWindowSize;
def nlbk = NormalizationLookback;
def lrate = LearningRate;
def iterations = TrainingIterations;
def curves = ShowLossAndPredictionCurves;
def easteregg = useOptionalCalculation;
def useprice = UsePriceDataForSignalGeneration;
def time = GetTime()/1000;#BarNumber();
def ishistory = !IsNaN(close[-1]);

def volume_ = volume;
#-- Color
DefineGlobalColor("Lup", CreateColor(33,150,243));
DefineGlobalColor("Ldn", CreateColor(0,230,118));
DefineGlobalColor("up", CreateColor(0,128,255));
DefineGlobalColor("dn", CreateColor(255,0,128));
DefineGlobalColor("dup", CreateColor(0,69,137));
DefineGlobalColor("ddn", CreateColor(137,0,69));

def open_;
def high_;
def low_;
def close_;
switch (timeframe) {
case "Custom Timeframe" :
    open_   = open(Period = customTimeframe);
    high_   = high(Period = customTimeframe);
    low_    = low(Period = customTimeframe);
    close_  = close(Period = customTimeframe);
Default :
    open_   = open;
    high_   = high;
    low_    = low;
    close_  = close;
}
#//-------------------- Custom Functions
#volumeBreak(thres) =>
    def rsivol   = RSI(Price = volume_, Length = 14);
    def osc      = HullMovingAvg(rsivol, 10);
    def volumeBreak = osc > 49;
#volatilityBreak(volmin, volmax)
    def volatilityBreak = ATR(LENGTH=1) > ATR(LENGTH=10);
#dot(v, w, p)
script dot {
    input v = 1;
    input w = 1;
    input p = 10;
    def dot = Sum(v * w, p);#  // dot product
    plot out = dot;
}
#sigmoid(z) =>
script sigmoid {
    input z = 1;
    def sigmoid = 1.0 / (1.0 + Exp(-z));
    plot out = sigmoid;
}
#logistic_regression(X, Y, p, lr, iterations) =>
script logistic_regression {
    input X = close;
    input Y = close;
    input p = 10;
    input lr = 0.0009;
    input iterations = 1000;
    def ishistory = IsNaN(close);
    def hypothesis = sigmoid(dot(X, 0.0, p));#  //-- prediction
    def loss = -1.0 / p * (dot(dot(Y, Log(hypothesis) + (1.0 - Y), p), Log(1.0 - hypothesis), p));
    def gradient = 1.0 / p * (dot(X, hypothesis - Y, p));
    def w = fold i = 1 to iterations with q do
            q - lr * gradient;
    def predict = sigmoid(dot(X, w, p));
    plot los  = if ishistory then Double.NaN else loss;
    plot pred = if ishistory then Double.NaN else predict;
}
#minimax(ds, p, min, max) =>
script minimax {
    input ds = close;
    input p  = 10;
    input min = 0;
    input max = 100;
    def hi = Highest(ds, p);
    def lo = Lowest(ds, p);
    def minimax = (max - min) * (ds - lo) / (hi - lo) + min;
    plot out = if isNaN(minimax) then Double.NaN else minimax;
}
#//-------------------- Logic
def ds;
switch (priceType) {
case "Open" : ds = open_;
case "High" : ds = high_;
case "Low"  : ds = low_;
case "HL2"  : ds = (high_ + low_) / 2;
case "OC2"  : ds = (open_ + close_) / 2;
case "OHL3" : ds = (open_ + high_ + low_) / 3;
case "HLC3" : ds = (high_ + low_ + close_) / 3;
case "OHLC4" : ds = (open_ + high_ + low_ + close_) / 4;
case "HLCC4" : ds = (high_ + low_ + close_ + close_) / 4;
Default      : ds = close_;
}

def base_ds  = if ishistory then ds else ds[1];
def synth_ds = Log(AbsValue(Power(base_ds, 2) - 1) + 0.5);# //-- generate a synthetic dataset

def base  = if easteregg then time else base_ds;         # //-- standard and optional calculation
def synth = if easteregg then base_ds else synth_ds;
def lowstBase   = Lowest(base_ds, nlbk);
def highestBase = Highest(base_ds, nlbk);

def loss       = logistic_regression(base, synth, lookback, lrate, iterations).los;
def prediction = logistic_regression(base, synth, lookback, lrate, iterations).pred;
def scaled_loss        = minimax(loss,       nlbk, lowstBase, highestBase);
def scaled_prediction  = minimax(prediction, nlbk, lowstBase, highestBase);

#--- Filter
def volt = volatilityBreak;
def vol  = volumeBreak;
def all = volt and vol;
def filter = if FilterSignalsby == FilterSignalsby.Volatility then volt else
             if FilterSignalsby == FilterSignalsby.Volume     then vol else
             if FilterSignalsby == FilterSignalsby.Both       then all else yes;
def signal = if useprice then
             if base_ds < scaled_loss and filter then -1 else
             if base_ds > scaled_loss and filter then  1 else signal[1] else
             if scaled_loss < scaled_prediction and filter then -1 else
             if scaled_loss > scaled_prediction and filter then  1 else signal[1];

def changed = signal - signal[1];
def hp_counter = if changed then 0 else hp_counter[1] + 1;

def startLongTrade  = changed and signal == 1;
def startShortTrade = changed and signal ==-1;
def endLongTrade    = (signal == 1 and hp_counter == HoldingPeriod and !changed) or (changed and signal ==-1);
def endShortTrade   = (signal ==-1 and hp_counter == HoldingPeriod and !changed) or (changed and signal == 1);

#//-------------------- Rendering
def lowFrac = low * 0.03 / 100;
def highFrac = high * 0.03 / 100;

plot CurveLoss = if curves and scaled_loss then scaled_loss else na;
plot CurvePred = if curves and scaled_prediction then scaled_prediction else na;
CurveLoss.SetLineWeight(2);
CurvePred.SetLineWeight(2);
CurveLoss.SetDefaultColor(GlobalColor("Lup"));
CurvePred.SetDefaultColor(GlobalColor("Ldn"));

#-- Signals
AddChartBubble(!arrow and startLongTrade, low, "B", GlobalColor("up"), no);
AddChartBubble(!arrow and startShortTrade, high, "S", GlobalColor("dn"));

plot BuySig = if arrow and startLongTrade  then low  - lowFrac else na;     # "Buy"
plot SelSig = if arrow and startShortTrade then high + highFrac else na;    # "Sell"
plot endLong  = if endLongTrade then high else na;    # 'StopBuy'
plot endShort = if endShortTrade then low else na;    # 'StopSell'

BuySig.SetPaintingStrategy(PaintingStrategy.ARROW_UP);
SelSig.SetPaintingStrategy(PaintingStrategy.ARROW_DOWN);
BuySig.SetLineWeight(2);
SelSig.SetLineWeight(2);
BuySig.SetDefaultColor(GlobalColor("up"));
SelSig.SetDefaultColor(GlobalColor("dn"));
endLong.SetPaintingStrategy(PaintingStrategy.BOOLEAN_WEDGE_UP);
endShort.SetPaintingStrategy(PaintingStrategy.BOOLEAN_WEDGE_DOWN);
endLong.SetDefaultColor(GlobalColor("dup"));
endShort.SetDefaultColor(GlobalColor("ddn"));

#//-------------------- Backtesting (TODO)
def ohl3 = (open + high + low) / 3;

def long_trades;
def short_trades;
def wins;
def trade_count;
def start_long_trade  = if startLongTrade then ohl3 else (if isNaN(start_long_trade[1]) then 0 else start_long_trade[1]);
def start_short_trade = if startShortTrade then ohl3 else (if isNaN(start_short_trade[1]) then 0 else start_short_trade[1]);
if endLongTrade {
    trade_count  = if isNaN(trade_count[1]) then 0 else trade_count[1] + 1;
    wins         = if isNaN(wins[1]) then 0 else if (ohl3 - start_long_trade) > 0 then wins[1] + 1 else wins[1];
    long_trades  = (if isNaN(long_trades[1]) then 0 else long_trades[1]) + (ohl3 - start_long_trade) * lot_size;
    short_trades = short_trades[1];
} else
if endShortTrade {
    trade_count  = if isNaN(trade_count[1]) then 0 else trade_count[1] + 1;
    wins         = if isNaN(wins[1]) then 0 else if (start_short_trade - ohl3) > 0 then wins[1] + 1 else wins[1];
    short_trades = (if isNaN(short_trades[1]) then 0 else short_trades[1]) + (start_short_trade - ohl3) * lot_size;
    long_trades  = long_trades[1];
} else {
    trade_count  = trade_count[1];
    wins         = wins[1];
    long_trades  = long_trades[1];
    short_trades = short_trades[1];
}
def cumreturn   = long_trades + short_trades;
def totaltrades = trade_count;
def totalwins   = wins;
def totallosses = if totaltrades - totalwins == 0 then 1 else totaltrades - totalwins;
def cr = Round(cumreturn, 2);
def winLoss = Round(totalwins / totallosses, 2);
def winRate = Round(totalwins / totaltrades * 100, 1);
#/-------------------- Information

AddLabel(show_label, "CR= $" + cr, if cr>0 then Color.LIGHT_GREEN else Color.PINK);
AddLabel(show_label, "Trades: " + totaltrades, Color.WHITE);
AddLabel(show_label, "Win/Loss: " + winLoss, if winLoss>1 then Color.LIGHT_GREEN else Color.PINK);
AddLabel(show_label, "Winrate: " + winRate + "%", if winRate>50 then Color.LIGHT_GREEN else Color.PINK);

#---- END of CODE
 
Last edited by a moderator:

Join useThinkScript to post your question to a community of 21,000+ developers and traders.

Similar threads

Not the exact question you're looking for?

Start a new thread and receive assistance from our community.

87k+ Posts
467 Online
Create Post

Similar threads

Similar threads

The Market Trading Game Changer

Join 2,500+ subscribers inside the useThinkScript VIP Membership Club
  • Exclusive indicators
  • Proven strategies & setups
  • Private Discord community
  • ‘Buy The Dip’ signal alerts
  • Exclusive members-only content
  • Add-ons and resources
  • 1 full year of unlimited support

Frequently Asked Questions

What is useThinkScript?

useThinkScript is the #1 community of stock market investors using indicators and other tools to power their trading strategies. Traders of all skill levels use our forums to learn about scripting and indicators, help each other, and discover new ways to gain an edge in the markets.

How do I get started?

We get it. Our forum can be intimidating, if not overwhelming. With thousands of topics, tens of thousands of posts, our community has created an incredibly deep knowledge base for stock traders. No one can ever exhaust every resource provided on our site.

If you are new, or just looking for guidance, here are some helpful links to get you started.

What are the benefits of VIP Membership?
VIP members get exclusive access to these proven and tested premium indicators: Buy the Dip, Advanced Market Moves 2.0, Take Profit, and Volatility Trading Range. In addition, VIP members get access to over 50 VIP-only custom indicators, add-ons, and strategies, private VIP-only forums, private Discord channel to discuss trades and strategies in real-time, customer support, trade alerts, and much more. Learn all about VIP membership here.
How can I access the premium indicators?
To access the premium indicators, which are plug and play ready, sign up for VIP membership here.
Back
Top