ML: Multiple Logistic Regression for ThinkOrSwim

samer800

Moderator - Expert
VIP
Lifetime
xqyRsUW.png


Author Message:

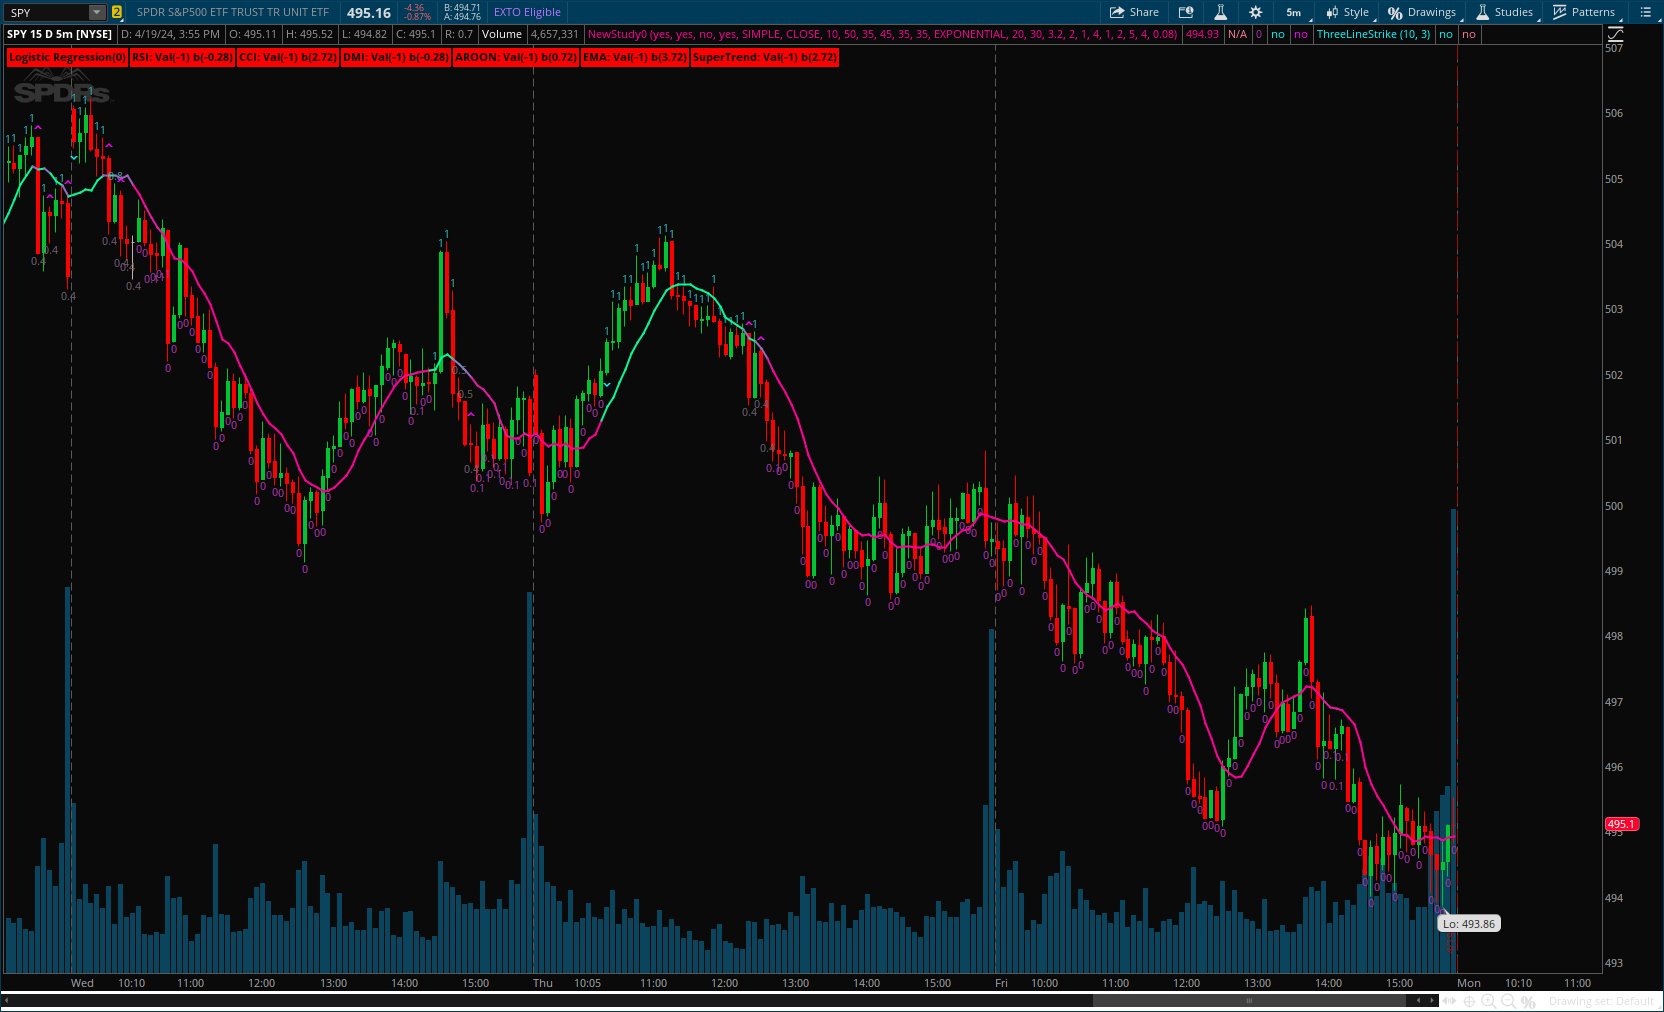
The Logistic Regression Indicator for TradingView is a versatile tool that employs multiple logistic regression based on various technical indicators to generate potential buy and sell signals. By utilizing key indicators such as RSI, CCI, DMI, Aroon, EMA, and SuperTrend, the indicator aims to provide a systematic approach to decision-making in financial markets.

Read More: https://www.tradingview.com/v/YHuROcQY/

CODE:

CSS:
# https://www.tradingview.com/v/YHuROcQY/
#// This source code is subject to the terms of the Mozilla Public License 2.0 at https://mozilla.org/MPL/2.0/
#// © VanHe1sing
# Machine Learning: Multiple Logistic Regression
# indicator('Multiple Logistic Regression', overlay=true, max_labels_count = 500)
# Converted by Sam4Cok@Samer800    - 04/2024

input colorBars = yes;
input onBarRegValue = yes;
input showLabels = yes;
input showSignals = no;
input useMovAvgFilter = yes;
input movAvgType = AverageType.SIMPLE;
input src = close;
input movAvgLength = 10;
input zScoreLength = 50; #, "Z score Length",
input rsi_length = 35; #, "RSI",   group = group_x)
input cci_length = 45; #, "CCI",   group = group_x)
input dmi_length = 35; #, "DMI",   group = group_x)
input aroon_length  = 35; #, "AROON", group = group_x)
input indicatorMovAvgType = AverageType.EXPONENTIAL;
input fastMovAvgLength = 20; #, "EMA",       group = group_x)
input slowMovAvgLength = 30; #, "EMA",       group = group_x)
input supertrendFactor   = 3.2; #, "factor (SuperTrend)", step = 0.1, group = "SuperTrend")
input supertrendAtrPeriod  = 2; #, "atrPeriod (SuperTrend)",  step = 1,   group = "SuperTrend")
input rsiWeight = 1; #, "?1   (rsi)",        step = 1, minval = 1, group = group_b)
input cciWeight = 4; #, "?2   (cci)",        step = 1, minval = 1, group = group_b)
input dmiWeight = 1; #, "?3   (dmi)",        step = 1, minval = 1, group = group_b)
input aroonWeight = 2; #, "?4   (aroon)",      step = 1, minval = 1, group = group_b)
input movAvgWeight = 5; #, "?5   (ema)",        step = 1, minval = 1, group = group_b)
input supertrendWeight = 4; #, "?6   (SuperTrend)", step = 1, minval = 1, group = group_b)
input StepOfLearing = 0.08; #, 'Step of learing',

def na = Double.NaN;

DefineGlobalColor("up", CreateColor(0, 137, 123));
DefineGlobalColor("dn", CreateColor(255, 82, 82));

#pine_supertrend(src, factor, atrPeriod) =>
script supertrend {
    input factor = 3;
    input atrPeriod = 10;
    def src = hl2;
    def nATR = ATR(Length = atrPeriod);
    def lowerBand;
    def upperBand;
    def upBand = src + factor * nATR;
    def loBand = src - factor * nATR;
    def prevLowerBand = if lowerBand[1] then lowerBand[1] else loBand;
    def prevUpperBand = if upperBand[1] then upperBand[1] else upBand;
    lowerBand = if (loBand > prevLowerBand) or (close[1] < prevLowerBand) then loBand else prevLowerBand;
    upperBand = if (upBand < prevUpperBand) or (close[1] > prevUpperBand) then upBand else prevUpperBand;
    def direction ;# = na
    def superTrend;# = na
    def prevSuperTrend = if superTrend[1] then superTrend[1] else prevUpperBand;
    if (IsNaN(prevUpperBand) or IsNaN(prevLowerBand)) {
        direction  = 1;
    } else
    if prevSuperTrend == prevUpperBand {
        direction  = if close > upperBand then -1 else 1;
    } else {
        direction  = if close < lowerBand then  1 else -1;
    }
    superTrend = if direction  == -1 then lowerBand else upperBand;
    plot dir = direction ;
}
#// Z score Function for normalization of data
script z_score {
    input src = close;
    input Length = 50;
    def std = StDev(src, Length);
    def basis  = Average(src, Length);
    def zscore = (src - basis) / std;
    plot out = zscore;
}
#// Multiple Logic Regression
script logistic {
    input x1 = 0;
    input x2 = 0;
    input x3 = 0;
    input x4 = 0;
    input x5 = 0;
    input x6 = 0;
    input b1 = 0;
    input b2 = 0;
    input b3 = 0;
    input b4 = 0;
    input b5 = 0;
    input b6 = 0;
    def logistic = 1 / (1 + Exp(-(1 + b1 * x1 + b2 * x2 + b3 * x3 + b4 * x4 + b5 * x5 + b6 * x6)));
    plot out = logistic;
}
#// Error Function (cross-entropy loss)
script loss {
    input y = 1;
    input p = 1;
    def loss = -y * Log(p) - (1 - y) * Log(1 - p);
    plot out = loss;
}
#// DATA VARIABLES
#// Variables
def rsi_value = RSI(Price = src, Length = rsi_length);
def cci_value = CCI(Length = cci_length);
def plus      = DMI(Length = dmi_length)."DI+";
def minus     = DMI(Length = dmi_length)."DI-";
def upper     = AroonIndicator(Length = aroon_length).up;
def lower     = AroonIndicator(Length = aroon_length).down;
def ema1      = MovingAverage(indicatorMovAvgType, src, fastMovAvgLength);
def ema2      = MovingAverage(indicatorMovAvgType, src, slowMovAvgLength);
def direction = supertrend(supertrendFactor, supertrendAtrPeriod);

#// Normalized close  (dependent variable)
def y  = if z_score(src, ZScoreLength) > 0 then 1 else -1;
#// normalized RSI
def x1 = if rsi_value > 50 then 1 else -1;
#// normalized CCI
def x2 = if (cci_value Crosses Above  100) then  1 else
         if (cci_value Crosses Below -100) then -1 else x2[1];
#// normalized DMI
def x3 = if plus  > minus then 1 else -1;
#// normalized Aroon
def x4 = if upper > lower then 1 else -1;
#// normalized ema
def x5 = if ema1  > ema2 then 1 else -1;
#// normalized SuperTrend
def x6 = direction * -1;

#/ MULTIPLE LOGISTIC REGRESSION
#// Pre Multiple Logic Regression
def p = logistic(x1, x2, x3, x4, x5, x6, rsiWeight, cciWeight, dmiWeight, aroonWeight, movAvgWeight, supertrendWeight);
#// Loss
def loss = loss(y, p);
#// Adjusting model weights using gradient descent
def b11 = rsiWeight - StepOfLearing * (p + loss) * x1;
def b22 = cciWeight - StepOfLearing * (p + loss) * x2;
def b33 = dmiWeight - StepOfLearing * (p + loss) * x3;
def b44 = aroonWeight - StepOfLearing * (p + loss) * x4;
def b55 = movAvgWeight - StepOfLearing * (p + loss) * x5;
def b66 = supertrendWeight - StepOfLearing * (p + loss) * x6;

#// Multiple Logic Regression With adjusted weights based on loss function
def l_reg = logistic(x1, x2, x3, x4, x5, x6, b11, b22, b33, b44, b55, b66);

#-- Reg Line
def trendLine = MovingAverage(movAvgType, src, movAvgLength);
def RegCol = if src > trendLine and trendLine > trendLine[1] then  1 else
             if src < trendLine and trendLine < trendLine[1] then -1 else 0;

def midReg = l_reg - 0.5;

def col = if l_reg > 1 then 100 else if l_reg < 0 then 0 else AbsValue(midReg) * 100;
def col1 = if l_reg > 1 then 100 else if l_reg < 0 then 0 else l_reg * 100;
def ncol = 100 - col;
def eCol = col * 2.54 + nCol;

plot movAvgLine = trendLine;
movAvgLine.SetLineWeight(2);
movAvgLine.AssignValueColor(CreateColor(255- col1*2.5, col1*2.5, 100 + ncol));

# label
def RoundReg = Round(l_reg, 1);

plot labUp = if onBarRegValue and l_reg > 0.5 then RoundReg else na;
plot labDn = if !onBarRegValue or l_reg > 0.5 then na else RoundReg;
labUp.SetPaintingStrategy(PaintingStrategy.VALUES_ABOVE);
labDn.SetPaintingStrategy(PaintingStrategy.VALUES_BELOW);
labUp.AssignValueColor(CreateColor(nCol, ecol, ecol));
labDn.AssignValueColor(CreateColor(eCol, ncol, ecol));

#--bar color.

AssignPriceColor(if !colorBars then Color.CURRENT else CreateColor(255- col1*2.5, col1*2.5, 100 + ncol));

#// Signals
def regUp = if useMovAvgFilter then RegCol>0 else yes;
def regDn = if useMovAvgFilter then RegCol<0 else yes;
def sigUp = (l_reg crosses above 0.5) and regUp;
def sigDn = (l_reg crosses below 0.5) and regDn;

plot chHi = sigUp and !sigUp[1];
plot chLo = sigDn and !sigDn[1];
chHi.SetDefaultColor(Color.CYAN);
chLo.SetDefaultColor(Color.MAGENTA);
chHi.SetPaintingStrategy(PaintingStrategy.BOOLEAN_WEDGE_DOWN);
chLo.SetPaintingStrategy(PaintingStrategy.BOOLEAN_WEDGE_UP);

AddChartBubble(showSignals and chHi[1] and RoundReg == 1, low, "B", Color.GREEN, no);
AddChartBubble(showSignals and chLo[1] and RoundReg == 0, high, "S", Color.RED);

AddLabel(showLabels,"Logistic Regression(" + RoundReg + ")", if l_reg > 0.5 then Color.GREEN else Color.RED);
#AddLabel(showLabels,"Learning Step(" + Round(StepOfLearing, 2) + ")", Color.GRAY);
AddLabel(showLabels,"RSI: Val(" + Round(x1, 0) + ") " + "b(" + Round(b11, 2) + ")", if x1 > 0 then Color.GREEN else Color.RED);
AddLabel(showLabels,"CCI: Val(" + Round(x2, 0) + ") " + "b(" + Round(b22, 2) + ")", if x2 > 0 then Color.GREEN else Color.RED);
AddLabel(showLabels,"DMI: Val(" + Round(x3, 0) + ") " + "b(" + Round(b33, 2) + ")", if x3 > 0 then Color.GREEN else Color.RED);
AddLabel(showLabels,"AROON: Val(" + Round(x4, 0) + ") " + "b(" + Round(b44, 2) + ")", if x4 > 0 then Color.GREEN else Color.RED);
AddLabel(showLabels,"EMA: Val(" + Round(x5, 0) + ") " + "b(" + Round(b55, 2) + ")", if x5 > 0 then Color.GREEN else Color.RED);
AddLabel(showLabels,"SuperTrend: Val(" + Round(x6, 0) + ") " + "b(" + Round(b66, 2) + ")",if x6 > 0 then Color.GREEN else Color.RED);

#-- END of CODE
 
Last edited:
this is not a logistic regression. You update the weights incorrectly and your y hat is not bounded between 0 and 1.
 
This looks very interesting!! If you want view a Multi-Timeframe version where you can input the time period of a longer timeframe and view it on a shorter timeframe chart, check out this version and select the longer timeframe in the settings. For example in the picture the wide stairstep line is a 1 hour timeframe viewed on a 1 minute chart.

1714597566122.png


Code:
# https://www.tradingview.com/v/YHuROcQY/
#// This source code is subject to the terms of the Mozilla Public License 2.0 at https://mozilla.org/MPL/2.0/
#// © VanHe1sing
# Machine Learning: Multiple Logistic Regression
# indicator('Multiple Logistic Regression', overlay=true, max_labels_count = 500)
# Converted by Sam4Cok@Samer800    - 04/2024
# Added Multiple Timeframe by Chewie 05/2024

input colorBars = no;
input onBarRegValue = no;
input showLabels = no;
input showSignals = no;
input useMovAvgFilter = yes;
input movAvgType = AverageType.SIMPLE;
input Period = aggregationPeriod.five_min;
def src = close(period = Period);
input movAvgLength = 10;
input zScoreLength = 50; #, "Z score Length",
input rsi_length = 35; #, "RSI",   group = group_x)
input cci_length = 45; #, "CCI",   group = group_x)
input dmi_length = 35; #, "DMI",   group = group_x)
input aroon_length  = 35; #, "AROON", group = group_x)
input indicatorMovAvgType = AverageType.EXPONENTIAL;
input fastMovAvgLength = 20; #, "EMA",       group = group_x)
input slowMovAvgLength = 30; #, "EMA",       group = group_x)
input supertrendFactor   = 3.2; #, "factor (SuperTrend)", step = 0.1, group = "SuperTrend")
input supertrendAtrPeriod  = 2; #, "atrPeriod (SuperTrend)",  step = 1,   group = "SuperTrend")
input rsiWeight = 1; #, "?1   (rsi)",        step = 1, minval = 1, group = group_b)
input cciWeight = 4; #, "?2   (cci)",        step = 1, minval = 1, group = group_b)
input dmiWeight = 1; #, "?3   (dmi)",        step = 1, minval = 1, group = group_b)
input aroonWeight = 2; #, "?4   (aroon)",      step = 1, minval = 1, group = group_b)
input movAvgWeight = 5; #, "?5   (ema)",        step = 1, minval = 1, group = group_b)
input supertrendWeight = 4; #, "?6   (SuperTrend)", step = 1, minval = 1, group = group_b)
input StepOfLearing = 0.08; #, 'Step of learing',

def na = Double.NaN;

DefineGlobalColor("up", CreateColor(0, 137, 123));
DefineGlobalColor("dn", CreateColor(255, 82, 82));

#pine_supertrend(src, factor, atrPeriod) =>
script supertrend {
    input factor = 3;
    input atrPeriod = 10;
    def src = hl2;
    def nATR = ATR(Length = atrPeriod);
    def lowerBand;
    def upperBand;
    def upBand = src + factor * nATR;
    def loBand = src - factor * nATR;
    def prevLowerBand = if lowerBand[1] then lowerBand[1] else loBand;
    def prevUpperBand = if upperBand[1] then upperBand[1] else upBand;
    lowerBand = if (loBand > prevLowerBand) or (close[1] < prevLowerBand) then loBand else prevLowerBand;
    upperBand = if (upBand < prevUpperBand) or (close[1] > prevUpperBand) then upBand else prevUpperBand;
    def direction ;# = na
    def superTrend;# = na
    def prevSuperTrend = if superTrend[1] then superTrend[1] else prevUpperBand;
    if (IsNaN(prevUpperBand) or IsNaN(prevLowerBand)) {
        direction  = 1;
    } else
    if prevSuperTrend == prevUpperBand {
        direction  = if close > upperBand then -1 else 1;
    } else {
        direction  = if close < lowerBand then  1 else -1;
    }
    superTrend = if direction  == -1 then lowerBand else upperBand;
    plot dir = direction ;
}
#// Z score Function for normalization of data
script z_score {
    input src = close;
    input Length = 50;
    def std = StDev(src, Length);
    def basis  = Average(src, Length);
    def zscore = (src - basis) / std;
    plot out = zscore;
}
#// Multiple Logic Regression
script logistic {
    input x1 = 0;
    input x2 = 0;
    input x3 = 0;
    input x4 = 0;
    input x5 = 0;
    input x6 = 0;
    input b1 = 0;
    input b2 = 0;
    input b3 = 0;
    input b4 = 0;
    input b5 = 0;
    input b6 = 0;
    def logistic = 1 / (1 + Exp(-(1 + b1 * x1 + b2 * x2 + b3 * x3 + b4 * x4 + b5 * x5 + b6 * x6)));
    plot out = logistic;
}
#// Error Function (cross-entropy loss)
script loss {
    input y = 1;
    input p = 1;
    def loss = -y * Log(p) - (1 - y) * Log(1 - p);
    plot out = loss;
}
#// DATA VARIABLES
#// Variables
def rsi_value = RSI(Price = src, Length = rsi_length);
def cci_value = CCI(Length = cci_length);
def plus      = DMI(Length = dmi_length)."DI+";
def minus     = DMI(Length = dmi_length)."DI-";
def upper     = AroonIndicator(Length = aroon_length).up;
def lower     = AroonIndicator(Length = aroon_length).down;
def ema1      = MovingAverage(indicatorMovAvgType, src, fastMovAvgLength);
def ema2      = MovingAverage(indicatorMovAvgType, src, slowMovAvgLength);
def direction = supertrend(supertrendFactor, supertrendAtrPeriod);

#// Normalized close  (dependent variable)
def y  = if z_score(src, ZScoreLength) > 0 then 1 else -1;
#// normalized RSI
def x1 = if rsi_value > 50 then 1 else -1;
#// normalized CCI
def x2 = if (cci_value Crosses Above  100) then  1 else
         if (cci_value Crosses Below -100) then -1 else x2[1];
#// normalized DMI
def x3 = if plus  > minus then 1 else -1;
#// normalized Aroon
def x4 = if upper > lower then 1 else -1;
#// normalized ema
def x5 = if ema1  > ema2 then 1 else -1;
#// normalized SuperTrend
def x6 = direction * -1;

#/ MULTIPLE LOGISTIC REGRESSION
#// Pre Multiple Logic Regression
def p = logistic(x1, x2, x3, x4, x5, x6, rsiWeight, cciWeight, dmiWeight, aroonWeight, movAvgWeight, supertrendWeight);
#// Loss
def loss = loss(y, p);
#// Adjusting model weights using gradient descent
def b11 = rsiWeight - StepOfLearing * (p + loss) * x1;
def b22 = cciWeight - StepOfLearing * (p + loss) * x2;
def b33 = dmiWeight - StepOfLearing * (p + loss) * x3;
def b44 = aroonWeight - StepOfLearing * (p + loss) * x4;
def b55 = movAvgWeight - StepOfLearing * (p + loss) * x5;
def b66 = supertrendWeight - StepOfLearing * (p + loss) * x6;

#// Multiple Logic Regression With adjusted weights based on loss function
def l_reg = logistic(x1, x2, x3, x4, x5, x6, b11, b22, b33, b44, b55, b66);

#-- Reg Line
def trendLine = MovingAverage(movAvgType, src, movAvgLength);
def RegCol = if src > trendLine and trendLine > trendLine[1] then  1 else
             if src < trendLine and trendLine < trendLine[1] then -1 else 0;

def midReg = l_reg - 0.5;

def col = if l_reg > 1 then 100 else if l_reg < 0 then 0 else AbsValue(midReg) * 100;
def col1 = if l_reg > 1 then 100 else if l_reg < 0 then 0 else l_reg * 100;
def ncol = 100 - col;
def eCol = col * 2.54 + nCol;

plot movAvgLine = trendLine;
movAvgLine.SetLineWeight(2);
movAvgLine.AssignValueColor(CreateColor(255- col1*2.5, col1*2.5, 100 + ncol));

# label
def RoundReg = Round(l_reg, 1);

plot labUp = if onBarRegValue and l_reg > 0.5 then RoundReg else na;
plot labDn = if !onBarRegValue or l_reg > 0.5 then na else RoundReg;
labUp.SetPaintingStrategy(PaintingStrategy.VALUES_ABOVE);
labDn.SetPaintingStrategy(PaintingStrategy.VALUES_BELOW);
labUp.AssignValueColor(CreateColor(nCol, ecol, ecol));
labDn.AssignValueColor(CreateColor(eCol, ncol, ecol));

#--bar color.

AssignPriceColor(if !colorBars then Color.CURRENT else CreateColor(255- col1*2.5, col1*2.5, 100 + ncol));

#// Signals
def regUp = if useMovAvgFilter then RegCol>0 else yes;
def regDn = if useMovAvgFilter then RegCol<0 else yes;
def sigUp = (l_reg crosses above 0.5) and regUp;
def sigDn = (l_reg crosses below 0.5) and regDn;

plot chHi = sigUp and !sigUp[1];
plot chLo = sigDn and !sigDn[1];
chHi.SetDefaultColor(Color.CYAN);
chLo.SetDefaultColor(Color.MAGENTA);
chHi.SetPaintingStrategy(PaintingStrategy.BOOLEAN_WEDGE_DOWN);
chLo.SetPaintingStrategy(PaintingStrategy.BOOLEAN_WEDGE_UP);

AddChartBubble(showSignals and chHi[1] and RoundReg == 1, low, "B", Color.GREEN, no);
AddChartBubble(showSignals and chLo[1] and RoundReg == 0, high, "S", Color.RED);

AddLabel(showLabels,"Logistic Regression(" + RoundReg + ")", if l_reg > 0.5 then Color.GREEN else Color.RED);
#AddLabel(showLabels,"Learning Step(" + Round(StepOfLearing, 2) + ")", Color.GRAY);
AddLabel(showLabels,"RSI: Val(" + Round(x1, 0) + ") " + "b(" + Round(b11, 2) + ")", if x1 > 0 then Color.GREEN else Color.RED);
AddLabel(showLabels,"CCI: Val(" + Round(x2, 0) + ") " + "b(" + Round(b22, 2) + ")", if x2 > 0 then Color.GREEN else Color.RED);
AddLabel(showLabels,"DMI: Val(" + Round(x3, 0) + ") " + "b(" + Round(b33, 2) + ")", if x3 > 0 then Color.GREEN else Color.RED);
AddLabel(showLabels,"AROON: Val(" + Round(x4, 0) + ") " + "b(" + Round(b44, 2) + ")", if x4 > 0 then Color.GREEN else Color.RED);
AddLabel(showLabels,"EMA: Val(" + Round(x5, 0) + ") " + "b(" + Round(b55, 2) + ")", if x5 > 0 then Color.GREEN else Color.RED);
AddLabel(showLabels,"SuperTrend: Val(" + Round(x6, 0) + ") " + "b(" + Round(b66, 2) + ")",if x6 > 0 then Color.GREEN else Color.RED);

#-- END of CODE
 
Last edited:

Join useThinkScript to post your question to a community of 21,000+ developers and traders.

Similar threads

Not the exact question you're looking for?

Start a new thread and receive assistance from our community.

87k+ Posts
481 Online
Create Post

Similar threads

Similar threads

The Market Trading Game Changer

Join 2,500+ subscribers inside the useThinkScript VIP Membership Club
  • Exclusive indicators
  • Proven strategies & setups
  • Private Discord community
  • ‘Buy The Dip’ signal alerts
  • Exclusive members-only content
  • Add-ons and resources
  • 1 full year of unlimited support

Frequently Asked Questions

What is useThinkScript?

useThinkScript is the #1 community of stock market investors using indicators and other tools to power their trading strategies. Traders of all skill levels use our forums to learn about scripting and indicators, help each other, and discover new ways to gain an edge in the markets.

How do I get started?

We get it. Our forum can be intimidating, if not overwhelming. With thousands of topics, tens of thousands of posts, our community has created an incredibly deep knowledge base for stock traders. No one can ever exhaust every resource provided on our site.

If you are new, or just looking for guidance, here are some helpful links to get you started.

What are the benefits of VIP Membership?
VIP members get exclusive access to these proven and tested premium indicators: Buy the Dip, Advanced Market Moves 2.0, Take Profit, and Volatility Trading Range. In addition, VIP members get access to over 50 VIP-only custom indicators, add-ons, and strategies, private VIP-only forums, private Discord channel to discuss trades and strategies in real-time, customer support, trade alerts, and much more. Learn all about VIP membership here.
How can I access the premium indicators?
To access the premium indicators, which are plug and play ready, sign up for VIP membership here.
Back
Top