MACD with Bollinger Bands Indicator for ThinkorSwim

@germanburrito one this was missing was 0 line. I like the way you had before that lights up red and green. I went to your old script and copy-paste it into the new script you shared and damn I love the way it looks now with your and @RickK script combined. I added this code
plot zero = 0;
zero.AssignValueColor(if MACD_Line < 0 then Color.RED else Color.GREEN);
zero.SetLineWeight(2);

Felt great just to copy-paste and the script came alive lol . You all are so talented people writing codes , I applaud you all
 
@Hypoluxa Thank you for sharing your strategy. I try not to swing trade too much so 10mins is a long time for my taste. I tried your strategy with DIS this morning as it popped up on my scanner. It bounced back from VWAP. There may be a benefit to use support/resistance levels with this strategy. However, it seems to be pretty good for the patient traders like you mentioned.

jfTNOvE.png
 
Just a little update to say this indicator has been golden all week trading both US and globex sessions. I set up scans (5 min time frame) to alert when the dots cross below the lower BB band for shorts and above the upper BB band for longs. When the indicator is in alignment on multiple time frames, I set profit targets based on fibs. 50 and 200 EMAs confirm long term trend so I don't pay too much attention to the zero line.

All my trades this week were futures with charts ranging from 1 min to daily time frame with S/R based on hourly and daily charts. I was profitable using @Hypoluxa's 2m, 6m, 10m strategy. I was also profitable with swing trades based off 30m, hourly, and daily charts, however that requires a risk tolerance for larger stop losses.

This indicator keeps my charts clean so that my brain can process price action when I look left. Thanks again, @BenTen and @Hypoluxa.
 
I apologize if I missed it in this thread, but did someone create a SCAN for this MACD BB study? Thanks and if you could post either link to scan or code much appreciated
 
@JoeSD, scanning with this indicator is simple. Just open your scan tab and create a new scan. Then select the MACD BB study (or whatever you named it when you saved it). Scan for MACD_Dots crossing above the BB_Upper for longs and below the BB_Lower for shorts. Use the offset function if you want the scan to return crosses within X number of bars. Hope that helps :) Happy Trading!

Am having trouble posting an image. Here's the URL to the image:

I should probably note that's the scan I use for @Hypoluxa's strategy for long entries in post #14 on the first page of this thread.
 
@Trader Raider - Is it possible to have 1 scan which addresses BOTH when the BB dots cross above OR when they cross below? Or do I have to have 2 separate scans? Thanks.
 
@Trader Raider - Is it possible to have 1 scan which addresses BOTH when the BB dots cross above OR when they cross below? Or do I have to have 2 separate scans? Thanks.
Yes, as @rad14733 noted above, one scan could pick up both types of BB crossing. The TOS scanner allows you to scan for all, any, or none of the criteria entered. Therefore, you could do a simultaneous scan for dots crossing above the upper BB or below the lower BB.

XnEcS6M.png
 
@Fluideng here is a zero line cross alert. I trade micros right now and this keeps me in the corral.

Code:
# Alerts
Alert(bull_cross, "UP arrow alert", Alert.Bar, Sound.Chimes);
Alert(bear_cross, "DOWN arrow alert", Alert.Bar, Sound.Chimes);
 
@Fluideng here is a zero line cross alert. I trade micros right now and this keeps me in the corral.

Code:
# Alerts
Alert(bull_cross, "UP arrow alert", Alert.Bar, Sound.Chimes);
Alert(bear_cross, "DOWN arrow alert", Alert.Bar, Sound.Chimes);
Where do I put this in order to create the alert? Thanks
 
I put them at the bottom of the script
Code:
def bull_cross = MACD_Line crosses above zero;
def bear_cross = MACD_Line crosses below zero;

# Alerts
Alert(bull_cross, "UP arrow alert", Alert.Bar, Sound.Chimes);
Alert(bear_cross, "DOWN arrow alert", Alert.Bar, Sound.Bell);
 
I put them at the bottom of the script
Code:
def bull_cross = MACD_Line crosses above zero;
def bear_cross = MACD_Line crosses below zero;

# Alerts
Alert(bull_cross, "UP arrow alert", Alert.Bar, Sound.Chimes);
Alert(bear_cross, "DOWN arrow alert", Alert.Bar, Sound.Bell);
Thank you
 
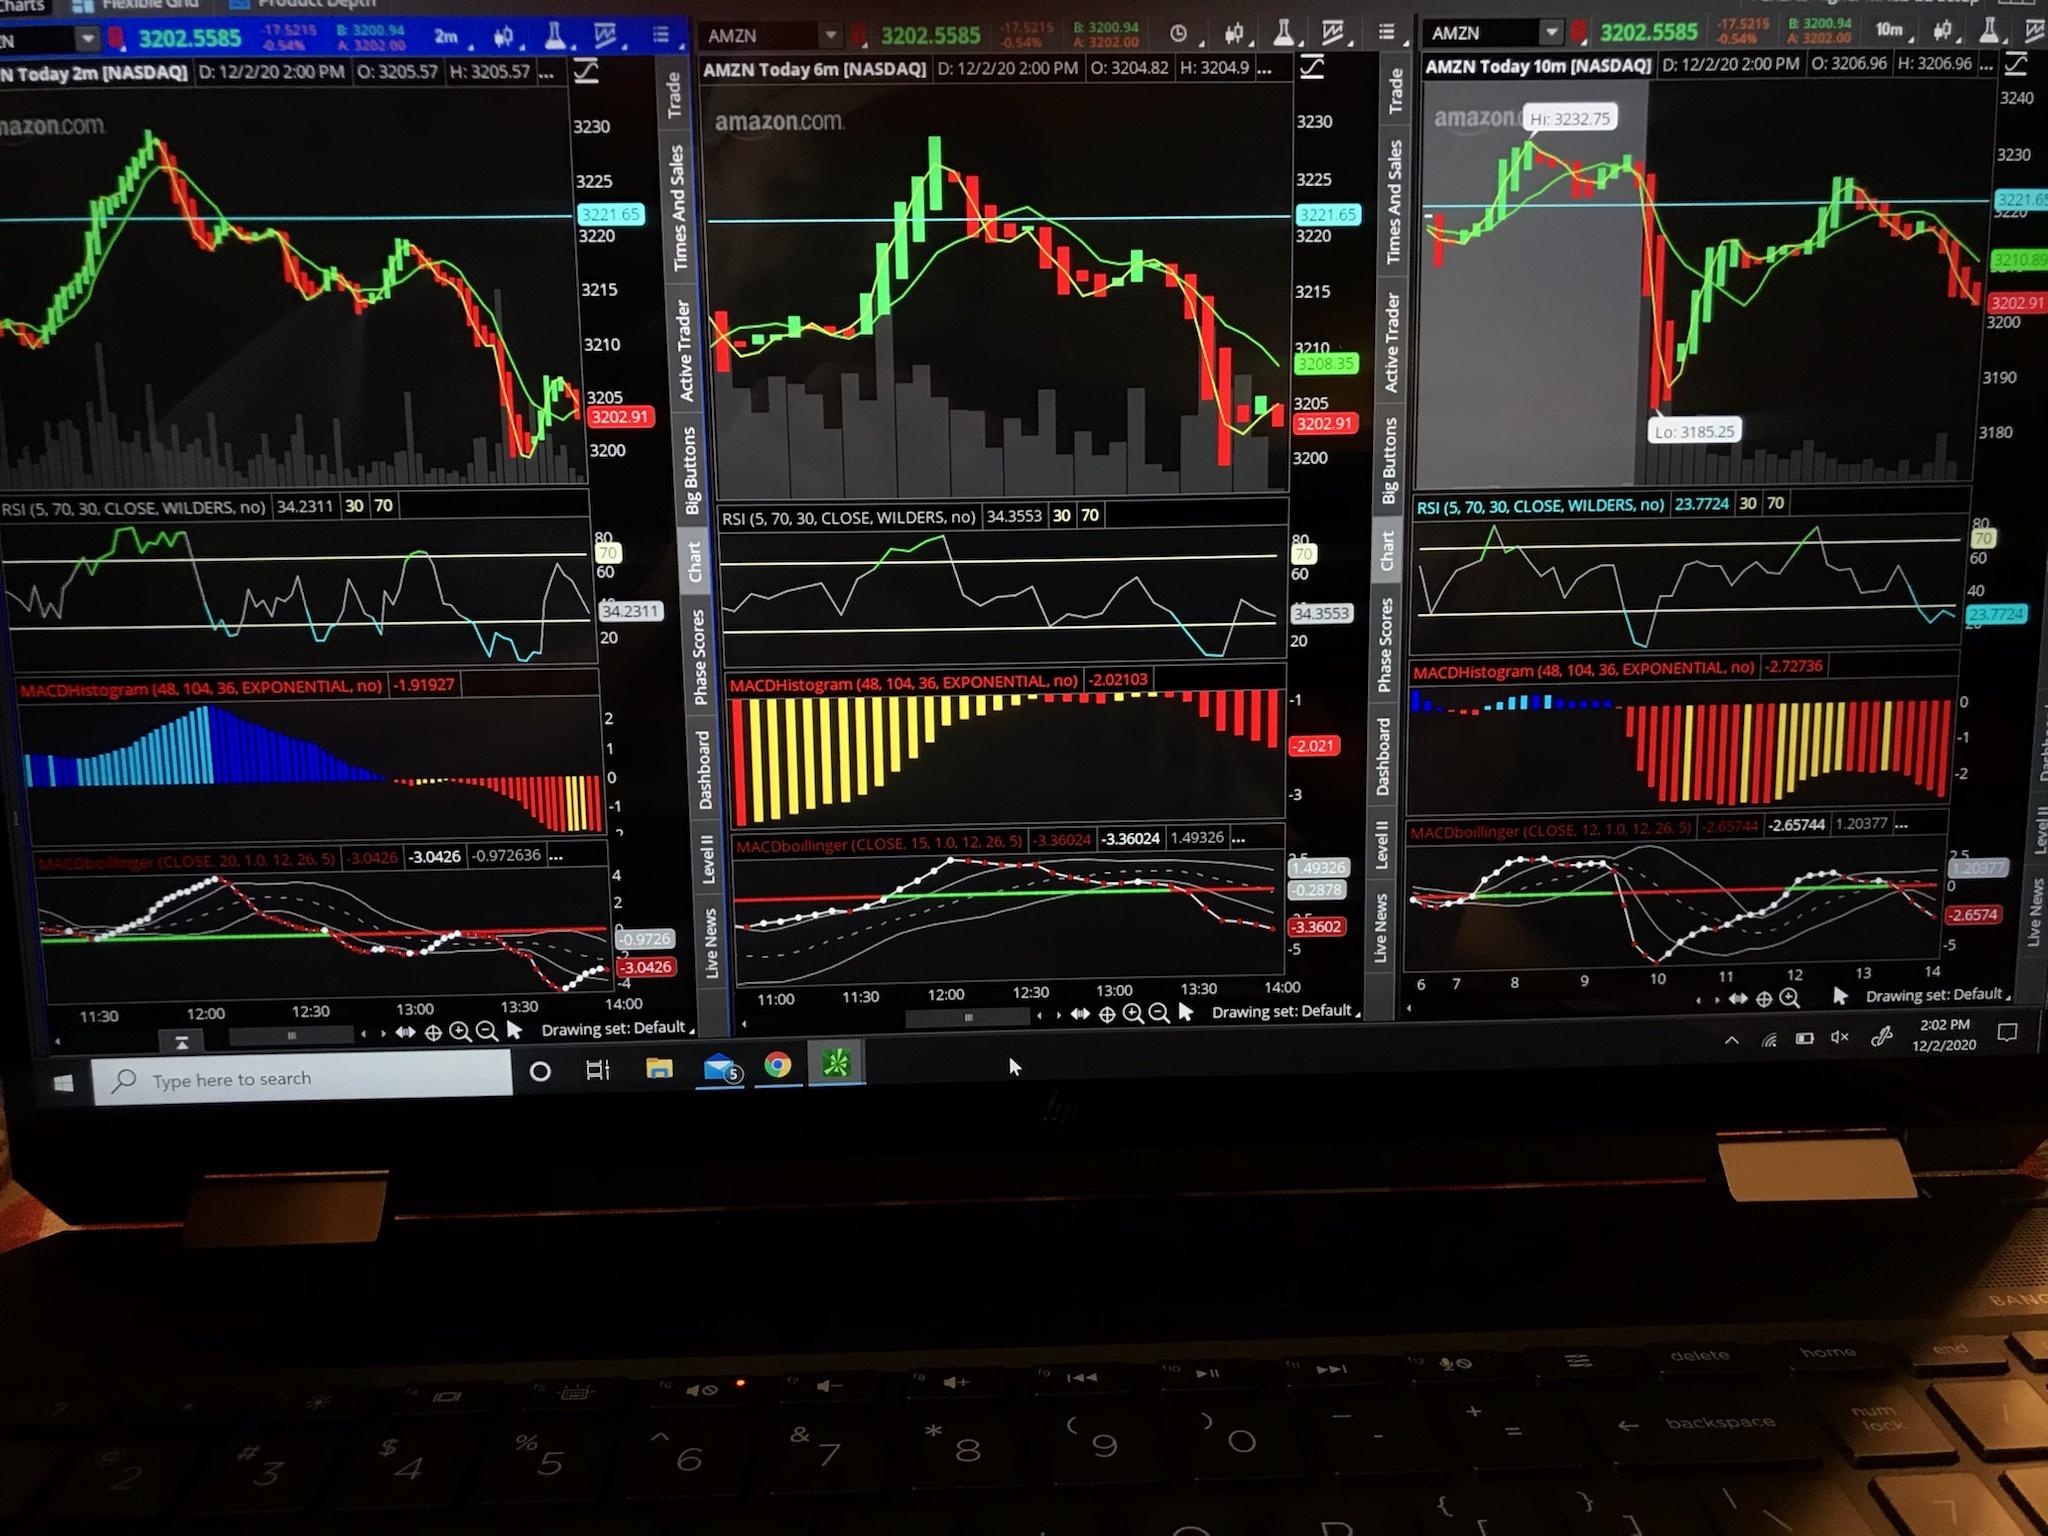
Ben...you're a genius with this indicator! I've been testing it for a week or so and put it to use this week. I've tweaked it with different timeframes 2/6/10 and each has a different setting since it needs to adjust for those timeframes - 2min is 20, 6min is 15 and the 10min is 12. For a put...I wait until all 3 have crossed below the bottom line of the Bollinger band and for a call all 3 need to be above the top line of the Bollinger band, I also use the MACD histogram for additional confirmation - that is set to 48/104/36 on each timeframe.

I'm 3 for 3 this week for $7500 profit. This indicator has made me become very patient, by waiting for the "perfect" moment when they have all crossed over.

Thank you for having the ability to see that indicators like this would be helpful!

Kbnmv0E.jpg
Thanks for your contribution here. This is amazing. Question for you...have you found settings that work well on the hourly and daily time frames for swings? @Hypoluxa
 
Thanks for your contribution here. This is amazing. Question for you...have you found settings that work well on the hourly and daily time frames for swings? @Hypoluxa
You’re welcome!
No, I’ve never tried a timeframe that high. To be honest, I finally made myself move up to 10 mins just a couple of months ago. Lol
 
You’re welcome!
No, I’ve never tried a timeframe that high. To be honest, I finally made myself move up to 10 mins just a couple of months ago. Lol
Lol got it! Do you still use the macd histogram or have you switched to ttm squeeze....I saw on your amazon put method you use ttm and dmi instead of macd histogram @Hypoluxa
 
I'm very fond of the Histogram...I switch back and forth from time to time with that one and a couple others. But for now...its TTM
 

Join useThinkScript to post your question to a community of 21,000+ developers and traders.

Similar threads

Not the exact question you're looking for?

Start a new thread and receive assistance from our community.

87k+ Posts
341 Online
Create Post

Similar threads

Similar threads

The Market Trading Game Changer

Join 2,500+ subscribers inside the useThinkScript VIP Membership Club
  • Exclusive indicators
  • Proven strategies & setups
  • Private Discord community
  • ‘Buy The Dip’ signal alerts
  • Exclusive members-only content
  • Add-ons and resources
  • 1 full year of unlimited support

Frequently Asked Questions

What is useThinkScript?

useThinkScript is the #1 community of stock market investors using indicators and other tools to power their trading strategies. Traders of all skill levels use our forums to learn about scripting and indicators, help each other, and discover new ways to gain an edge in the markets.

How do I get started?

We get it. Our forum can be intimidating, if not overwhelming. With thousands of topics, tens of thousands of posts, our community has created an incredibly deep knowledge base for stock traders. No one can ever exhaust every resource provided on our site.

If you are new, or just looking for guidance, here are some helpful links to get you started.

What are the benefits of VIP Membership?
VIP members get exclusive access to these proven and tested premium indicators: Buy the Dip, Advanced Market Moves 2.0, Take Profit, and Volatility Trading Range. In addition, VIP members get access to over 50 VIP-only custom indicators, add-ons, and strategies, private VIP-only forums, private Discord channel to discuss trades and strategies in real-time, customer support, trade alerts, and much more. Learn all about VIP membership here.
How can I access the premium indicators?
To access the premium indicators, which are plug and play ready, sign up for VIP membership here.
Back
Top