MACD Wave Strength For ThinkOrSwim

Thinker

Member
VIP
I created this new MACD indicator yesterday, so I can't vouch for it yet. I'd love to see people's thoughts and possible tweaks to improve it if it seems interesting to anyone.

I am not a coder, but I'm good with AI. The indicator I'm going to show was created by me working with AI to get a good swing trading indicator (not a standalone indicator to make trading decisions).

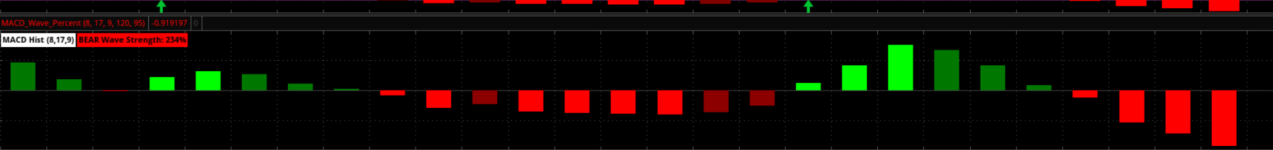
When I use MACD, I change the settings to 8/17/9 instead of the default settings. I've back tested my settings versus the standard ones and have seen better results. I also subscribe to VectorVest that allows quick proprietary back testing, and my settings also show better results than the standard ones. I asked AI if my settings make sense, and it said they do (keep in mind that AI tends to be very complimentary, so take its answers to my questions with that in mind).

The other way I use MACD is to compare the size of the histograms to the size of a prior histograms during moves. I asked AI if that's a good way to use MACD, and it responded that it's the best way to use it.

When I started asking AI to create a workable code for ThinkScript, the first attempts contained multiple errors that I eventually got corrected. The more I threw at AI, the more complex the indicator became.

The "final" version does not repaint though the current one-hour bar will repaint until the bar closes.

This indicator is non-repainting (closed bars do not change) and is intended as a momentum quality filter, not a standalone buy/sell signal. It works best when combined with trend and location tools such as EMAs and VWAP to help avoid low-quality breakouts and manage continuation trades."

I haven't used VWAP, so I need to look into that as an indicator to use with the new MACD I'm about to post. With the new MACD, I mentioned I also use three EMAs (5, 8, and 21); AI said those are great indicators to use as complementary, confirming indicators.

See the next post for updated code.
 

Attachments

  • 1768411285737.png
    1768411285737.png
    45.5 KB · Views: 83
Last edited by a moderator:
I have combined the strength interpretation into one of the ones I use.
This is extremely powerful I think.

mod note:
How to Use the Updated MACD Hybrid

The updated MACD Hybrid is a momentum dashboard. It doesn’t tell you when to enter — it tells you whether the environment is helping you, hurting you, or warning you. Use it to confirm the strength behind your idea, not to generate the idea itself.

Histogram — Momentum Read
Bright GreenStrong upside pushLongs have wind at their back.
Dark GreenUpside slowingDon’t chase; tighten risk.
Bright RedStrong downside pushShorts have wind at their back.
Dark RedDownside slowingDon’t chase; tighten risk.

Zero‑Line Cross Arrows — Momentum Shift Alert
Cyan Up ArrowMomentum turning up from weak territoryConfirms long ideas already forming.
Magenta Down ArrowMomentum turning down from strong territoryConfirms short ideas already forming.

High‑Volume Spike — Conviction Check
White Up ArrowVolume is unusually highTreat moves as higher‑conviction; confirms follow‑through potential.

Divergence — Early Warning System
Bullish DivergencePrice makes a lower low but momentum doesn’tWatch for reversal setups; don’t pre‑empt.
Bearish DivergencePrice makes a higher high but momentum doesn’tWatch for exhaustion; protect profits.

Wave Strength — Trend Quality Meter
Strong Bull WaveCurrent push is stronger than the lastFavor continuation longs.
OK Bull WaveNormal bullish pressureSafe to follow if structure agrees.
Strong Bear WaveCurrent drop is stronger than the lastFavor continuation shorts.
OK Bear WaveNormal bearish pressureSafe to follow if structure agrees.
NeutralNo active waveDon’t rely on MACD here; use structure.

Momentum Slope — “Is It Getting Better or Worse?” Meter
PositiveMomentum improvingHold winners; continuation likely.
NegativeMomentum fadingAvoid chasing; expect hesitation.

MACD Line Above/Below Zero — Bias Filter
Above ZeroBullish backdropLongs have tailwind.
Below ZeroBearish backdropShorts have tailwind.

How MACD Hybrid Fits Into Your 3‑Chart Workflow
TimeframeHow MACD Hybrid Helps
High Timeframe Adds almost nothing; structure does the heavy lifting here.
Middle TimeframeThis is where it shines; confirms whether the environment supports your idea.
Short Timeframe Too slow; always late. Use structure for timing instead.


Putting It All Together
SituationWhat to Look ForWhat It Tells You
Thinking LongGreen bars, positive slope, MACD above zero, volume spikeEnvironment supports longs.
Thinking ShortRed bars, negative slope, MACD below zero, volume spikeEnvironment supports shorts.
Avoiding TroubleDark colors, fading slope, no volumeWeak conditions; wait.
Watching for ReversalDivergence + slowing colorsPrepare, don’t jump early.
Riding a TrendStrong wave + matching histogramTrend has quality; stay with it.


Code:
DECLARE LOWER;

############################
# === MACD CORE (Script 2) ===
############################
input fastLength = 12;
input slowLength = 26;
input MACDLength = 9;
input averageType = AverageType.EXPONENTIAL;

input HighVolume = yes;
input VolumeAveragingLength = 20;
input VolumePercentThreshold = 60;

plot Value = MovingAverage(averageType, close, fastLength) -
             MovingAverage(averageType, close, slowLength);
plot Avg = MovingAverage(averageType, Value, MACDLength);
plot Diff = Value - Avg;
plot ZeroLine = 0;

ZeroLine.SetDefaultColor(GetColor(0));

Value.SetDefaultColor(GetColor(1));
Avg.SetDefaultColor(GetColor(8));
Diff.SetPaintingStrategy(PaintingStrategy.HISTOGRAM);
Diff.SetLineWeight(3);

Diff.DefineColor("Positive and Up", Color.GREEN);
Diff.DefineColor("Positive and Down", Color.DARK_GREEN);
Diff.DefineColor("Negative and Down", Color.RED);
Diff.DefineColor("Negative and Up", Color.DARK_RED);

Diff.AssignValueColor(
    if Diff >= 0 then
        if Diff > Diff[1] then Diff.Color("Positive and Up")
        else Diff.Color("Positive and Down")
    else
        if Diff < Diff[1] then Diff.Color("Negative and Down")
        else Diff.Color("Negative and Up")
);

#################################
# === HIGH VOLUME LOGIC (Script 2)
#################################
def aVol = Average(volume, VolumeAveragingLength);
def pVol = 100 * ((volume - aVol[1]) / aVol[1]);
def HV = pVol >= VolumePercentThreshold and HighVolume;

plot HiVolArrow = if HV then 0 else Double.NaN;
HiVolArrow.SetPaintingStrategy(PaintingStrategy.ARROW_UP);
HiVolArrow.SetDefaultColor(Color.WHITE);
HiVolArrow.HideTitle();
HiVolArrow.HideBubble();

#################################
# === SIGNALS & ALERTS (Script 2)
#################################
def ValueCrossBelowZeroline = Value[1] < Avg[1] and Value[1] < 0 and Value > Avg;
plot belowZeroCross = if ValueCrossBelowZeroline then Value else Double.NaN;
belowZeroCross.SetPaintingStrategy(PaintingStrategy.ARROW_UP);
belowZeroCross.SetDefaultColor(Color.CYAN);

def ValueCrossAboveZeroline = Value[1] > Avg[1] and Value[1] > 0 and Value < Avg;
plot aboveZeroCross = if ValueCrossAboveZeroline then Value else Double.NaN;
aboveZeroCross.SetPaintingStrategy(PaintingStrategy.ARROW_DOWN);
aboveZeroCross.SetDefaultColor(Color.MAGENTA);

Alert(aboveZeroCross, "ValueCrossAboveZeroline", Alert.BAR, Sound.Bell);
Alert(belowZeroCross, "ValueCrossBelowZeroline", Alert.BAR, Sound.Ding);

#################################
# === LABELS (Script 2)
#################################
AddLabel(yes,
    "MACD Momentum: " + Round(Diff, 2),
    if Diff >= 0 then
        (if Diff > Diff[1] then Color.GREEN else Color.DARK_GREEN)
    else
        (if Diff < Diff[1] then Color.RED else Color.DARK_RED)
);

AddLabel(yes,
    if Value > 0 then "MACD Line Above Zero" else "MACD Line Below Zero",
    if Value > 0 then Color.GREEN else Color.RED
);

AddLabel(HV, "High Volume Spike", Color.YELLOW);

def StrongBullishSignal = belowZeroCross and HV;
AddLabel(StrongBullishSignal, "Strong Bullish Signal (MACD + Volume)", Color.LIGHT_GREEN);

def momentumSlope = Diff - Diff[1];
AddLabel(yes,
    "Momentum Slope: " + Round(momentumSlope, 2),
    if momentumSlope > 0 then Color.GREEN else Color.RED
);

#################################
# === DIVERGENCE (Script 2)
#################################
def priceHigh = high > high[1] and high > high[2];
def priceLow  = low  < low[1]  and low  < low[2];

def macdHigh = Diff > Diff[1] and Diff > Diff[2];
def macdLow  = Diff < Diff[1] and Diff < Diff[2];

def priceHigh1 = if priceHigh then high else priceHigh1[1];
def priceLow1  = if priceLow  then low  else priceLow1[1];
def macdHigh1  = if macdHigh  then Diff else macdHigh1[1];
def macdLow1   = if macdLow   then Diff else macdLow1[1];

def bullishDiv = low  < priceLow1  and Diff > macdLow1;
def bearishDiv = high > priceHigh1 and Diff < macdHigh1;

AddLabel(bullishDiv, "Bullish Divergence", Color.GREEN);
AddLabel(bearishDiv, "Bearish Divergence", Color.RED);

#################################################
# === WAVE STRENGTH LOGIC (FROM SCRIPT 1 – ADDED)
#################################################
input strongPct = 120;
input okPct     = 95;

def bullWave = Diff > 0;
def bearWave = Diff < 0;

def bullStart = Diff crosses above 0;
def bearStart = Diff crosses below 0;

def bullEnd = Diff crosses below 0;
def bearEnd = Diff crosses above 0;

# Current wave peak
def curBullPeak =
    CompoundValue(1,
        if bullStart then Diff
        else if bullWave then Max(curBullPeak[1], Diff)
        else curBullPeak[1],
    Diff);

def curBearPeakAbs =
    CompoundValue(1,
        if bearStart then AbsValue(Diff)
        else if bearWave then Max(curBearPeakAbs[1], AbsValue(Diff))
        else curBearPeakAbs[1],
    AbsValue(Diff));

# Previous completed wave peaks
def prevBullPeak =
    CompoundValue(1,
        if bullEnd then curBullPeak[1] else prevBullPeak[1],
    Double.NaN);

def prevBearPeakAbs =
    CompoundValue(1,
        if bearEnd then curBearPeakAbs[1] else prevBearPeakAbs[1],
    Double.NaN);

# Percent strength
def bullPct =
    if prevBullPeak > 0 then (curBullPeak / prevBullPeak) * 100 else Double.NaN;

def bearPct =
    if prevBearPeakAbs > 0 then (curBearPeakAbs / prevBearPeakAbs) * 100 else Double.NaN;

# Wave strength label
AddLabel(yes,
    if bullWave and !IsNaN(bullPct) then
        "BULL Wave Strength: " + Round(bullPct, 0) + "%"
    else if bearWave and !IsNaN(bearPct) then
        "BEAR Wave Strength: " + Round(bearPct, 0) + "%"
    else
        "Wave Strength: Neutral",
    if bullWave and bullPct >= strongPct then Color.GREEN
    else if bullWave and bullPct >= okPct then Color.YELLOW
    else if bearWave and bearPct >= strongPct then Color.RED
    else if bearWave and bearPct >= okPct then CreateColor(255,165,0)
    else Color.LIGHT_GRAY
);
 
Last edited by a moderator:
I have combined the strength interpretation into one of the ones I use, now I have the following:
LayerWhat it tells you
MACD Histogram + slopeDirection & acceleration
Zero-line arrowsEntry timing
Volume spike arrowsParticipation confirmation
Divergence labelsEarly reversal warnings
AlertsReal‑time triggers
Wave strength %Whether this move is weaker, equal, or stronger than the last

This is extremely powerful because you are no longer just trading signals. You are trading signal quality.
What it tells you
#MACD Histogram + slope Direction & acceleration
#Zero-line arrows Entry timing
#Volume spike arrows Participation confirmation
#Divergence labels Early reversal warnings
#Alerts Real‑time triggers
#Wave strength % Whether this move is weaker, equal, or stronger than the last

This is extremely powerful I think.

Code:
DECLARE LOWER;

############################
# === MACD CORE (Script 2) ===
############################
input fastLength = 12;
input slowLength = 26;
input MACDLength = 9;
input averageType = AverageType.EXPONENTIAL;

input HighVolume = yes;
input VolumeAveragingLength = 20;
input VolumePercentThreshold = 60;

plot Value = MovingAverage(averageType, close, fastLength) -
             MovingAverage(averageType, close, slowLength);
plot Avg = MovingAverage(averageType, Value, MACDLength);
plot Diff = Value - Avg;
plot ZeroLine = 0;

ZeroLine.SetDefaultColor(GetColor(0));

Value.SetDefaultColor(GetColor(1));
Avg.SetDefaultColor(GetColor(8));
Diff.SetPaintingStrategy(PaintingStrategy.HISTOGRAM);
Diff.SetLineWeight(3);

Diff.DefineColor("Positive and Up", Color.GREEN);
Diff.DefineColor("Positive and Down", Color.DARK_GREEN);
Diff.DefineColor("Negative and Down", Color.RED);
Diff.DefineColor("Negative and Up", Color.DARK_RED);

Diff.AssignValueColor(
    if Diff >= 0 then
        if Diff > Diff[1] then Diff.Color("Positive and Up")
        else Diff.Color("Positive and Down")
    else
        if Diff < Diff[1] then Diff.Color("Negative and Down")
        else Diff.Color("Negative and Up")
);

#################################
# === HIGH VOLUME LOGIC (Script 2)
#################################
def aVol = Average(volume, VolumeAveragingLength);
def pVol = 100 * ((volume - aVol[1]) / aVol[1]);
def HV = pVol >= VolumePercentThreshold and HighVolume;

plot HiVolArrow = if HV then 0 else Double.NaN;
HiVolArrow.SetPaintingStrategy(PaintingStrategy.ARROW_UP);
HiVolArrow.SetDefaultColor(Color.WHITE);
HiVolArrow.HideTitle();
HiVolArrow.HideBubble();

#################################
# === SIGNALS & ALERTS (Script 2)
#################################
def ValueCrossBelowZeroline = Value[1] < Avg[1] and Value[1] < 0 and Value > Avg;
plot belowZeroCross = if ValueCrossBelowZeroline then Value else Double.NaN;
belowZeroCross.SetPaintingStrategy(PaintingStrategy.ARROW_UP);
belowZeroCross.SetDefaultColor(Color.CYAN);

def ValueCrossAboveZeroline = Value[1] > Avg[1] and Value[1] > 0 and Value < Avg;
plot aboveZeroCross = if ValueCrossAboveZeroline then Value else Double.NaN;
aboveZeroCross.SetPaintingStrategy(PaintingStrategy.ARROW_DOWN);
aboveZeroCross.SetDefaultColor(Color.MAGENTA);

Alert(aboveZeroCross, "ValueCrossAboveZeroline", Alert.BAR, Sound.Bell);
Alert(belowZeroCross, "ValueCrossBelowZeroline", Alert.BAR, Sound.Ding);

#################################
# === LABELS (Script 2)
#################################
AddLabel(yes,
    "MACD Momentum: " + Round(Diff, 2),
    if Diff >= 0 then
        (if Diff > Diff[1] then Color.GREEN else Color.DARK_GREEN)
    else
        (if Diff < Diff[1] then Color.RED else Color.DARK_RED)
);

AddLabel(yes,
    if Value > 0 then "MACD Line Above Zero" else "MACD Line Below Zero",
    if Value > 0 then Color.GREEN else Color.RED
);

AddLabel(HV, "High Volume Spike", Color.YELLOW);

def StrongBullishSignal = belowZeroCross and HV;
AddLabel(StrongBullishSignal, "Strong Bullish Signal (MACD + Volume)", Color.LIGHT_GREEN);

def momentumSlope = Diff - Diff[1];
AddLabel(yes,
    "Momentum Slope: " + Round(momentumSlope, 2),
    if momentumSlope > 0 then Color.GREEN else Color.RED
);

#################################
# === DIVERGENCE (Script 2)
#################################
def priceHigh = high > high[1] and high > high[2];
def priceLow  = low  < low[1]  and low  < low[2];

def macdHigh = Diff > Diff[1] and Diff > Diff[2];
def macdLow  = Diff < Diff[1] and Diff < Diff[2];

def priceHigh1 = if priceHigh then high else priceHigh1[1];
def priceLow1  = if priceLow  then low  else priceLow1[1];
def macdHigh1  = if macdHigh  then Diff else macdHigh1[1];
def macdLow1   = if macdLow   then Diff else macdLow1[1];

def bullishDiv = low  < priceLow1  and Diff > macdLow1;
def bearishDiv = high > priceHigh1 and Diff < macdHigh1;

AddLabel(bullishDiv, "Bullish Divergence", Color.GREEN);
AddLabel(bearishDiv, "Bearish Divergence", Color.RED);

#################################################
# === WAVE STRENGTH LOGIC (FROM SCRIPT 1 – ADDED)
#################################################
input strongPct = 120;
input okPct     = 95;

def bullWave = Diff > 0;
def bearWave = Diff < 0;

def bullStart = Diff crosses above 0;
def bearStart = Diff crosses below 0;

def bullEnd = Diff crosses below 0;
def bearEnd = Diff crosses above 0;

# Current wave peak
def curBullPeak =
    CompoundValue(1,
        if bullStart then Diff
        else if bullWave then Max(curBullPeak[1], Diff)
        else curBullPeak[1],
    Diff);

def curBearPeakAbs =
    CompoundValue(1,
        if bearStart then AbsValue(Diff)
        else if bearWave then Max(curBearPeakAbs[1], AbsValue(Diff))
        else curBearPeakAbs[1],
    AbsValue(Diff));

# Previous completed wave peaks
def prevBullPeak =
    CompoundValue(1,
        if bullEnd then curBullPeak[1] else prevBullPeak[1],
    Double.NaN);

def prevBearPeakAbs =
    CompoundValue(1,
        if bearEnd then curBearPeakAbs[1] else prevBearPeakAbs[1],
    Double.NaN);

# Percent strength
def bullPct =
    if prevBullPeak > 0 then (curBullPeak / prevBullPeak) * 100 else Double.NaN;

def bearPct =
    if prevBearPeakAbs > 0 then (curBearPeakAbs / prevBearPeakAbs) * 100 else Double.NaN;

# Wave strength label
AddLabel(yes,
    if bullWave and !IsNaN(bullPct) then
        "BULL Wave Strength: " + Round(bullPct, 0) + "%"
    else if bearWave and !IsNaN(bearPct) then
        "BEAR Wave Strength: " + Round(bearPct, 0) + "%"
    else
        "Wave Strength: Neutral",
    if bullWave and bullPct >= strongPct then Color.GREEN
    else if bullWave and bullPct >= okPct then Color.YELLOW
    else if bearWave and bearPct >= strongPct then Color.RED
    else if bearWave and bearPct >= okPct then CreateColor(255,165,0)
    else Color.LIGHT_GRAY
);
Thanks. I've added your indicator. It looks great!
 

Join useThinkScript to post your question to a community of 21,000+ developers and traders.

Similar threads

Not the exact question you're looking for?

Start a new thread and receive assistance from our community.

87k+ Posts
626 Online
Create Post

Similar threads

Similar threads

The Market Trading Game Changer

Join 2,500+ subscribers inside the useThinkScript VIP Membership Club
  • Exclusive indicators
  • Proven strategies & setups
  • Private Discord community
  • ‘Buy The Dip’ signal alerts
  • Exclusive members-only content
  • Add-ons and resources
  • 1 full year of unlimited support

Frequently Asked Questions

What is useThinkScript?

useThinkScript is the #1 community of stock market investors using indicators and other tools to power their trading strategies. Traders of all skill levels use our forums to learn about scripting and indicators, help each other, and discover new ways to gain an edge in the markets.

How do I get started?

We get it. Our forum can be intimidating, if not overwhelming. With thousands of topics, tens of thousands of posts, our community has created an incredibly deep knowledge base for stock traders. No one can ever exhaust every resource provided on our site.

If you are new, or just looking for guidance, here are some helpful links to get you started.

What are the benefits of VIP Membership?
VIP members get exclusive access to these proven and tested premium indicators: Buy the Dip, Advanced Market Moves 2.0, Take Profit, and Volatility Trading Range. In addition, VIP members get access to over 50 VIP-only custom indicators, add-ons, and strategies, private VIP-only forums, private Discord channel to discuss trades and strategies in real-time, customer support, trade alerts, and much more. Learn all about VIP membership here.
How can I access the premium indicators?
To access the premium indicators, which are plug and play ready, sign up for VIP membership here.
Back
Top