MACD Histogram label

Nari2007

Member
looking for some help getting a code for Macd Histogram Label,,, i was able to get a label for the Lines, Macd Histogram Values as label, if can add the feature to turn red when below 0 and green when histogram is forming above 0 line,

see chart.
 

Join useThinkScript to post your question to a community of 21,000+ developers and traders.

@Nari2007
Was just getting ready to post that the value of 'Diff' is the histogram value.
Just copy the label you have and change 'Value' to 'Diff'.
that is 100% exactly what i did,,,, thank you soo much,,,,,,

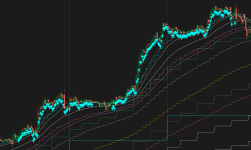
would you be able to help out with coding a label that shows bullish when ema stack are stacked up and bearish when stacked down on all time frames,? i use 8/21/34/55/89/ on D/4H/1H/ id like to get a label on a single chart rather than having 4 charts with emas on it,

this is what i have for code so far, figure that 55/89 crossing is the same as the whole stack crossing?

input MAtype = AverageType.EXPONENTIAL;
input ShortAverage = 55;
input LongAverage = 89;


def MA_1day_close;
def MA_1day_shortAvg;
def MA_1day_longAvg;
def MA_1day_higher;
def MA_1day_lower;
def MA_1day_same;
def MA_1day_nowcrossing;
if GetAggregationPeriod() <= AggregationPeriod.DAY {
MA_1day_close = close(period="Day");
MA_1day_shortAvg = MovingAverage(MAtype, MA_1day_close, ShortAverage);
MA_1day_longAvg = MovingAverage(MAtype,MA_1day_close, LongAverage);
MA_1day_nowcrossing = if Crosses(MA_1day_shortAvg, MA_1day_longAvg, CrossingDirection.ANY) then 1 else 0;
MA_1day_same = if MA_1day_nowcrossing == 1 then 1 else Double.NaN;
if MA_1day_same == 1 {
MA_1day_higher = Double.NaN;
MA_1day_lower = Double.NaN;
} else {
MA_1day_higher = if MA_1day_shortAvg >= MA_1day_longAvg[1] then 1 else Double.NaN;
MA_1day_lower = if MA_1day_shortAvg < MA_1day_longAvg[1] then 1 else Double.NaN;
}
} else {
MA_1day_close = 0;
MA_1day_shortAvg = 0;
MA_1day_longAvg = 0;
MA_1day_higher = Double.NaN;
MA_1day_lower = Double.NaN;
MA_1day_same = Double.NaN;
MA_1day_nowcrossing = 0;
}
AddLabel(MA_1day_higher, "1D", Color.DARK_GREEN);
AddLabel(MA_1day_lower, "1D", Color.DARK_RED);
AddLabel(MA_1day_same, "1D", Color.WHITE);

def MA_4hour_close;
def MA_4hour_shortAvg;
def MA_4hour_longAvg;
def MA_4hour_higher;
def MA_4hour_lower;
def MA_4hour_same;
def MA_4hour_nowcrossing;
if GetAggregationPeriod() <= AggregationPeriod.FOUR_HOURS {
MA_4hour_close = close(period="4 hours");
MA_4hour_shortAvg = MovingAverage(MAtype, MA_4hour_close, ShortAverage);
MA_4hour_longAvg = MovingAverage(MAtype,MA_4hour_close, LongAverage);
MA_4hour_nowcrossing = if Crosses(MA_4hour_shortAvg, MA_4hour_longAvg, CrossingDirection.ANY) then 1 else 0;
MA_4hour_same = if MA_4hour_nowcrossing == 1 then 1 else Double.NaN;
if MA_4hour_same == 1 {
MA_4hour_higher = Double.NaN;
MA_4hour_lower = Double.NaN;
} else {
MA_4hour_higher = if MA_4hour_shortAvg >= MA_4hour_longAvg[1] then 1 else Double.NaN;
MA_4hour_lower = if MA_4hour_shortAvg < MA_4hour_longAvg[1] then 1 else Double.NaN;
}
} else {
MA_4hour_close = 0;
MA_4hour_shortAvg = 0;
MA_4hour_longAvg = 0;
MA_4hour_higher = Double.NaN;
MA_4hour_lower = Double.NaN;
MA_4hour_same = Double.NaN;
MA_4hour_nowcrossing = 0;
}
AddLabel(MA_4hour_higher, "4h", Color.DARK_GREEN);
AddLabel(MA_4hour_lower, "4h", Color.DARK_RED);
AddLabel(MA_4hour_same, "4h", Color.WHITE);


def MA_1hour_close;
def MA_1hour_shortAvg;
def MA_1hour_longAvg;
def MA_1hour_higher;
def MA_1hour_lower;
def MA_1hour_same;
def MA_1hour_nowcrossing;
if GetAggregationPeriod() <= AggregationPeriod.HOUR {
MA_1hour_close = close(period="1 hour");
MA_1hour_shortAvg = MovingAverage(MAtype, MA_1hour_close, ShortAverage);
MA_1hour_longAvg = MovingAverage(MAtype,MA_1hour_close, LongAverage);
MA_1hour_nowcrossing = if Crosses(MA_1hour_shortAvg, MA_1hour_longAvg, CrossingDirection.ANY) then 1 else 0;
MA_1hour_same = if MA_1hour_nowcrossing == 1 then 1 else Double.NaN;
if MA_1hour_same == 1 {
MA_1hour_higher = Double.NaN;
MA_1hour_lower = Double.NaN;
} else {
MA_1hour_higher = if MA_1hour_shortAvg >= MA_1hour_longAvg[1] then 1 else Double.NaN;
MA_1hour_lower = if MA_1hour_shortAvg < MA_1hour_longAvg[1] then 1 else Double.NaN;
}
} else {
MA_1hour_close = 0;
MA_1hour_shortAvg = 0;
MA_1hour_longAvg = 0;
MA_1hour_higher = Double.NaN;
MA_1hour_lower = Double.NaN;
MA_1hour_same = Double.NaN;
MA_1hour_nowcrossing = 0;
}
AddLabel(MA_1hour_higher, "1h", Color.DARK_GREEN);
AddLabel(MA_1hour_lower, "1h", Color.DARK_RED);
AddLabel(MA_1hour_same, "1h", Color.WHITE);


def MA_15min_close;
def MA_15min_shortAvg;
def MA_15min_longAvg;
def MA_15min_higher;
def MA_15min_lower;
def MA_15min_same;
def MA_15min_nowcrossing;
if GetAggregationPeriod() <= AggregationPeriod.FIFTEEN_MIN {
MA_15min_close = close(period="15 min");
MA_15min_shortAvg = MovingAverage(MAtype, MA_15min_close, ShortAverage);
MA_15min_longAvg = MovingAverage(MAtype,MA_15min_close, LongAverage);
MA_15min_nowcrossing = if Crosses(MA_15min_shortAvg, MA_15min_longAvg, CrossingDirection.ANY) then 1 else 0;
MA_15min_same = if MA_15min_nowcrossing == 1 then 1 else Double.NaN;
if MA_15min_same == 1 {
MA_15min_higher = Double.NaN;
MA_15min_lower = Double.NaN;
} else {
MA_15min_higher = if MA_15min_shortAvg >= MA_15min_longAvg[1] then 1 else Double.NaN;
MA_15min_lower = if MA_15min_shortAvg < MA_15min_longAvg[1] then 1 else Double.NaN;
}
} else {
MA_15min_close = 0;
MA_15min_shortAvg = 0;
MA_15min_longAvg = 0;
MA_15min_higher = Double.NaN;
MA_15min_lower = Double.NaN;
MA_15min_same = Double.NaN;
MA_15min_nowcrossing = 0;
}
AddLabel(MA_15min_higher, "15m", Color.DARK_GREEN);
AddLabel(MA_15min_lower, "15m", Color.DARK_RED);
AddLabel(MA_15min_same, "15m", Color.WHITE);
 
@Nari2007
Let me make sure I understand, you're watching EMA's of five different lengths on four different Aggregations, 20 EMA's in total;
And you want to know when they are lined up shortest length to longest length and shortest timeframe to longest time frame;
And vice versa.
Correct?
 
Last edited:
@Nari2007
Have to admit, I was a little skeptical about this one, plotted some arrows to see if they ever all lined up.

Ruby:
def averageType = AverageType.EXPONENTIAL;
def PeriodD = AggregationPeriod.DAY;
def Period4H = AggregationPeriod.FOUR_HOURS;
def PeriodH = AggregationPeriod.HOUR;
def Period15M = AggregationPeriod.FIFTEEN_MIN;

def Length8 = 8;
def Length21 = 21;
def Length34 = 34;
def Length55 = 55;
def Length89 = 89;

plot MAD8 = MovingAverage(averageType, close(period=PeriodD),Length8);
plot MAD21 = MovingAverage(averageType, close(period=PeriodD),Length21);
plot MAD34 = MovingAverage(averageType, close(period=PeriodD),Length34);
plot MAD55 = MovingAverage(averageType, close(period=PeriodD),Length55);
plot MAD89 = MovingAverage(averageType, close(period=PeriodD),Length89);

def BullD = MAD8>MAD21 and MAD21>MAD34 and MAD34>MAD55 and MAD55>MAD89;
def BearD = MAD8<MAD21 and MAD21<MAD34 and MAD34<MAD55 and MAD55<MAD89;

plot MA4H8 = MovingAverage(averageType, close(period=Period4H),Length8);
plot MA4H21 = MovingAverage(averageType, close(period=Period4H),Length21);
plot MA4H34 = MovingAverage(averageType, close(period=Period4H),Length34);
plot MA4H55 = MovingAverage(averageType, close(period=Period4H),Length55);
plot MA4H89 = MovingAverage(averageType, close(period=Period4H),Length89);

def Bull4H = MA4H8>MA4H21 and MA4H21>MA4H34 and MA4H34>MA4H55 and MA4H55>MA4H89;
def Bear4H = MA4H8<MA4H21 and MA4H21<MA4H34 and MA4H34<MA4H55 and MA4H55<MA4H89;

plot MAH8 = MovingAverage(averageType, close(period=PeriodH),Length8);
plot MAH21 = MovingAverage(averageType, close(period=PeriodH),Length21);
plot MAH34 = MovingAverage(averageType, close(period=PeriodH),Length34);
plot MAH55 = MovingAverage(averageType, close(period=PeriodH),Length55);
plot MAH89 = MovingAverage(averageType, close(period=PeriodH),Length89);

def BullH = MAH8>MAH21 and MAH21>MAH34 and MAH34>MAH55 and MAH55>MAH89;
def BearH = MAH8<MAH21 and MAH21<MAH34 and MAH34<MAH55 and MAH55<MAH89;

plot MA15M8 = MovingAverage(averageType, close(period=Period15M),Length8);
plot MA15M21 = MovingAverage(averageType, close(period=Period15M),Length21);
plot MA15M34 = MovingAverage(averageType, close(period=Period15M),Length34);
plot MA15M55 = MovingAverage(averageType, close(period=Period15M),Length55);
plot MA15M89 = MovingAverage(averageType, close(period=Period15M),Length89);

def Bull15M = MA15M8>MA15M21 and MA15M21>MA15M34 and MA15M34>MA15M55 and MA15M55>MA15M89;
def Bear15M = MA15M8<MA15M21 and MA15M21<MA15M34 and MA15M34<MA15M55 and MA15M55<MA15M89;

def BullAll = BullD and Bull4H and BullH and Bull15M;
def BearAll = BearD and Bear4H and BearH and Bear15M;

Addlabel(yes,if BullAll then "Stacked Up" else if BearAll then "Stacked Down" else "No Stack",
        if BullAll then Color.Green else if BearAll then Color.Red else Color.Orange);

plot Bull = BullAll;
Bull.SetPaintingStrategy(paintingStrategy.BOOLEAN_ARROW_UP);
Bull.SetLineWeight(5);
plot Bear = BearAll;
Bear.SetPaintingStrategy(paintingStrategy.BOOLEAN_ARROW_Down);
Bear.SetLineWeight(5);
WR5D32C.png
QFrMjn6.png
 

Attachments

  • WR5D32C.png
    WR5D32C.png
    134.9 KB · Views: 272
@Nari2007
Have to admit, I was a little skeptical about this one, plotted some arrows to see if they ever all lined up.

Ruby:
def averageType = AverageType.EXPONENTIAL;
def PeriodD = AggregationPeriod.DAY;
def Period4H = AggregationPeriod.FOUR_HOURS;
def PeriodH = AggregationPeriod.HOUR;
def Period15M = AggregationPeriod.FIFTEEN_MIN;

def Length8 = 8;
def Length21 = 21;
def Length34 = 34;
def Length55 = 55;
def Length89 = 89;

plot MAD8 = MovingAverage(averageType, close(period=PeriodD),Length8);
plot MAD21 = MovingAverage(averageType, close(period=PeriodD),Length21);
plot MAD34 = MovingAverage(averageType, close(period=PeriodD),Length34);
plot MAD55 = MovingAverage(averageType, close(period=PeriodD),Length55);
plot MAD89 = MovingAverage(averageType, close(period=PeriodD),Length89);

def BullD = MAD8>MAD21 and MAD21>MAD34 and MAD34>MAD55 and MAD55>MAD89;
def BearD = MAD8<MAD21 and MAD21<MAD34 and MAD34<MAD55 and MAD55<MAD89;

plot MA4H8 = MovingAverage(averageType, close(period=Period4H),Length8);
plot MA4H21 = MovingAverage(averageType, close(period=Period4H),Length21);
plot MA4H34 = MovingAverage(averageType, close(period=Period4H),Length34);
plot MA4H55 = MovingAverage(averageType, close(period=Period4H),Length55);
plot MA4H89 = MovingAverage(averageType, close(period=Period4H),Length89);

def Bull4H = MA4H8>MA4H21 and MA4H21>MA4H34 and MA4H34>MA4H55 and MA4H55>MA4H89;
def Bear4H = MA4H8<MA4H21 and MA4H21<MA4H34 and MA4H34<MA4H55 and MA4H55<MA4H89;

plot MAH8 = MovingAverage(averageType, close(period=PeriodH),Length8);
plot MAH21 = MovingAverage(averageType, close(period=PeriodH),Length21);
plot MAH34 = MovingAverage(averageType, close(period=PeriodH),Length34);
plot MAH55 = MovingAverage(averageType, close(period=PeriodH),Length55);
plot MAH89 = MovingAverage(averageType, close(period=PeriodH),Length89);

def BullH = MAH8>MAH21 and MAH21>MAH34 and MAH34>MAH55 and MAH55>MAH89;
def BearH = MAH8<MAH21 and MAH21<MAH34 and MAH34<MAH55 and MAH55<MAH89;

plot MA15M8 = MovingAverage(averageType, close(period=Period15M),Length8);
plot MA15M21 = MovingAverage(averageType, close(period=Period15M),Length21);
plot MA15M34 = MovingAverage(averageType, close(period=Period15M),Length34);
plot MA15M55 = MovingAverage(averageType, close(period=Period15M),Length55);
plot MA15M89 = MovingAverage(averageType, close(period=Period15M),Length89);

def Bull15M = MA15M8>MA15M21 and MA15M21>MA15M34 and MA15M34>MA15M55 and MA15M55>MA15M89;
def Bear15M = MA15M8<MA15M21 and MA15M21<MA15M34 and MA15M34<MA15M55 and MA15M55<MA15M89;

def BullAll = BullD and Bull4H and BullH and Bull15M;
def BearAll = BearD and Bear4H and BearH and Bear15M;

Addlabel(yes,if BullAll then "Stacked Up" else if BearAll then "Stacked Down" else "No Stack",
        if BullAll then Color.Green else if BearAll then Color.Red else Color.Orange);

plot Bull = BullAll;
Bull.SetPaintingStrategy(paintingStrategy.BOOLEAN_ARROW_UP);
Bull.SetLineWeight(5);
plot Bear = BearAll;
Bear.SetPaintingStrategy(paintingStrategy.BOOLEAN_ARROW_Down);
Bear.SetLineWeight(5);
WR5D32C.png
QFrMjn6.png
thank you that is awesome, nice that you added the feature to plot the Emas also, i will backtest it a bit then i can clean up my chart and just use the labels on 1 chart,,
 

Attachments

  • WR5D32C.png
    WR5D32C.png
    134.9 KB · Views: 228
looking for some help getting a code for Macd Histogram Label,,, i was able to get a label for the Lines, Macd Histogram Values as label, if can add the feature to turn red when below 0 and green when histogram is forming above 0 line,

see chart.
Do you mind sharing your code for the line labels? Ive been wracking my brain playing with code, and your post is the only one I've found referencing the line labels.
 
the code is above, just copy and paste,
I meant for this label

MazaSVm.png


The only code I see just produces these labels.

u5Ht4GB.png


I started my own thread trying to figure it out on my own, but the plot values don't always match the labels.

I'm trying it two different ways. Ive had a little help. Sometimes one works, and other times the other one works. Cant figure it out.

Code:
addLabel(displayValueAvgLabels, " Value = "  + Value + "  ", if Value > Avg then Color.GREEN else Color.RED);

addLabel(displayValueAvgLabels, " Avg = "  + avg + "  ", if Avg > Value then Color.RED else Color.GREEN);

addLabel(displayValueAvgLabels, " Value = "  + Value * 1000 + "  <Thousandths>. ", if Value > Avg then Color.GREEN else Color.RED);

addLabel(displayValueAvgLabels, " Avg = "  + avg * 1000+ "  <Thousandths>. ", if Avg > Value then Color.RED else Color.GREEN);

On this one the right ones work but not the left.

7vpnhaO.png


This one, the left side works but not the right

iIX1NWc.png


The full code I'm using
Code:
declare lower;

input price = close;
input fastLength = 12;
input slowLength = 26;
input MACDLength = 9;
input AverageType = {SMA, default EMA};
input MACDLevel = 0.0;
input DrawCloud = no;
input displayBullBearLabels = yes;
input displayAbbreviatedPriceLabels = yes;
input displayVerbosePriceLabels = no;
input displayValueAvgLabels = yes;

def fastEMA = ExpAverage(price, fastLength);
def slowEMA = ExpAverage(price, slowLength);

plot Value;
plot Avg;
switch (AverageType) {
case SMA:
    Value = Average(price, fastLength) - Average(price, slowLength);
    Avg = Average(Value, MACDLength);
case EMA:
    Value = fastEMA - slowEMA;
    Avg = ExpAverage(Value, MACDLength);
}

plot Diff = Value - Avg;
plot Level = MACDLevel;

def PMACDeq = reference ReverseEngineeringMACD(price, fastLength, slowLength, MACDLength, AverageType, MACDLevel).PMACDeq;
def PMACDlevel = reference ReverseEngineeringMACD(price, fastLength, slowLength, MACDLength, AverageType, MACDLevel).PMACDlevel;
def PMACDsignal = reference ReverseEngineeringMACD(price, fastLength, slowLength, MACDLength, AverageType, MACDLevel).PMACDsignal;


Value.SetDefaultColor(GetColor(1));
Avg.SetDefaultColor(GetColor(8));
Diff.DefineColor("Positive and Up", Color.GREEN);
Diff.DefineColor("Positive and Down", Color.DARK_GREEN);
Diff.DefineColor("Negative and Down", Color.RED);
Diff.DefineColor("Negative and Up", Color.DARK_RED);
Diff.AssignValueColor(if Diff >= 0
        then if Diff > Diff[1] then Diff.Color("Positive and Up") else Diff.Color("Positive and Down")
          else if Diff < Diff[1] then Diff.Color("Negative and Down") else Diff.Color("Negative and Up"));
Diff.SetPaintingStrategy(PaintingStrategy.HISTOGRAM);
Diff.SetLineWeight(3);
Level.SetDefaultColor(GetColor(3));


Value.AssignValueColor(if Value > Avg and DrawCloud == yes
                              then Color.GREEN
                            else if Value < Avg and DrawCloud == yes
                              then Color.RED
                          else Color.CURRENT);

addLabel(displayValueAvgLabels, " Value = "  + Value + "  ", if Value > Avg then Color.GREEN else Color.RED);

addLabel(displayValueAvgLabels, " Avg = "  + avg + "  ", if Avg > Value then Color.RED else Color.GREEN);

addLabel(displayValueAvgLabels, " Value = "  + Value * 1000 + "  <Thousandths>. ", if Value > Avg then Color.GREEN else Color.RED);

addLabel(displayValueAvgLabels, " Avg = "  + avg * 1000+ "  <Thousandths>. ", if Avg > Value then Color.RED else Color.GREEN);
hey Bud, try this code.. maybe @Svanoy can assist you,,,

declare upper;


###MACD Offset Begins###


input Period = AggregationPeriod.fifTEEN_MIN;
def fastLength = 12;
def slowLength = 26;
def MACDLength = 9;
def averageType = AverageType.EXPONENTIAL;
input showBreakoutSignals = no;

def Value = MovingAverage(averageType, close(period = Period), fastLength) - MovingAverage(averageType, close(period = Period), slowLength);
def Avg = MovingAverage(averageType, Value, MACDLength);

def Diff = Value - Avg;
def MACDZeroline = 0;

def MACDGreen = if Value > Avg then 1 else 0;
def MACDRed = if Value < Avg then -0 else -0;
def MACDYellow = if MACDGreen == 0 and MACDRed == -0 then 1 else -0;

def diffGreen = if Value > Avg then 1 else 0;
def diffRed = if Value < Avg then -0 else -0;
def diffYellow = if diffGreen == 0 and diffRed == -0 then 1 else -0;

def MACDBull = if Value > 0 and Avg > 0 then 1 else 0;
def MACDBear = if Value < -0 and Avg < -0 then 0 else -0;
def MACDNeutral = if MACDBull == 0 and MACDBear == -0 then 1 else 0;

def diffBull = if Value > 0 and Avg > 0 then 1 else 0;
def diffBear = if Value < -0 and Avg < -0 then 0 else -0;
def diffNeutral = if diffBull == 0 and diffBear == -0 then 1 else 0;

#AddLabel(Yes, "OFF MACD Line"+Value, if MACDGreen then Color.GREEN else if MACDRed then Color.RED else if MACDYellow then Color.YELLOW else Color.Current);

#AddLabel(Yes, "OFF MACD Zone"+diff, if diffBull then Color.GREEN else if diffBear then Color.RED else if diffNeutral then Color.YELLOW else Color.Current);


AddLabel(yes, concat(if period < 3600000 then period/60000 + "m" else if period < 86400000 then period/3600000 + "h" else if period < 604800000 then period/86400000 + "D" else if period < 2592000000 then period/604800000 + "Wk" else if period < 31536000000 then period/2592000000 + "Mo" else period/31536000000 + "Yr", ": MACD Line "+VALue), if MACDBull then Color.GREEN else if MACDBear then Color.RED else if MACDNeutral then Color.red else Color.red);
 

Similar threads

Not the exact question you're looking for?

Start a new thread and receive assistance from our community.

87k+ Posts
321 Online
Create Post

Similar threads

Similar threads

The Market Trading Game Changer

Join 2,500+ subscribers inside the useThinkScript VIP Membership Club
  • Exclusive indicators
  • Proven strategies & setups
  • Private Discord community
  • ‘Buy The Dip’ signal alerts
  • Exclusive members-only content
  • Add-ons and resources
  • 1 full year of unlimited support

Frequently Asked Questions

What is useThinkScript?

useThinkScript is the #1 community of stock market investors using indicators and other tools to power their trading strategies. Traders of all skill levels use our forums to learn about scripting and indicators, help each other, and discover new ways to gain an edge in the markets.

How do I get started?

We get it. Our forum can be intimidating, if not overwhelming. With thousands of topics, tens of thousands of posts, our community has created an incredibly deep knowledge base for stock traders. No one can ever exhaust every resource provided on our site.

If you are new, or just looking for guidance, here are some helpful links to get you started.

What are the benefits of VIP Membership?
VIP members get exclusive access to these proven and tested premium indicators: Buy the Dip, Advanced Market Moves 2.0, Take Profit, and Volatility Trading Range. In addition, VIP members get access to over 50 VIP-only custom indicators, add-ons, and strategies, private VIP-only forums, private Discord channel to discuss trades and strategies in real-time, customer support, trade alerts, and much more. Learn all about VIP membership here.
How can I access the premium indicators?
To access the premium indicators, which are plug and play ready, sign up for VIP membership here.
Back
Top