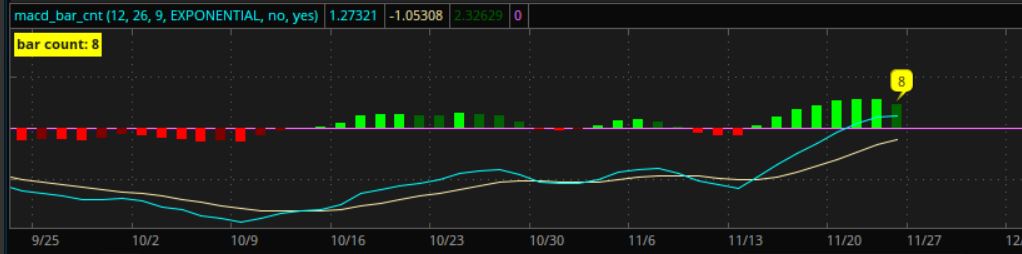
# macd_bar_cnt

#https://usethinkscript.com/threads/macd-and-ttm-histogram-count.17129/
#MACD and TTM Histogram count

# MACD
# TD Ameritrade IP Company, Inc. (c) 2007-2023

declare lower;

input fastLength = 12;
input slowLength = 26;
input MACDLength = 9;
input averageType = AverageType.EXPONENTIAL;
input showBreakoutSignals = no;

plot Value = MovingAverage(averageType, close, fastLength) - MovingAverage(averageType, close, slowLength);
plot Avg = MovingAverage(averageType, Value, MACDLength);

plot Diff = Value - Avg;
plot ZeroLine = 0;

plot UpSignal = if Diff crosses above ZeroLine then ZeroLine else Double.NaN;
plot DownSignal = if Diff crosses below ZeroLine then ZeroLine else Double.NaN;

UpSignal.SetHiding(!showBreakoutSignals);
DownSignal.SetHiding(!showBreakoutSignals);

Value.SetDefaultColor(GetColor(1));
Avg.SetDefaultColor(GetColor(8));
Diff.SetDefaultColor(GetColor(5));
Diff.SetPaintingStrategy(PaintingStrategy.HISTOGRAM);
Diff.SetLineWeight(3);
Diff.DefineColor("Positive and Up", Color.GREEN);
Diff.DefineColor("Positive and Down", Color.DARK_GREEN);
Diff.DefineColor("Negative and Down", Color.RED);
Diff.DefineColor("Negative and Up", Color.DARK_RED);
Diff.AssignValueColor(if Diff >= 0 then if Diff > Diff[1] then Diff.color("Positive and Up") else Diff.color("Positive and Down") else if Diff < Diff[1] then Diff.color("Negative and Down") else Diff.color("Negative and Up"));
ZeroLine.SetDefaultColor(GetColor(0));
UpSignal.SetDefaultColor(Color.UPTICK);
UpSignal.SetPaintingStrategy(PaintingStrategy.ARROW_UP);
DownSignal.SetDefaultColor(Color.DOWNTICK);
DownSignal.SetPaintingStrategy(PaintingStrategy.ARROW_DOWN);

#--------------------------------------

def na = double.nan;
def bn = barnumber();
def lastbn = HighestAll(If(IsNaN(close), 0, bn));
def lastbar = if (bn == lastbn) then 1 else 0;
#def lastbar = !isnan(close[0]) and isnan(close[-1]);

# if a signal crosses 0, multiplying before and after values, will be negative
#  else if (diff * diff[1]) < 0 then 1
def diffcnt = if bn == 1 then 1
 else if (diff * diff[1]) < 0 then 1
 else diffcnt[1] + 1;

addlabel(1, "bar count: " + diffcnt, color.yellow);

input count_bubble = yes;
addchartbubble(lastbar, diff*1.1,
diffcnt
, color.yellow, (if diff > 0 then 1 else 0));
#