
Hello everyone, I have a question about computing statistics on a MACD histogram. It would be great if I could learn how to compute the following:
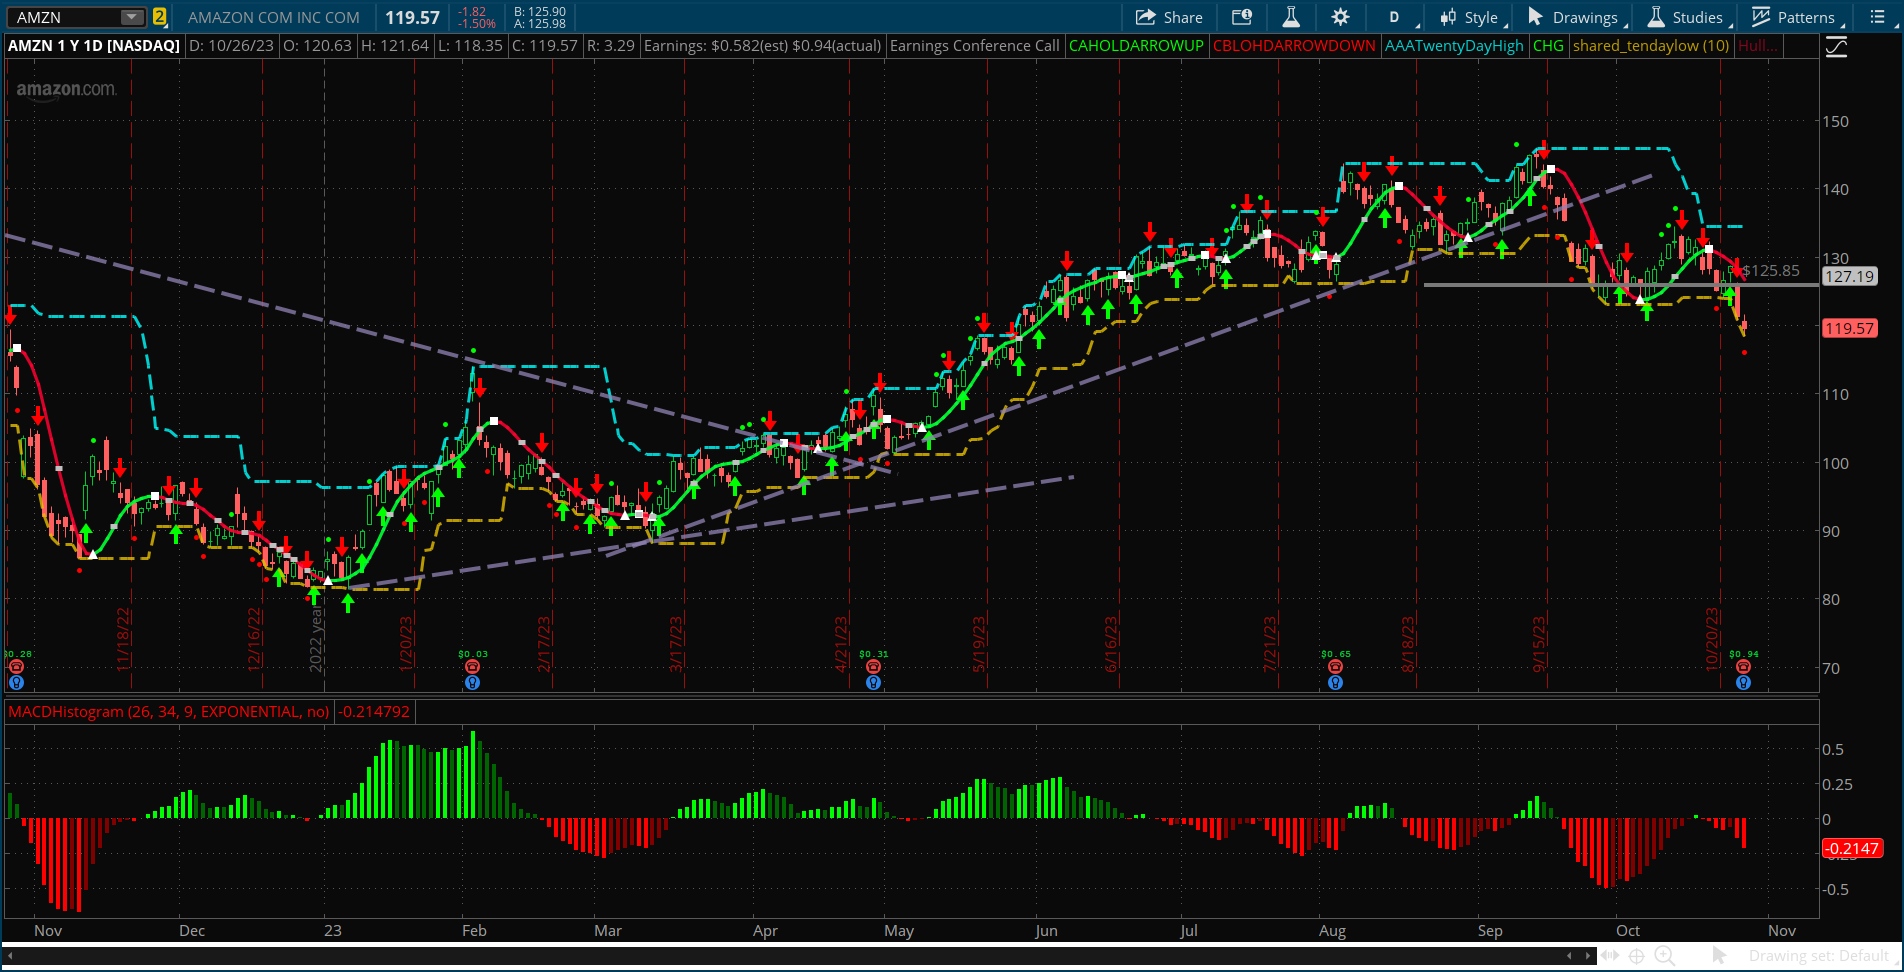
1) Count only the bars that have crossed the zero axis from negative to positive (dark red to green) starting with the second green bar and counting until the first dark green bar. Ignore any green bars thereafter until the momentum crosses from negative to positive value.
2) Compute this count for every time the momentum crosses from negative to positive on the chart.
3) Compute the stats:
a) maximum number of bars counted i.e. if there were 5 crossings find the one with the highest number of green bars (will be put in a label on the chart)
b) The average number of green bars from all groups of bars counted (will also be placed in a label on the chart)
Here is my chart:
and here is the ThinkScript I have been working on but I am not getting the correct numbers. I am completely confused with how to get the counts for the bars. I am trying to use the fold function to test back at least 15 bars for the constraints but it doesn't seem to work to the correct solution.
bn =BarNumber();
def risehistcnt = fold p = 0 to 15
with q = 0
while momentum[1] < momentum
do if bn == 1 then 0 else if momentum[2] < 0 and momentum > 0 then risehistcnt[1] + 1 else risehistcnt[1];
Thank you
Still working for a solution here is a screenshot of what I have so far:
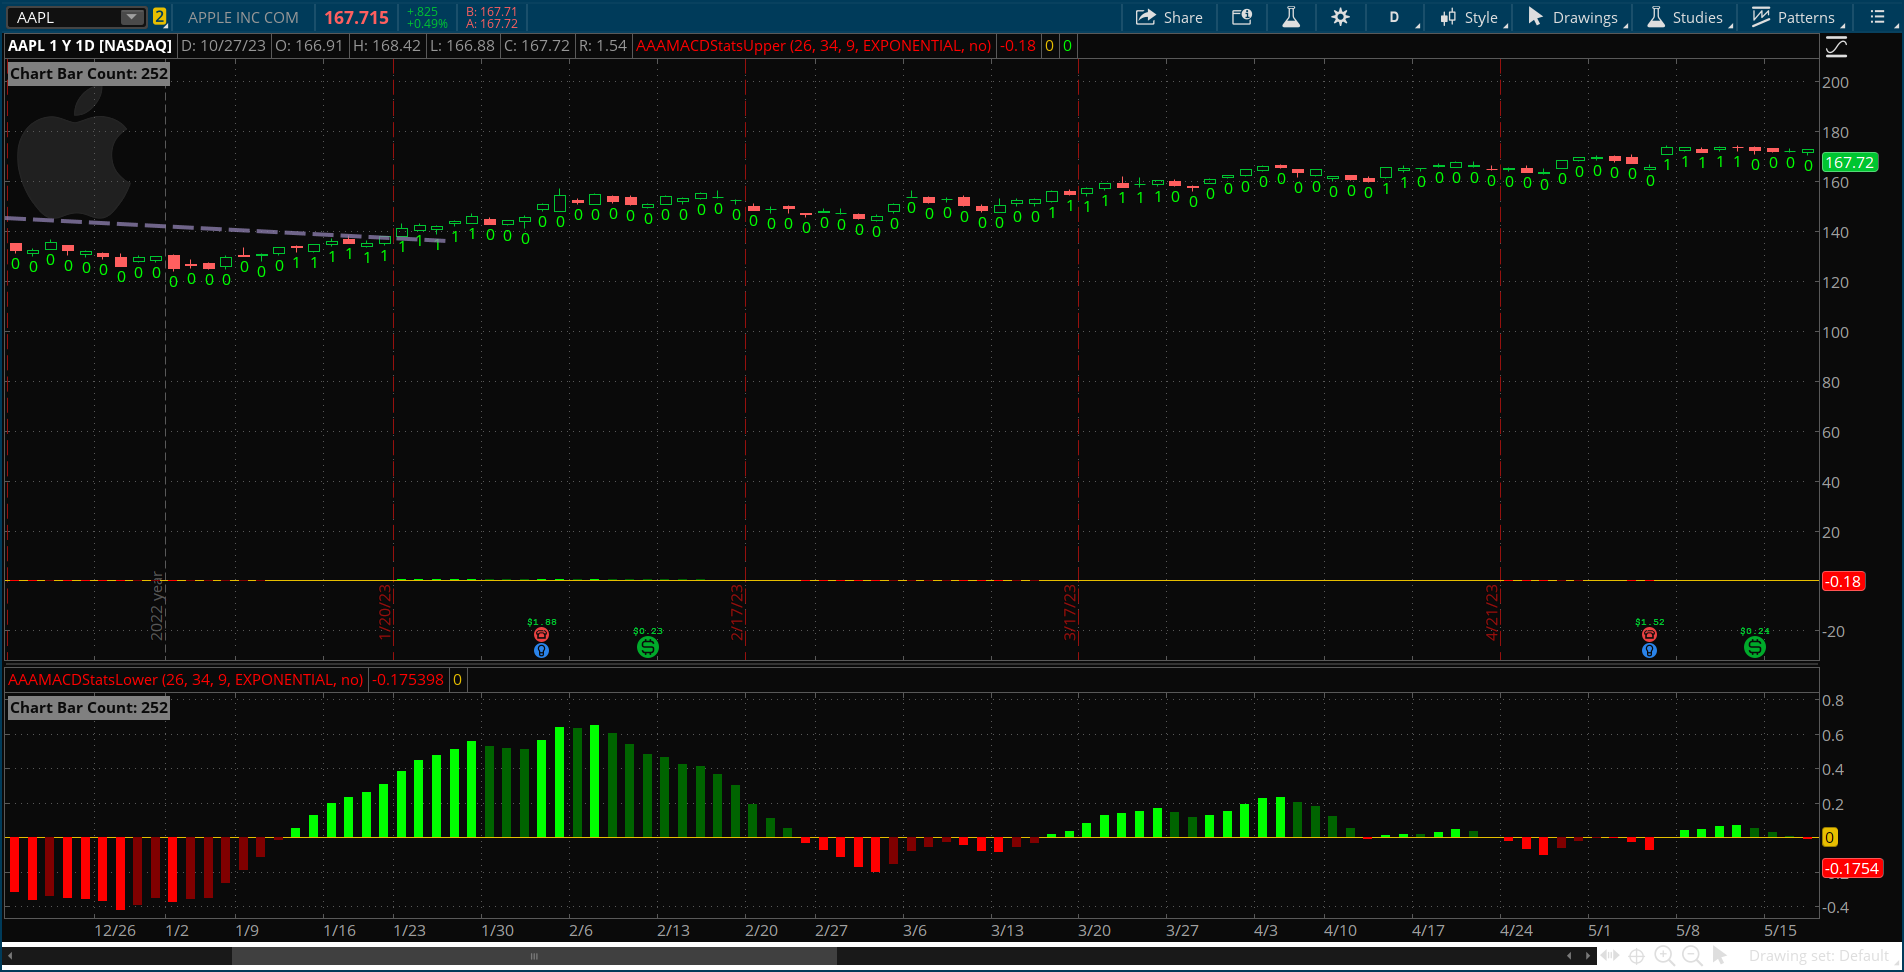
Sorry for the short snippet of code previously here is what I am working with (complete code), not quite there. The 1's are identifying the proper bars but having trouble in that I think it should be counting the bars.
# Stat MACD
declare upper;
input fastlength = 26;
input slowlength = 34;
input MACDLength = 9;
input averageType = AverageType.EXPONENTIAL;
input showBreakoutSignals = no;
plot Value = MovingAverage(averageType, close, fastLength) - MovingAverage(averageType, close, slowLength);
plot Avg = MovingAverage(averageType, Value, MACDLength);
plot Diff = Value - Avg;
plot ZeroLine = 0;
plot UpSignal = if Diff crosses above ZeroLine then ZeroLine else Double.NaN;
plot DownSignal = if Diff crosses below ZeroLine then ZeroLine else Double.NaN;
UpSignal.SetHiding(!showBreakoutSignals);
DownSignal.SetHiding(!showBreakoutSignals);
Value.SetDeFaultColor(GetColor(1));
Avg.SetDeFaultColor(GetColor(8));
Diff.SetDeFaultColor(GetColor(5));
Diff.SetPaintingStrategy(PaintingStrategy.HISTOGRAM);
Diff.SetLineWeight(3);
Diff.DefineColor("Positive and Up", Color.GREEN);
Diff.DefineColor("Positive and Down", Color.DARK_GREEN);
Diff.DefineColor("Negative and Down", Color.RED);
Diff.DefineColor("Negative and Up", Color.DARK_RED);
Diff.AssignValueColor(if Diff >= 0 then if Diff > Diff[1] then Diff.color("Positive and Up") else Diff.color("Positive and Down") else if Diff < Diff[1] then Diff.color("Negative and Down") else Diff.color("Negative and Up"));
UpSignal.SetDefaultColor(Color.UPTICK);
UpSignal.SetPaintingStrategy(PaintingStrategy.ARROW_UP);
DownSignal.SetDefaultColor(Color.DOWNTICK);
DownSignal.SetPaintingStrategy(PaintingStrategy.ARROW_DOWN);
def pos = Diff > 0;
def neg = Diff < 0;
def up = Diff[1] < Diff;
def dn = Diff[1] > Diff;
# initialize bar number computation (counts the number of bars on the chart)
def bn = BarNumber();
# Compute number of bars that are showing on a chart (shows how many bars are on the chart)
def barcnt = HighestAll(if IsNaN(close) then 0 else bn);
AddLabel(1, "Chart Bar Count: " + barcnt, Color.GRAY);
#####################################
########## WORKING ON CODE ##########
#####################################
# Compute the number of green hist bars after momentum crosses into positive and the first down bar
#def risehistcnt = fold p = 0 to 15
#with q = 0
#while dn != 1
#do if bn == 1 then 0 else if pos[1] == 0 and pos == 1 then risehistcnt[1] + 1 else risehistcnt[1];
def risehistcnt = fold p = 0 to 15
with q = 0
while dn != 1
do if pos[1] != 1 and pos == 1 then risehistcnt[1] + 1 else risehistcnt[1];
####################################
####################################
# Debugging plots
plot risehistcntplot = risehistcnt;
risehistcntplot.SetPaintingStrategy(PaintingStrategy.VALUES_BELOW);
risehistcntplot.SetDefaultColor(Color.GREEN);
1) Count only the bars that have crossed the zero axis from negative to positive (dark red to green) starting with the second green bar and counting until the first dark green bar. Ignore any green bars thereafter until the momentum crosses from negative to positive value.
2) Compute this count for every time the momentum crosses from negative to positive on the chart.
3) Compute the stats:
a) maximum number of bars counted i.e. if there were 5 crossings find the one with the highest number of green bars (will be put in a label on the chart)
b) The average number of green bars from all groups of bars counted (will also be placed in a label on the chart)
Here is my chart:
and here is the ThinkScript I have been working on but I am not getting the correct numbers. I am completely confused with how to get the counts for the bars. I am trying to use the fold function to test back at least 15 bars for the constraints but it doesn't seem to work to the correct solution.
bn =BarNumber();
def risehistcnt = fold p = 0 to 15
with q = 0
while momentum[1] < momentum
do if bn == 1 then 0 else if momentum[2] < 0 and momentum > 0 then risehistcnt[1] + 1 else risehistcnt[1];
Thank you
Still working for a solution here is a screenshot of what I have so far:
Sorry for the short snippet of code previously here is what I am working with (complete code), not quite there. The 1's are identifying the proper bars but having trouble in that I think it should be counting the bars.
# Stat MACD
declare upper;
input fastlength = 26;
input slowlength = 34;
input MACDLength = 9;
input averageType = AverageType.EXPONENTIAL;
input showBreakoutSignals = no;
plot Value = MovingAverage(averageType, close, fastLength) - MovingAverage(averageType, close, slowLength);
plot Avg = MovingAverage(averageType, Value, MACDLength);
plot Diff = Value - Avg;
plot ZeroLine = 0;
plot UpSignal = if Diff crosses above ZeroLine then ZeroLine else Double.NaN;
plot DownSignal = if Diff crosses below ZeroLine then ZeroLine else Double.NaN;
UpSignal.SetHiding(!showBreakoutSignals);
DownSignal.SetHiding(!showBreakoutSignals);
Value.SetDeFaultColor(GetColor(1));
Avg.SetDeFaultColor(GetColor(8));
Diff.SetDeFaultColor(GetColor(5));
Diff.SetPaintingStrategy(PaintingStrategy.HISTOGRAM);
Diff.SetLineWeight(3);
Diff.DefineColor("Positive and Up", Color.GREEN);
Diff.DefineColor("Positive and Down", Color.DARK_GREEN);
Diff.DefineColor("Negative and Down", Color.RED);
Diff.DefineColor("Negative and Up", Color.DARK_RED);
Diff.AssignValueColor(if Diff >= 0 then if Diff > Diff[1] then Diff.color("Positive and Up") else Diff.color("Positive and Down") else if Diff < Diff[1] then Diff.color("Negative and Down") else Diff.color("Negative and Up"));
UpSignal.SetDefaultColor(Color.UPTICK);
UpSignal.SetPaintingStrategy(PaintingStrategy.ARROW_UP);
DownSignal.SetDefaultColor(Color.DOWNTICK);
DownSignal.SetPaintingStrategy(PaintingStrategy.ARROW_DOWN);
def pos = Diff > 0;
def neg = Diff < 0;
def up = Diff[1] < Diff;
def dn = Diff[1] > Diff;
# initialize bar number computation (counts the number of bars on the chart)
def bn = BarNumber();
# Compute number of bars that are showing on a chart (shows how many bars are on the chart)
def barcnt = HighestAll(if IsNaN(close) then 0 else bn);
AddLabel(1, "Chart Bar Count: " + barcnt, Color.GRAY);
#####################################
########## WORKING ON CODE ##########
#####################################
# Compute the number of green hist bars after momentum crosses into positive and the first down bar
#def risehistcnt = fold p = 0 to 15
#with q = 0
#while dn != 1
#do if bn == 1 then 0 else if pos[1] == 0 and pos == 1 then risehistcnt[1] + 1 else risehistcnt[1];
def risehistcnt = fold p = 0 to 15
with q = 0
while dn != 1
do if pos[1] != 1 and pos == 1 then risehistcnt[1] + 1 else risehistcnt[1];
####################################
####################################
# Debugging plots
plot risehistcntplot = risehistcnt;
risehistcntplot.SetPaintingStrategy(PaintingStrategy.VALUES_BELOW);
risehistcntplot.SetDefaultColor(Color.GREEN);
Last edited: