MACD and Squeeze Indicator For ThinkOrSwim
I've been playing around with MACD settings. I found good results with these settings so I like to contribute. I use this MACD script that I found here in this forum, these are the setting I use.
Update time and code 11/24/21. If you guys like to share better settings please share, Thank you!
2 minute chart setting 12-26-9
5 minute chart setting 12-26-9
15 minute chart setting 8-17-9
1 hour chat setting 8-17-9
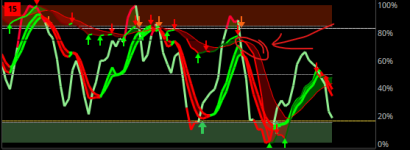
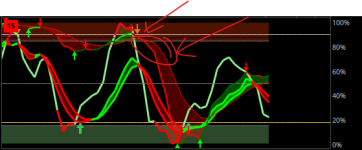
I watch 4 charts for directions to go call or puts, once MACD above zero for calls and below for puts . I moded zero line in this script so when pmain pass zero the zero line will be green and red if pmain is below zero. Hope this helps you and others.
Line repaints depend on stock movement, but overall I like it. Arrows you see is delayed, it would be nice if it wasn't. But you kind of get the idea as pmain change color to let you know if strength is weak or strong. I use DMI, adx, and RSI labels to see overall strength.
Just updated the code for color candles. Gets candles color thru histogram. You can turn off and on the candle colors in setting. Hope you guys find this helpful.
Green=Strong Up
Dark Green = Positive but down
Red = Stong down
Dark Red= negative but up
Few Mods to the code updated. Moded macd line for simple green and red. Added Macd zero label (Over zero "Green", Under zero "RED") and Macd label ( macd cross up "Green", macd cross down " RED")
Macd lines are uptick color below zero and Green above zero, downtick above zero and RED below zero.
Happy Thanks Giving in advance
I've been playing around with MACD settings. I found good results with these settings so I like to contribute. I use this MACD script that I found here in this forum, these are the setting I use.
Update time and code 11/24/21. If you guys like to share better settings please share, Thank you!
2 minute chart setting 12-26-9
5 minute chart setting 12-26-9
15 minute chart setting 8-17-9
1 hour chat setting 8-17-9
I watch 4 charts for directions to go call or puts, once MACD above zero for calls and below for puts . I moded zero line in this script so when pmain pass zero the zero line will be green and red if pmain is below zero. Hope this helps you and others.
Code:
#converted from mobisu macd to ppo
# this is actually macd and sqz indicator in one
# added pivots

#converted from mobisu macd to ppo
# this is actually macd and sqz indicator in one
# added pivots

declare lower;

input fastPeriod   = 12; #9/18/6 for 5m
input slowPeriod   = 26;
input signalPeriod = 9;
input price        = close;
input show = yes;
input agg1 = AggregationPeriod.FIVE_MIN;

def fastEma   = ExpAverage( price, fastPeriod );
def slowEma   = ExpAverage( price, slowPeriod );
def periodOK  = fastPeriod < slowPeriod;
AddLabel( !periodOK, "ERROR: fastPeriod MUST be less than slowPeriod" );
def _ppo      = if periodOK then ((fastEma - slowEma) / slowEma) * 100 else 0;
def _signal   = ExpAverage( _ppo, signalPeriod );

# generic plots wiht colors
plot pmain   = _ppo;
pmain.SetDefaultColor( Color.BLUE );
pmain.SetLineWeight(2);
pmain.AssignValueColor(if pmain < 0 and pmain < pmain[1]  then Color.RED else if  pmain < 0 and  pmain > pmain[1] then Color.Uptick else if pmain > 0 and pmain > pmain[1] then Color.green else Color.Downtick);
pmain.HideBubble();

plot mainEma   = _signal;
mainEma.SetDefaultColor( Color.MAGENTA );
mainEma.HideBubble();
MainEMA.AssignValueColor(if MainEMA < 0 and MainEMA < MainEMA[1] then Color.RED else if MainEMA < 0 and  MainEMA > MainEMA[1] then Color.Uptick else if MainEMA > 0 and MainEMA > MainEMA[1] then Color.GREEN else Color.DownTIck);

AddCloud(pmain, mainEma, Color.GREEN, Color.RED);

#diff as histogram
plot diff    = _ppo - _signal;
diff.SetDefaultColor(GetColor(5));
diff.SetPaintingStrategy(PaintingStrategy.HISTOGRAM);
diff.SetLineWeight(3);
diff.DefineColor("Positive and Up", Color.GREEN);
diff.DefineColor("Positive and Down", Color.DARK_GREEN);
diff.DefineColor("Negative and Down", Color.RED);
diff.DefineColor("Negative and Up", Color.DARK_RED);
diff.AssignValueColor(if diff >= 0 then if diff > diff[1] then diff.Color("Positive and Up") else diff.Color("Positive and Down") else if diff < diff[1] then diff.Color("Negative and Down") else diff.Color("Negative and Up"));

#mobius divergence calc
def pmainh = CompoundValue(1,
            if pmain < 0 then Double.NaN
            else if pmain crosses above 0  then pmain
            else if pmain > 0 and  pmain > pmainh[1]
            then pmain else pmainh[1], 0);

def Valueh = CompoundValue(1,
             if pmain < 0 then Double.NaN
             else if pmain crosses above 0  then high
             else if pmain > 0 and high > Valueh[1] then high
             else Valueh[1], 0);

plot divLowSignal = if pmain > 0 and  high > Valueh[1] and pmain < pmainh[1] then 0
                 else Double.NaN;
divLowSignal.SetPaintingStrategy(PaintingStrategy.SQUARES);
divLowSignal.SetLineWeight(5);
divLowSignal.SetDefaultColor(Color.DARK_ORANGE);

def pmainL = CompoundValue(1, if pmain > 0 then Double.NaN
                             else if pmain crosses below 0  then pmain
                             else if pmain < 0 and pmain < pmainL[1] then pmain
                             else pmainL[1], 0);

def ValueL = CompoundValue(1, if pmain > 0  then Double.NaN
                              else if pmain crosses below 0 then low
                              else if pmain < 0 and low < ValueL[1] then low
                              else ValueL[1], 0);

plot divUpSignall = if pmain < 0 and   low < ValueL[1] and pmain > pmainL[1] then 0
                 else Double.NaN;
divUpSignall.SetPaintingStrategy(PaintingStrategy.SQUARES);
divUpSignall.SetLineWeight(5);
divUpSignall.SetDefaultColor(Color.BLUE);

#zeroline

plot zero = 0;
zero.AssignValueColor(if Mainema < 0 then Color.RED else Color.GREEN);
zero.SetLineWeight(1);


#pivots

def ptrend = pmain;
def prange = 2;
def pivotHigh = if IsNaN(ptrend[-1]) then 0  else Lowest(ptrend, prange)[1] > ptrend and Lowest(ptrend, prange)[-prange] > ptrend ;
def pivotLow =  if  IsNaN(ptrend[-1]) then 0  else Highest(ptrend, prange)[1] < ptrend and Highest(ptrend, prange)[-prange] < ptrend ;
#study
plot plotPH = if pivotHigh and show then ptrend else Double.NaN;
plotPH.SetPaintingStrategy(PaintingStrategy.ARROW_UP);
plotPH.SetDefaultColor(Color.GREEN);

plot phline = if pivotHigh then pmain else Double.NaN;
phline.SetDefaultColor(Color.DARK_GREEN);
phline.EnableApproximation();
phline.Hide();
#
plot plotPL = if pivotLow and show then ptrend else Double.NaN;
plotPL.SetPaintingStrategy(PaintingStrategy.ARROW_DOWN);
plotPL.SetDefaultColor(Color.RED);

plot plline = if pivotLow then pmain else Double.NaN;
plline.SetDefaultColor(Color.RED);
plline.EnableApproximation();
plline.Hide();

input ShowMarketForecastLabel = yes;        #hint ShowMarketForecastLabel: Show the intermediate Market Forecast label
input ShowMACDBBLabel = yes;                #hint ShowMACDBBLabel: Show the MACDBB based Trend label
input ShowMACDBBCloud = no;                 #hint ShowMACDBBCloud: Show the MACDBB cloud shaded between BB
input ShowRSMCloud = no;                    #hint ShowRSMCloud: Show the vertical cloud based on RSM
input ShowHMALabel = yes;                   #hint ShowHMALabel: Show HUll Moving Average based Divergence label
input ShowSTOCHSCALPERSqueezeLabel = yes;   #hint ShowSTOCHSCALPERSqueezeLabel: Show Stochastic Scalper based squeeze label
input ShowSTOCHSCALPERSqueezeCloud = yes;   #hint ShowSTOCHSCALPERSqueezeCloud: Show Stochastic Scalper based squeeze cloud between BB
input ShowBullBearVerticalLines = yes;      #hint ShowBullBearVerticalLines: Show vertical lines for bullish or bearish direction


### Market Forecast

def pIntermediate = MarketForecast().Intermediate;

AddLabel(ShowMarketForecastLabel,
    "M/F " +
    if pIntermediate >= 80 then "Bullish" else
    if pIntermediate <= 20 then "Bearish" else
    if pIntermediate > pIntermediate[1] then "Rising" else
    if pIntermediate < pIntermediate[1] then "Falling" else "Neutral",
    if pIntermediate >= 80 then Color.DARK_GREEN else
    if pIntermediate <= 20 then Color.DARK_RED else
    if pIntermediate > pIntermediate[1] then Color.GREEN else
    if pIntermediate < pIntermediate[1] then Color.RED else Color.GRAY
);

AddLabel(ShowMACDBBLabel,
    "Trend " +
        if pmain > mainEma[1] and pmain > mainEma then "Bullish"
    else if pmain < mainEma[1] and pmain > mainEma then "Bullish (reversing)"
    else if pmain < mainEma[1] and pmain < mainEma then "Bearish"
    else if pmain > mainEma[1] and pmain < mainEma[1] then "Bearish (reversing)"
    else "Neutral",
    if pmain > mainEma[1] and pmain > mainEma then Color.GREEN
    else if pmain < mainEma[1] and pmain > mainEma then Color.DARK_GREEN
    else if pmain < pmain[1] and pmain < mainEma then Color.RED
    else if pmain > pmain[1] and pmain < mainEma then Color.DARK_RED
    else Color.GRAY
);

### Divergance
input HMA_Length = 55;
input HMA_Lookback = 2;

def HMA = HullMovingAvg(price = HL2, length = HMA_Length);
def HMA_delta = HMA[1] - HMA[HMA_Lookback + 1];
def HMA_delta_per_bar = HMA_delta / HMA_Lookback;
def HMA_next_bar = HMA[1] + HMA_delta_per_bar;
def HMA_concavity = if HMA > HMA_next_bar then 1 else -1;
def HMA_MA_Max = if HMA[-1] < HMA and HMA > HMA[1] then HMA else Double.NaN;
def HMA_MA_Min = if HMA[-1] > HMA and HMA < HMA[1] then HMA else Double.NaN;
def HMA_divergence = HMA - HMA_next_bar;

AddLabel(ShowHMALabel,
        "Div " +
        if HMA_concavity < 0 then
            if HMA_divergence[1] > HMA_divergence then "Bearish"
            else "Bearish (reversing)"
        else
            if HMA_divergence[1] < HMA_divergence then "Bullish"
            else "Bullish (reversing)",
        if HMA_concavity < 0 then
            if HMA_divergence[1] > HMA_divergence then Color.RED
            else Color.DARK_RED
        else
            if HMA_divergence[1] < HMA_divergence then Color.GREEN
            else Color.DARK_GREEN
);

### Stocastic Scalper

def STOCHSCALPER_oSS = (open[1] + close[1]) / 2;
def STOCHSCALPER_hSS = Max(high, close[1]);
def STOCHSCALPER_lSS = Min(low, close[1]);
def STOCHSCALPER_cSS = (STOCHSCALPER_oSS + STOCHSCALPER_hSS + STOCHSCALPER_lSS + close) / 4;

def STOCHSCALPER_mean = Average(STOCHSCALPER_cSS, 20);
def STOCHSCALPER_sd = StDev(STOCHSCALPER_cSS, 20);
def STOCHSCALPER_atr = Average(TrueRange(STOCHSCALPER_cSS, STOCHSCALPER_hSS, STOCHSCALPER_lSS), 20);
def STOCHSCALPER_squeeze = if (STOCHSCALPER_mean + (2 * STOCHSCALPER_sd)) < (STOCHSCALPER_mean + (1.5 * STOCHSCALPER_atr)) then yes else no;
def STOCHSCALPER_squeeze_signal = !STOCHSCALPER_squeeze[1] and STOCHSCALPER_squeeze;


AddLabel(ShowSTOCHSCALPERSqueezeLabel, "Squeeze", if STOCHSCALPER_squeeze then Color.MAGENTA else Color.DARK_GRAY);

### RSI IFT

def RSI_IFT_R = reference RSI(5, close) - 50;
def RSI_IFT_AvgRSI = MovingAverage(AverageType.EXPONENTIAL, RSI_IFT_R, 9);
def RSI_IFT_InverseRSI = (Power(Double.E, 2 * RSI_IFT_AvgRSI) - 1) / (Power(Double.E, 2 * RSI_IFT_AvgRSI) + 1);
def RSI_IFT_Direction = if BarNumber() == 0 then 0
                        else if (RSI_IFT_InverseRSI[1] > 0) and (RSI_IFT_InverseRSI < 0) then -1
                        else if (RSI_IFT_InverseRSI > 0) and (RSI_IFT_InverseRSI[1] < 0) then 1
                        else RSI_IFT_Direction[1];

### Fibonacci SuperTrend

input FST_Length = 11;
input FST_Retrace = 23.6;
input FST_UseHighLow = yes;

def FST_h = if FST_UseHighLow then high else close;
def FST_l = if FST_UseHighLow then low else close;
def FST_minL = Lowest(FST_l, FST_Length);
def FST_maxH = Highest(FST_h, FST_Length);

def FST_hh = if FST_h > FST_maxH[1] then FST_h else FST_hh[1];
def FST_ll = if FST_l < FST_minL[1] then FST_l else FST_ll[1];
def FST_trend = if FST_h > FST_maxH[1] then 1 else if FST_l < FST_minL[1] then -1 else FST_trend[1];
def FST_Direction = if BarNumber() == 0 then 0
                    else if FST_trend != 1 then -1
                    else if FST_trend == 1 then 1
                    else FST_Direction[1];
# ########################################################
input paintbars = yes;
assignPriceColor (if !PaintBars then Color.CURRENT else if Diff >= 0 then if Diff > Diff[1] then Diff.color("Positive and Up") else Diff.color("Positive and Down") else if Diff < Diff[1] then Diff.color("Negative and Down") else Diff.color("Negative and Up"));

AddLabel(yes, if Pmain > 0 then "Zero" else "Zero", if Pmain > 0 then Color.GREEN else Color.RED);

AddLabel(yes, if Pmain > MainEma then "MACD" else "MACD", if Pmain > MainEma then Color.GREEN else Color.RED);

def bull_cross = pmain crosses above zero;
def bear_cross = pmain crosses below zero;

# Alerts
Alert(bull_cross, "UP arrow alert", Alert.BAR, Sound.Chimes);
Alert(bear_cross, "DOWN arrow alert", Alert.BAR, Sound.Ring);
Line repaints depend on stock movement, but overall I like it. Arrows you see is delayed, it would be nice if it wasn't. But you kind of get the idea as pmain change color to let you know if strength is weak or strong. I use DMI, adx, and RSI labels to see overall strength.
Just updated the code for color candles. Gets candles color thru histogram. You can turn off and on the candle colors in setting. Hope you guys find this helpful.
Green=Strong Up
Dark Green = Positive but down
Red = Stong down
Dark Red= negative but up
Few Mods to the code updated. Moded macd line for simple green and red. Added Macd zero label (Over zero "Green", Under zero "RED") and Macd label ( macd cross up "Green", macd cross down " RED")
Macd lines are uptick color below zero and Green above zero, downtick above zero and RED below zero.
Happy Thanks Giving in advance
I'm going to use 2 and 5 minutes with your dmi color script and will use macd color for 15 and 1 hour . Going to doing some testing this weekend.
Last edited by a moderator: