Author Message:
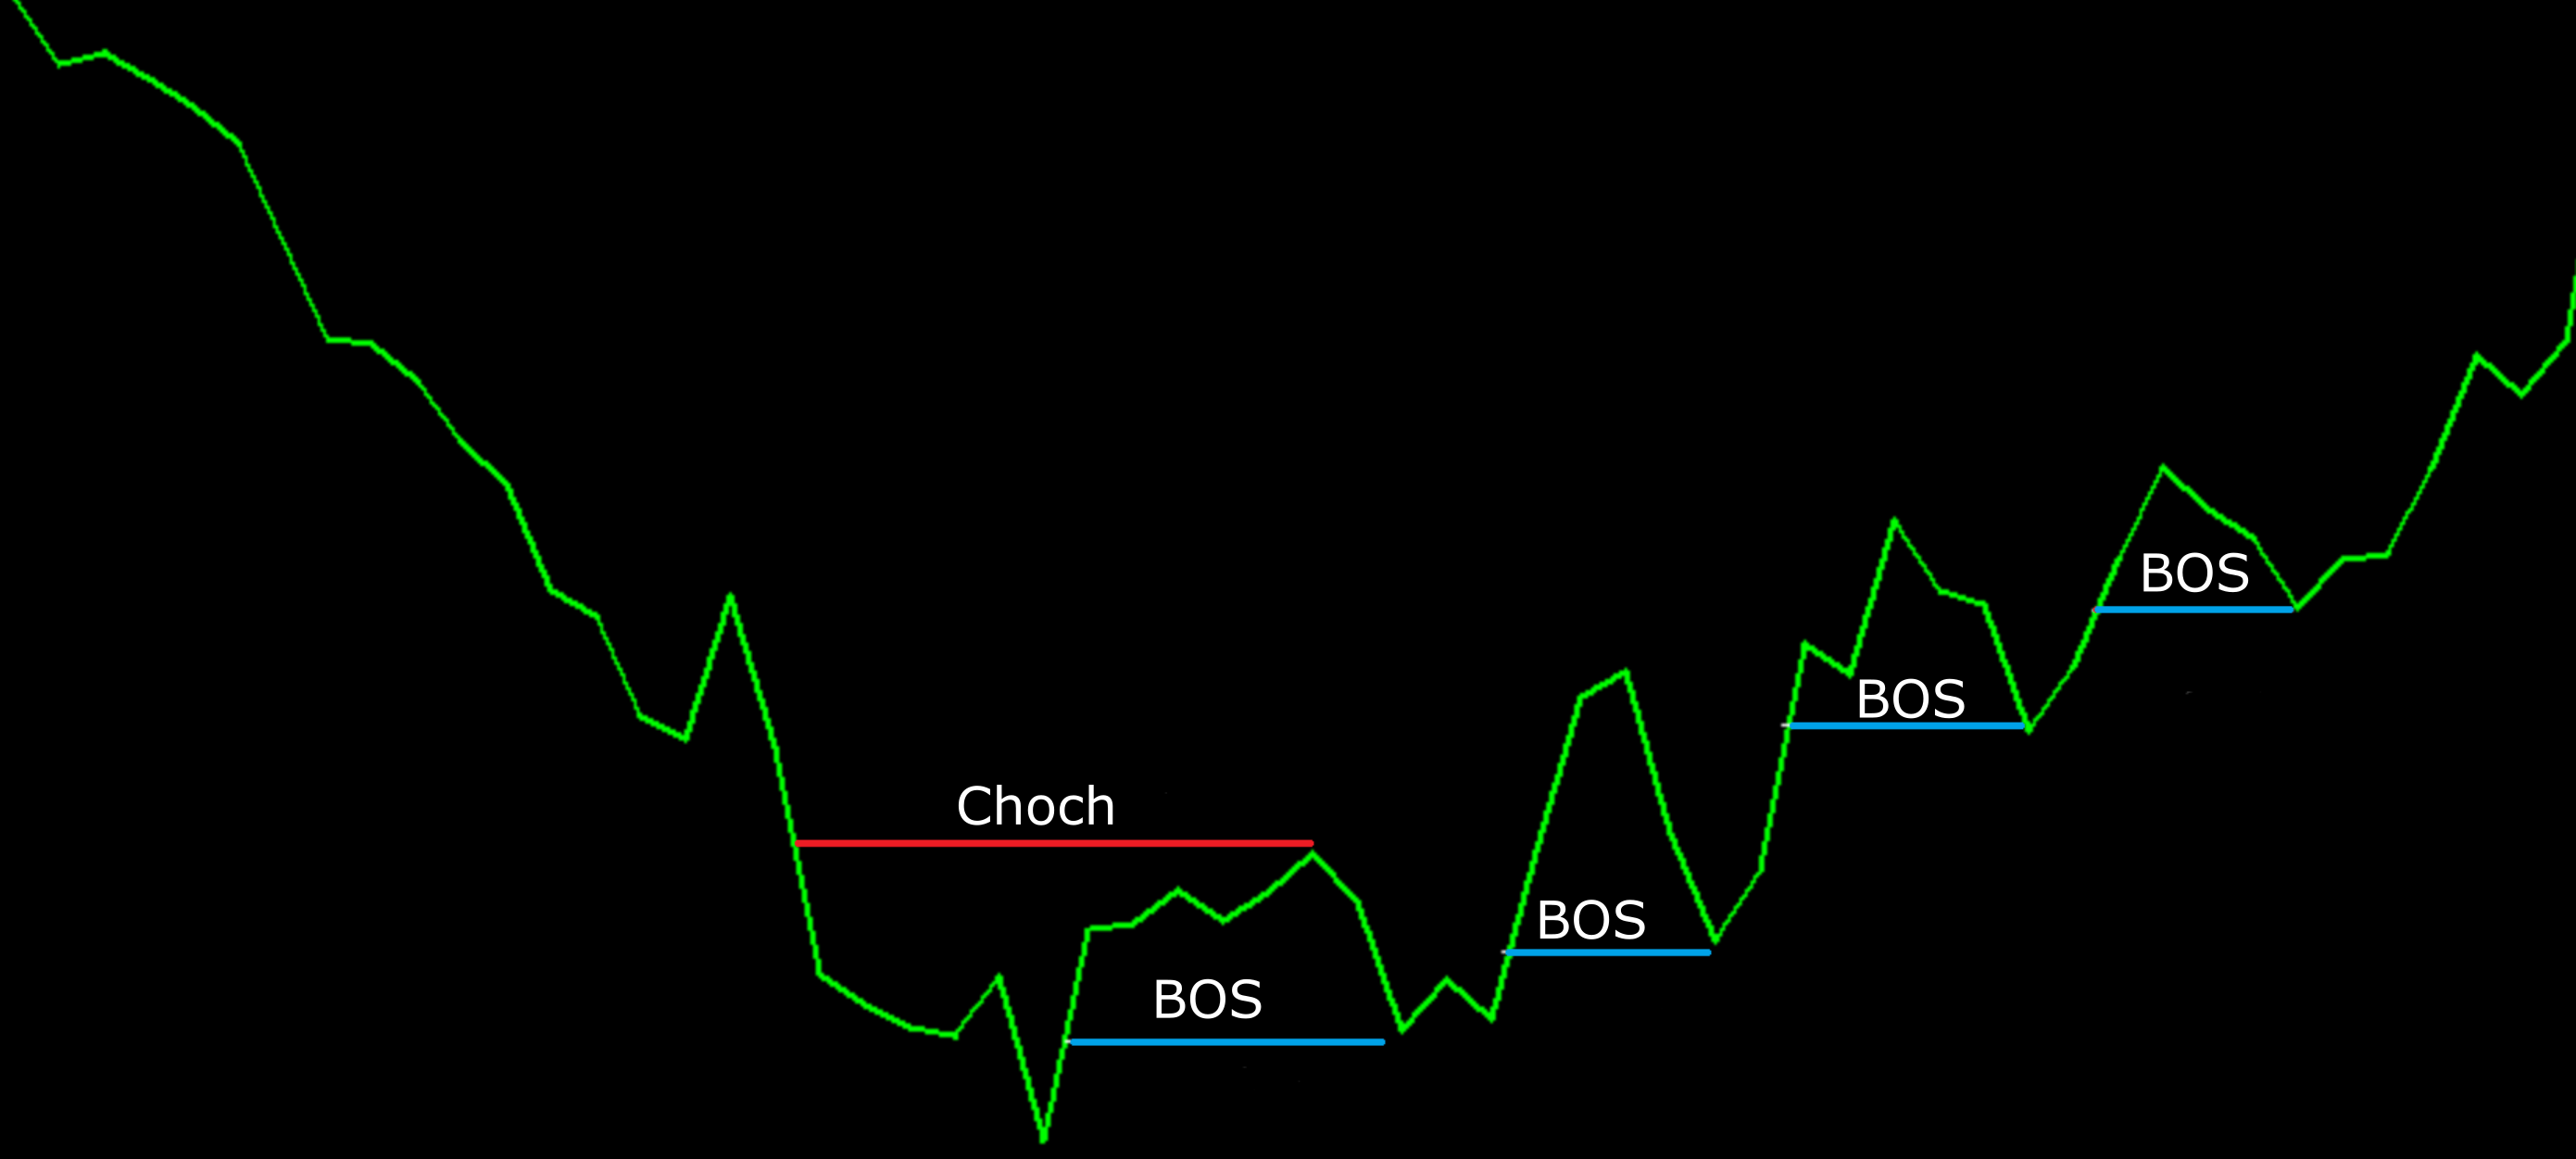
The Liquidity Hunter helps traders identify areas in the market where reversals may occur by analyzing candle formations and structures.
For more Details: https://www.tradingview.com/v/E9z8Isgd/
CODE:
CSS:
#//https://www.tradingview.com/v/E9z8Isgd/
#// This source code is subject to the terms of the Mozilla Public License 2.0
#// © ChartPrime
#indicator("Liquidity Hunter [ChartPrime]",shorttitle = "Liquidity Hunter [ChartPrime]"
# Converted and mod by Sam4Cok@Samer800    - 12/2023

input showInfoLabel = yes;
input colorLiquidityBars = yes;
input useFilter = no;
input filterLength = 14;
input showMarketCharacter = {Default "Lines & Labels", "Lines Only", "Labels Only", "Don't Show"};
input bodyPercentage = 30;    # "Body %" tooltip = "Body Value will be lower than this "
input WickPercentage = 60;    # "Wick %" tooltip = "Wick Value will be higher than this "
input ShowTargets = yes;      # "Show Targets"
input lostSize = 100;
input targetMulti   = 1.5;    # "Profit Target "
input stopLossMulti = 1.5;    # "SL Target "


def na = Double.NaN;
def bar = CompoundValue(1, AbsValue(BarNumber()), 1);
def last = !IsNaN(close);
def bar_index = if last then bar else bar_index[1];
def SMCLine;
def SMCLabel;
Switch (showMarketCharacter) {
Case "Lines Only" :
    SMCLine  = yes;
    SMCLabel = no;
Case "Labels Only" :
    SMCLine  = no;
    SMCLabel = yes;
Case "Don't Show" :
    SMCLine  = no;
    SMCLabel = no;
Default :
    SMCLine  = yes;
    SMCLabel = yes;
}
Script FindPivots {
    input dat = close; # default data or study being evaluated
    input HL  = 0;    # default high or low pivot designation, -1 low, +1 high
    input lbL  = 5;    # default Pivot Lookback Left
    input lbR  = 1;    # default Pivot Lookback Right
    ##############
    def _nan;    # used for non-number returns
    def _BN;     # the current barnumber
    def _VStop;  # confirms that the lookforward period continues the pivot trend
    def _V;      # the Value at the actual pivot point
    def _pivotRange;
    ##############
    _BN  = BarNumber();
    _nan = Double.NaN;
    _pivotRange = lbL + lbL;
    _VStop = if !isNaN(dat[_pivotRange]) and lbr > 0 and lbl > 0 then
                fold a = 1 to lbR + 1 with b=1 while b do
                    if HL > 0 then dat > GetValue(dat,-a) else dat < GetValue(dat,-a) else _nan;
   if (HL > 0) {
        _V = if _BN > lbL and dat == Highest(dat, lbL+1) and _VStop
            then dat else _nan;
    } else {
        _V = if _BN > lbL and dat == Lowest(dat, lbL+1) and _VStop
            then dat else _nan;
    }
    plot result = if !IsNaN(_V) and _VStop then _V else _nan;
}
Script get_counts {
input condition = no;
input top = high;
input btm = low;
    def count;# = 0
    if condition {
        count = 0;
    } else {
        count = count[1] + (if low < top and high > btm then 1 else 0);
    }
    plot cnt = count;
}
Script _Band {
    input len = 5;
    def nATR = ATR(LENGTH = len);
    def Band = Min(nATR * 0.3, close * (0.3 / 100));
    plot _Band = Band[20] / 2;
}
def _Band = _Band(5);
def Zband = _Band(30);
def range = AbsValue(high[1] - low[1]);
def LowerWickRange = Min(open[1], close[1]) - low[1];
def BodyPer = AbsValue(open[1] - close[1]) / range * 100;
def WickPer = (LowerWickRange / range) * 100;

def t = bar_index;
def TIME = if t[5] > 0 then t[5] else 1;
def LTIME = if TIME[1] then TIME[1] else 1;
def Slope = (close[1] - close[2]) / (TIME - LTIME);
def CON = BodyPer <= bodyPercentage and WickPer >= WickPercentage and (Slope * t > 0) and _Band >= _Band[1];

def ph_top;
def ph_btm;
def phtop = if ph_top[1] then ph_top[1] else high + _Band;
def phbtm = if ph_btm[1] then ph_btm[1] else low  - _Band;
def pvtH =  findpivots(high, 1, filterLength, RoundUp(filterLength/2, 0));
def ph_count = get_counts(!isNaN(pvtH), phtop, phbtm);
    ph_top = if !isNaN(pvtH) then high + _Band else phtop;
    ph_btm = if !isNaN(pvtH) then low  - _Band else phbtm;

def filter = if useFilter then ph_count > 1 else yes;
def long = filter and CON;
def nATR = ATR(Length = 14);
def x2 = low - nATR * stopLossMulti;
def longDiffSL = AbsValue(close - x2);

def TradeisON;
def LongIndex;
def TP;
def CHOCH;
def SL;
def BOS;
def Message;
def top;
def bot;
def ChochisON;
def BOSisON;
def ChoIndex;
def ChoIndex1;
def CHOCHLab;
def Bosindex;
def Bosindex1;
def bosLab;
def entry;
if long and !TradeisON[1] {
    entry = ohlc4[-1];
    LongIndex = bar_index;
    TP = entry + (targetMulti * longDiffSL);
    SL = entry - longDiffSL;
    CHOCH = close + (targetMulti / 2 * longDiffSL);
    BOS = low  - (Zband * 15);
    top = high + (Zband * 0.5);
    bot = low - (Zband * 0.5);
    Message = Round(WickPer, 2);
    ChoIndex = 0;#ChoIndex[1];
    ChoIndex1 = 0;
    Bosindex = 0;
    Bosindex1 = 0;
    CHOCHLab = na;
    bosLab = na;
    TradeisON = yes;
    ChochisON = no;
    BOSisON = no;
} else
if TradeisON[1] {
    entry = entry[1];
    LongIndex = LongIndex[1];
    TP = TP[1];
    SL = SL[1];
    CHOCH = CHOCH[1];
    BOS = BOS[1];
    Message = no;
    top = top[1];
    bot = bot[1];
    if close >= CHOCH and !ChochisON[1] {
        ChoIndex = bar_index;
        ChoIndex1 = LongIndex;
        CHOCHLab = Floor((ChoIndex1 + ChoIndex) / 2);
        ChochisON = yes;
    } else {
        ChoIndex = 0;
        ChoIndex1 = 0;
        CHOCHLab = na;
        ChochisON = ChochisON[1];
    }
    if close <= BOS and !BOSisON[1] {
        Bosindex = bar_index;
        Bosindex1 = LongIndex;
        bosLab = Floor((Bosindex1 + Bosindex) / 2);
        BOSisON = yes;
    } else {
        Bosindex = 0;
        Bosindex1 = 0;
        bosLab = na;
        BOSisON = BOSisON[1];
    }
    TradeisON = if high >= TP then no else
                if close <= SL then no else TradeisON[1];
} else {
    entry = entry[1];
    LongIndex = LongIndex[1];
    TP = TP[1];
    SL = SL[1];
    CHOCH = CHOCH[1];
    BOS = BOS[1];
    Message = no;
    top = top[1];
    bot = bot[1];
    ChoIndex  = 0;#ChoIndex[1];
    ChoIndex1 = 0;#ChoIndex1[1];
    Bosindex  = 0;#Bosindex[1];
    Bosindex1 = 0;#Bosindex1[1];
    CHOCHLab  = na;
    bosLab    = na;
    TradeisON = if high >= TP then no else
                if close <= SL then no else TradeisON[1];
    ChochisON = if TradeisON then ChochisON[1] else no;
    BOSisON   = if TradeisON then BOSisON[1] else no;
}
def plotCond = (TradeisON or TradeisON[2]);
def choChCond = TradeisON and bar_index >= HighestAll(ChoIndex1) - 1 and bar_index <= HighestAll(ChoIndex);
def bosCond   = TradeisON and bar_index >= HighestAll(Bosindex1) - 1 and bar_index <= HighestAll(Bosindex);
def choChLabCond = bar_index == HighestAll(CHOCHLab);
def bosLabCond   = bar_index == HighestAll(bosLab);
def topLine =  if TradeisON and top then top else na;
def botLine =  if TradeisON and bot then bot else na;

plot TpLine = if ShowTargets and plotCond and TP then TP else na;
plot SlLine = if ShowTargets and plotCond and SL then SL else na;
plot chLine = if SMCLine and choChCond then CHOCH else na;
plot boLine = if SMCLine and bosCond then BOS else na;

chLine.SetStyle(Curve.SHORT_DASH);
chLine.SetDefaultColor(CreateColor(4,123,136));
boLine.SetStyle(Curve.SHORT_DASH);
boLine.SetDefaultColor(Color.DARK_RED);
TpLine.SetDefaultColor(CreateColor(78, 255, 43));
SlLine.SetDefaultColor(Color.MAGENTA);
TpLine.SetPaintingStrategy(PaintingStrategy.HORIZONTAL);
SlLine.SetPaintingStrategy(PaintingStrategy.HORIZONTAL);

plot wickPerc = if Message then Message else na;
wickPerc.SetDefaultColor(Color.YELLOW);
wickPerc.SetLineWeight(3);
wickPerc.SetPaintingStrategy(PaintingStrategy.VALUES_BELOW);

def endTrade = !TradeisON and TradeisON[1];
def win = high >= TP;
def los = close <= SL;

plot TradeEnd = if !ShowTargets then na else
                if endTrade[2] then
                if los[2] then SL[2] else TP[2] else na;
TradeEnd.SetLineWeight(2);
TradeEnd.AssignValueColor(if win[2] then Color.CYAN else Color.MAGENTA);
TradeEnd.SetPaintingStrategy(PaintingStrategy.SQUARES);

#-- Clouds / Bars/ Label
AddCloud(topLine, botLine, Color.DARK_GRAY, Color.DARK_GRAY, yes);

AddChartBubble(SMCLabel and choChLabCond, CHOCH + Zband, "CHoCH", Color.WHITE);
AddChartBubble(SMCLabel and bosLabCond,  BOS - Zband, "BOS", Color.WHITE, no);

AssignPriceColor( if colorLiquidityBars and TradeisON then Color.CYAN else Color.CURRENT);

# -- Info Label

def winCnt = if endTrade then if win then winCnt[1] + 1 else winCnt[1] else winCnt[1];
def losCnt = if endTrade then if los then losCnt[1] + 1 else losCnt[1] else losCnt[1];
def PlAmt = if endTrade then if win then PlAmt[1] + (TP - Entry) * lostSize else
                             if los then PlAmt[1] - (Entry - SL) * lostSize else PlAmt[1] else PlAmt[1];
def totTrade = winCnt + losCnt;
def winRate = winCnt / totTrade;#Round(winCnt / totTrade * 100, 2);
def PL = Round(PlAmt, 2);

AddLabel(showInfoLabel, "Trades("+ totTrade+ ")"  , Color.WHITE);
AddLabel(showInfoLabel, "P/L ($" + PL + ")", if PL > 0 then Color.GREEN else
                                            if PL < 0 then Color.RED else Color.GRAY);
AddLabel(showInfoLabel, "WinRate("+ AsPercent(winRate) + ")", if winRate > 0.50 then Color.GREEN else
                                                   if winRate < 50 then Color.RED else Color.GRAY);

#-- END of CODE