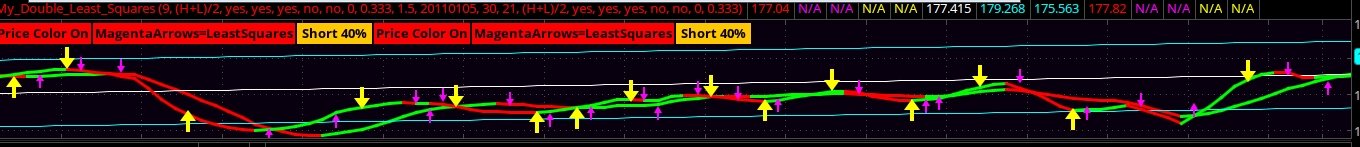
# Double Least Squares lower study
# Look for confirmation of agreeing colors.
# Horserider 6/5/2019

# LeastSquaresMethodForecast_R1V2
    #
    # http://finance.groups.yahoo.com/group/TOS_thinkscript/message/6671
    # R1V0   2010.12.24          TradeScripter
    #
    # R1V1   2010.12.26:06:22    ebtrader
    # R1V2   2010.12.27:08:00    KumoBob
    #        Added Price Color and Arrows
    #        Option to remove any plot
    #        Added Chart Labels
    #
# R1V3   2010.12.27:16:10    KumoBob
#        Added plot Today Only
#        Added Hints
# R2V1   2010.12.28:15:42 EBTrader
#        Added Regression Channel
#        Added Money Management
#        Added Bubble Option

# R2V2   2010.01.07: 16:06 KumoBob
#         Alternated Arrows

# R2V3   2010.01.11: 18:30 EBTrader
#         Made colors more consistent and added sell bubble


    #This program created by tradescripter
    #Dec. 24, 2010 Merry Christmas
    #It uses the Least-Squares Method to forecast a new price
    #For an explanation of Least-Squares method see:
    #http://en.wikiversity.org/wiki/Least-Squares_Method

#Hint PriceColorOn: Affect the color of the Price bars according to the signals of this indicator\n<b>Default is Yes
#Hint ArrowsOn: Plot Arrows at signal changes \n<b>Default is Yes
#Hint PredictionLineOn: Plot the indicator \n<b>Default is Yes
#Hint ShowTodayOnly: Plot only the most recent arrows in order not to clutter the Price history\nMakes it easier to see prior prices \n<b>Default is no
#Hint ShowExtraDays: Further adjustment to Show Only Today \n<b>Default is 0
#Hint space: Allows you to move the arrows, and avoid stepping on other arrows when multiple studies are shown \n<b>Default is 0.333
#Hint length: Touch this only if you are an expert! Just kidding. \n<b>Default is 9
#Hint price: For the experimenter \n<b>Default is HL2

declare lower;
AssignBackgroundColor(CreateColor(8, 0, 15));
input length = 9;
input price = HL2;
input PriceColorOn = Yes;
input ArrowsOn = Yes;
input PredictionLineOn = Yes;
input BubblesOn = No;
input ShowTodayOnly = no;
input ShowExtraDays = 0;
input space = 0.333;
def Today = if !ShowTodayOnly then 1 else if GetDay() + ShowExtraDays >= GetLastDay() then 1 else 0;

def AvgPrice = Average(price, length);
def SumTime = fold i = 1 to length + 1 with x = 0 do x + i;
def AvgTime = SumTime / length;
    #sx is the sum of all the deviations from time for the last x bars
def sx = fold j = 1 to length + 1 with y = 0 do y + ((j - AvgTime) * (GetValue(price, length - j, length + 1) - AvgPrice));
        #sy is the sum of all the deviations from price for the last x bars
def sy = fold k = 1 to length + 1 with z = 0 do z + (Power(k - AvgTime, 2));
        #m is the slope of the line, b is the slope intercept of the line in the equation y = mx + b
def m = sx / sy;
def b = AvgPrice - m * AvgTime;
def Prediction = (m * (length + 1)) + b;
plot FuturePrediction = if !PredictionLineOn then Double.NaN else Prediction;
FuturePrediction.AssignValueColor(if FuturePrediction > FuturePrediction[1] then Color.GREEN else Color.RED);
FuturePrediction.SetLineWeight(3);
FuturePrediction.HideBubble();


AssignPriceColor(if !PriceColorOn then Color.CURRENT else if Prediction > Prediction[1] then (CreateColor(000, 255, 255)) else if Prediction < Prediction[1] then (CreateColor(255, 160, 000)) else Color.GRAY);
AddLabel(PriceColorOn , "Price Color On", if Prediction > Prediction[1] then Color.GREEN else if Prediction < Prediction[1] then Color.RED else Color.GRAY);

AddLabel(ArrowsOn, "MagentaArrows=LeastSquares",  if Prediction > Prediction[1] then Color.GREEN else if Prediction < Prediction[1] then Color.RED else Color.GRAY);

def spaceman = Average(high - low) * space;
def xover = Crosses(Prediction, Prediction[1], CrossingDirection.ANY);
plot UpArrow = if Today && xover && Prediction > Prediction[1] then low - spaceman else Double.NaN;
UpArrow.SetPaintingStrategy(PaintingStrategy.ARROW_UP);
UpArrow.SetDefaultColor(Color.MAGENTA);
plot DnArrow = if Today && xover && Prediction < Prediction[1] then high + spaceman else Double.NaN;
DnArrow.SetPaintingStrategy(PaintingStrategy.ARROW_DOWN);
DnArrow.SetDefaultColor(Color.MAGENTA);

    #    plot firstup = crosses((Prediction > low), yes) && Prediction < Prediction[1];
    #    firstup.SetPaintingStrategy(PaintingStrategy.BOOLEAN_ARROW_UP);

    #    plot firstdown = crosses((Prediction < high), yes) && Prediction > Prediction[1];
    #    firstdown.SetPaintingStrategy(PaintingStrategy.BOOLEAN_ARROW_DOWN);

rec LastArrow = if low > Prediction && LastArrow[1] <> 1 && Prediction < Prediction[1] then 1 else
    if high < Prediction && LastArrow[1] <> -1 && Prediction > Prediction[1] then -1 else LastArrow[1];

plot firstup = if Today && LastArrow > 0 && LastArrow <> LastArrow[1]  then low else Double.NaN;
firstup.SetPaintingStrategy(PaintingStrategy.ARROW_UP);
firstup.SetLineWeight(5);
firstup.SetDefaultColor(Color.YELLOW);
plot firstdown = if Today && LastArrow < 0 && LastArrow <> LastArrow[1]  then high else Double.NaN;
firstdown.SetPaintingStrategy(PaintingStrategy.ARROW_DOWN);
firstdown.SetLineWeight(5);
firstdown.SetDefaultColor(Color.YELLOW);


#
# Linear Regression with Standard Deviation Channels
#
#  Written by Robert Hall
#   Released 10 April 2009
#
#
#  Standard Deviation can be input to 2 decimal places
#

input standardDeviation = 1.5;
input startDateYyyyMmDd = 20110105;
input startTime = 0030;


plot MiddleLR = InertiaAll(price, length, startDateYyyyMmDd, startTime, extendtoright = 1);

def dist = HighestAll(AbsValue(MiddleLR - price)) * standardDeviation / 2;

plot UpperLR = MiddleLR + dist;
plot LowerLR = MiddleLR - dist;

MiddleLR.SetDefaultColor(Color.WHITE);
MiddleLR.SetLineWeight(1);
MiddleLR.SetStyle(Curve.FIRM);

UpperLR.SetDefaultColor(Color.CYAN);
UpperLR.SetLineWeight(1);
UpperLR.SetStyle(Curve.FIRM);

LowerLR.SetDefaultColor(Color.CYAN);
LowerLR.SetLineWeight(1);
LowerLR.SetStyle(Curve.FIRM);

#    Money Management

# Longs

def exposure20pct = LastArrow < 0 && LastArrow <> LastArrow[1];

def exposure40pct = Prediction[3] > Prediction[4] && Prediction[2] > Prediction[3] && Prediction[1] > Prediction[2] && Prediction > Prediction[1] ;

def exposure60pct = Prediction[2] > Prediction[3] && Prediction[1] > Prediction[2] && Prediction > Prediction[1];

def exposure80pct = Prediction[1] > Prediction[2] && Prediction > Prediction[1];

def exposure100pct = xover && Prediction > Prediction[1];

# Shorts

def exposureneg20pct = LastArrow > 0 && LastArrow <> LastArrow[1];

def exposureneg40pct = Prediction[3] < Prediction[4] && Prediction[2] < Prediction[3] && Prediction[1] < Prediction[2] && Prediction < Prediction[1];

def exposureneg60pct = Prediction[2] < Prediction[3] && Prediction[1] < Prediction[2] && Prediction < Prediction[1];

def exposureneg80pct = Prediction[1] < Prediction[2] && Prediction < Prediction[1];

def exposureneg100pct = xover && Prediction < Prediction[1];


AddLabel(yes, Concat( "", Concat(" ",
if exposure20pct then "Long 20% " else
if exposure40pct then "Long 40% " else
if exposure60pct then "Long 60%" else
if exposure80pct then "Long 60%" else
if exposure100pct then "Long 100%" else

if exposureneg20pct then "Short 20% " else
if exposureneg40pct then "Short 40% " else
if exposureneg60pct then "Short 60%" else
if exposureneg80pct then "Short 60%" else
if exposureneg100pct then "Short 100%" else
"Go Flat")),

if exposure20pct then Color.CYAN else
if exposure40pct then  Color.CYAN else
if exposure60pct then  Color.CYAN else
if exposure80pct then Color.CYAN else
if exposure100pct then  Color.CYAN else
if exposureneg20pct then Color.ORANGE else
if exposureneg40pct then Color.ORANGE else
if exposureneg60pct then Color.ORANGE else
if exposureneg80pct then Color.ORANGE else
if exposureneg100pct then Color.ORANGE else
Color.WHITE);

AddChartBubble(BubblesOn && xover && Prediction > Prediction[1] , low, Concat("Buy Baby", HL2), Color.CYAN, yes);

AddChartBubble(BubblesOn && xover && Prediction < Prediction[1] , high, Concat("Sell That Bad Boy", HL2), Color.ORANGE, yes);

# ************************************************************


# LeastSquaresMethodForecast_R1V2
    #
    # http://finance.groups.yahoo.com/group/TOS_thinkscript/message/6671
    # R1V0   2010.12.24          TradeScripter
    #
    # R1V1   2010.12.26:06:22    ebtrader
    # R1V2   2010.12.27:08:00    KumoBob
    #        Added Price Color and Arrows
    #        Option to remove any plot
    #        Added Chart Labels
    #
# R1V3   2010.12.27:16:10    KumoBob
#        Added plot Today Only
#        Added Hints
# R2V1   2010.12.28:15:42 EBTrader
#        Added Regression Channel
#        Added Money Management
#        Added Bubble Option

# R2V2   2010.01.07: 16:06 KumoBob
#         Alternated Arrows

# R2V3   2010.01.11: 18:30 EBTrader
#         Made colors more consistent and added sell bubble


    #This program created by tradescripter
    #Dec. 24, 2010 Merry Christmas
    #It uses the Least-Squares Method to forecast a new price
    #For an explanation of Least-Squares method see:
    #http://en.wikiversity.org/wiki/Least-Squares_Method

#Hint PriceColorOn: Affect the color of the Price bars according to the signals of this indicator\n<b>Default is Yes
#Hint ArrowsOn: Plot Arrows at signal changes \n<b>Default is Yes
#Hint PredictionLineOn: Plot the indicator \n<b>Default is Yes
#Hint ShowTodayOnly: Plot only the most recent arrows in order not to clutter the Price history\nMakes it easier to see prior prices \n<b>Default is no
#Hint ShowExtraDays: Further adjustment to Show Only Today \n<b>Default is 0
#Hint space: Allows you to move the arrows, and avoid stepping on other arrows when multiple studies are shown \n<b>Default is 0.333
#Hint length: Touch this only if you are an expert! Just kidding. \n<b>Default is 9
#Hint price: For the experimenter \n<b>Default is HL2


AssignBackgroundColor(CreateColor(8, 0, 15));
input length2 = 14;
input price2 = HL2;
input PriceColorOn2 = Yes;
input ArrowsOn2 = Yes;
input PredictionLineOn2 = Yes;
input BubblesOn2 = No;
input ShowTodayOnly2 = no;
input ShowExtraDays2 = 0;
input space2 = 0.333;
def Today2 = if !ShowTodayOnly2 then 1 else if GetDay() + ShowExtraDays2 >= GetLastDay() then 1 else 0;

def AvgPrice2 = Average(price2, length2);
def SumTime2 = fold i2 = 1 to length2 + 1 with x2 = 0 do x2 + i2;
def AvgTime2 = SumTime2 / length2;
    #sx is the sum of all the deviations from time for the last x bars
def sx2 = fold j2 = 1 to length2 + 1 with y2 = 0 do y2 + ((j2 - AvgTime2) * (GetValue(price2, length2 - j2, length2 + 1) - AvgPrice2));
        #sy is the sum of all the deviations from price for the last x bars
def sy2 = fold k2 = 1 to length2 + 1 with z2 = 0 do z2 + (Power(k2 - AvgTime2, 2));
        #m is the slope of the line, b is the slope intercept of the line in the equation y = mx + b
def m2 = sx2 / sy2;
def b2 = AvgPrice2 - m2 * AvgTime2;
def Prediction2 = (m2 * (length2 + 1)) + b2;
plot FuturePrediction2 = if !PredictionLineOn2 then Double.NaN else Prediction2;
FuturePrediction2.AssignValueColor(if FuturePrediction2 > FuturePrediction2[1] then Color.GREEN else Color.RED);
FuturePrediction2.SetLineWeight(3);
FuturePrediction2.HideBubble();


AssignPriceColor(if !PriceColorOn2 then Color.CURRENT else if Prediction2 > Prediction2[1] then (CreateColor(000, 255, 255)) else if Prediction2 < Prediction2[1] then (CreateColor(255, 160, 000)) else Color.GRAY);
AddLabel(PriceColorOn2 , "Price Color On", if Prediction2 > Prediction2[1] then Color.GREEN else if Prediction2 < Prediction2[1] then Color.RED else Color.GRAY);

AddLabel(ArrowsOn2, "MagentaArrows=LeastSquares",  if Prediction2 > Prediction2[1] then Color.GREEN else if Prediction2 < Prediction2[1] then Color.RED else Color.GRAY);

def spaceman2 = Average(high - low) * space2;
def xover2 = Crosses(Prediction2, Prediction2[1], CrossingDirection.ANY);
plot UpArrow2 = if Today2 && xover2 && Prediction2 > Prediction2[1] then low - spaceman2 else Double.NaN;
UpArrow2.SetPaintingStrategy(PaintingStrategy.ARROW_UP);
UpArrow2.SetDefaultColor(Color.MAGENTA);
plot DnArrow2 = if Today2 && xover2 && Prediction2 < Prediction2[1] then high + spaceman2 else Double.NaN;
DnArrow2.SetPaintingStrategy(PaintingStrategy.ARROW_DOWN);
DnArrow2.SetDefaultColor(Color.MAGENTA);

    #    plot firstup = crosses((Prediction > low), yes) && Prediction < Prediction[1];
    #    firstup.SetPaintingStrategy(PaintingStrategy.BOOLEAN_ARROW_UP);

    #    plot firstdown = crosses((Prediction < high), yes) && Prediction > Prediction[1];
    #    firstdown.SetPaintingStrategy(PaintingStrategy.BOOLEAN_ARROW_DOWN);

rec LastArrow2 = if low > Prediction2 && LastArrow2[1] <> 1 && Prediction2 < Prediction2[1] then 1 else
    if high < Prediction2 && LastArrow2[1] <> -1 && Prediction2 > Prediction2[1] then -1 else LastArrow2[1];

plot firstup2 = if Today2 && LastArrow2 > 0 && LastArrow2 <> LastArrow2[1]  then low else Double.NaN;
firstup2.SetPaintingStrategy(PaintingStrategy.ARROW_UP);
firstup2.SetLineWeight(5);
firstup2.SetDefaultColor(Color.YELLOW);
plot firstdown2 = if Today2 && LastArrow2 < 0 && LastArrow2 <> LastArrow2[1]  then high else Double.NaN;
firstdown2.SetPaintingStrategy(PaintingStrategy.ARROW_DOWN);
firstdown2.SetLineWeight(5);
firstdown2.SetDefaultColor(Color.YELLOW);


#    Money Management

# Longs

def exposure20pct2 = LastArrow2 < 0 && LastArrow2 <> LastArrow2[1];

def exposure40pct2 = Prediction2[3] > Prediction2[4] && Prediction2[2] > Prediction2[3] && Prediction2[1] > Prediction2[2] && Prediction2 > Prediction2[1] ;

def exposure60pct22 = Prediction2[2] > Prediction2[3] && Prediction2[1] > Prediction2[2] && Prediction2 > Prediction2[1];

def exposure80pct2 = Prediction2[1] > Prediction2[2] && Prediction2 > Prediction2[1];

def exposure100pct2 = xover2 && Prediction2 > Prediction2[1];

# Shorts

def exposureneg20pct2 = LastArrow2 > 0 && LastArrow2 <> LastArrow2[1];

def exposureneg40pct2 = Prediction2[3] < Prediction2[4] && Prediction2[2] < Prediction2[3] && Prediction2[1] < Prediction2[2] && Prediction2 < Prediction2[1];

def exposureneg60pct2 = Prediction2[2] < Prediction2[3] && Prediction2[1] < Prediction2[2] && Prediction2 < Prediction2[1];

def exposureneg80pct2 = Prediction2[1] < Prediction2[2] && Prediction2 < Prediction2[1];

def exposureneg100pct2 = xover2 && Prediction2 < Prediction2[1];


AddLabel(yes, Concat( "", Concat(" ",
if exposure20pct2 then "Long 20% " else
if exposure40pct2 then "Long 40% " else

if exposure80pct2 then "Long 80%" else
if exposure100pct2 then "Long 100%" else

if exposureneg20pct2 then "Short 20% " else
if exposureneg40pct2 then "Short 40% " else
if exposureneg60pct2 then "Short 60%" else
if exposureneg80pct2 then "Short 80%" else
if exposureneg100pct2 then "Short 100%" else
"Go Flat")),

if exposure20pct2 then Color.CYAN else
if exposure40pct2 then  Color.CYAN else

if exposure80pct2 then Color.CYAN else
if exposure100pct2 then  Color.CYAN else
if exposureneg20pct2 then Color.ORANGE else
if exposureneg40pct2 then Color.ORANGE else
if exposureneg60pct2 then Color.ORANGE else
if exposureneg80pct2 then Color.ORANGE else
if exposureneg100pct2 then Color.ORANGE else
Color.WHITE);

AddChartBubble(BubblesOn2 && xover2 && Prediction2 > Prediction2[1] , low, Concat("Buy Baby", HL2), Color.CYAN, yes);

AddChartBubble(BubblesOn2 && xover2 && Prediction2 < Prediction2[1] , high, Concat("Sell That Bad Boy", HL2), Color.ORANGE, yes);

# ************************************************************