Last Candle Price vs Stock Price

deansafeleen

New member
VIP
Any idea what is causing the price of a stock on my chart to be different from the real time price? This is occurring with every symbol. Thank You in advance.

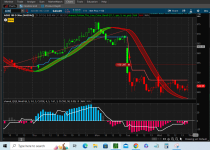
Here is a screenshot of what I mean. The actual price of AMD is 205.13, but the chart shows a price of 205.16. This is happening in real time with all symbols. This issue is not occurring when not using these indicators. Any idea to to sync the chart price with the actual price?

shared link:
http://tos.mx/6V7O3PA
 

Attachments

  • Screenshot.PNG
    Screenshot.PNG
    129.2 KB · Views: 72
Last edited by a moderator:
Solution
The discrepancy in price also occurs consistently during the day session. It is always off by a few cents, for every equity symbol.
For the price quoted at the top of the chart and near the ticker symbol this would be the Last price traded at, as it is next to the Bid (B:) and Ask (A:) quotes.
Last price will be at or between the Bid and Ask quotes.
Bid and Ask quote difference can be narrow or wide depending on how actively the product is traded.

The price on the right side of the chart is the Close price, which is not the tradeable or Last price at which the trader buys/sells. The Active Trader sidebar shows the Bid/Ask orders being placed.
Is there something in my chart setup causing there to be a 5 minute discrepancy?

As explained, it is not a discrepancy.
The 5 min timeframe close at 3:55 pm vs the day final close price which is the 4:00pm open
So as long as you are on the 5min timeframe, the LAST candle occurs at 3:55pm
(which I should have realized what the OP was talking about, thank you @Ramisegal (y)).
You can turn on extended hours to see additional candles.
 
Last edited:
As explained, it is not a discrepancy.

So as long as you are on the 5min timeframe, the LAST candle occurs at 3:55pm
(which I didn't realize, thank you @Ramisegal (y) as I do not work with the lowest timeframes).
You can turn on extended hours to see additional candles.
The discrepancy in price also occurs consistently during the day session. It is always off by a few cents, for every equity symbol.
 
The discrepancy in price also occurs consistently during the day session. It is always off by a few cents, for every equity symbol.
For the price quoted at the top of the chart and near the ticker symbol this would be the Last price traded at, as it is next to the Bid (B:) and Ask (A:) quotes.
Last price will be at or between the Bid and Ask quotes.
Bid and Ask quote difference can be narrow or wide depending on how actively the product is traded.

The price on the right side of the chart is the Close price, which is not the tradeable or Last price at which the trader buys/sells. The Active Trader sidebar shows the Bid/Ask orders being placed.
 
Solution
I think there some other problem in the transition because yesterday the Analyze tab => Risk Profile was wrongly showing curves and I send an email about that. apparently today it is working, surely not because of my claim. patience is the name of the game here and also some tolerance apparently
 
I think there some other problem in the transition because yesterday the Analyze tab => Risk Profile was wrongly showing curves and I send an email about that. apparently today it is working, surely not because of my claim. patience is the name of the game here and also some tolerance apparently
Understood. But today and every day, the real time live price is different than my charts right axis live price. Futures are fine, but equities are having this issue.
 

Attachments

  • Screenshot.PNG
    Screenshot.PNG
    144.4 KB · Views: 49
Last edited:
For the price quoted at the top of the chart and near the ticker symbol this would be the Last price traded at, as it is next to the Bid (B:) and Ask (A:) quotes.
Last price will be at or between the Bid and Ask quotes.
Bid and Ask quote difference can be narrow or wide depending on how actively the product is traded.

The price on the right side of the chart is the Close price, which is not the tradeable or Last price at which the trader buys/sells. The Active Trader sidebar shows the Bid/Ask orders being placed.
Interesting, when I switch to daily of weekly chart, price is in sync. Anything below these and price is off.
 

Join useThinkScript to post your question to a community of 21,000+ developers and traders.

Similar threads

Not the exact question you're looking for?

Start a new thread and receive assistance from our community.

87k+ Posts
299 Online
Create Post

Similar threads

Similar threads

The Market Trading Game Changer

Join 2,500+ subscribers inside the useThinkScript VIP Membership Club
  • Exclusive indicators
  • Proven strategies & setups
  • Private Discord community
  • ‘Buy The Dip’ signal alerts
  • Exclusive members-only content
  • Add-ons and resources
  • 1 full year of unlimited support

Frequently Asked Questions

What is useThinkScript?

useThinkScript is the #1 community of stock market investors using indicators and other tools to power their trading strategies. Traders of all skill levels use our forums to learn about scripting and indicators, help each other, and discover new ways to gain an edge in the markets.

How do I get started?

We get it. Our forum can be intimidating, if not overwhelming. With thousands of topics, tens of thousands of posts, our community has created an incredibly deep knowledge base for stock traders. No one can ever exhaust every resource provided on our site.

If you are new, or just looking for guidance, here are some helpful links to get you started.

What are the benefits of VIP Membership?
VIP members get exclusive access to these proven and tested premium indicators: Buy the Dip, Advanced Market Moves 2.0, Take Profit, and Volatility Trading Range. In addition, VIP members get access to over 50 VIP-only custom indicators, add-ons, and strategies, private VIP-only forums, private Discord channel to discuss trades and strategies in real-time, customer support, trade alerts, and much more. Learn all about VIP membership here.
How can I access the premium indicators?
To access the premium indicators, which are plug and play ready, sign up for VIP membership here.
Back
Top