largest gain/range since uptrend

beh0211

New member
Thinkscript to show label & arrow for largest gain/range since uptrend

Hey guys,

I am working on a new indicator to display lable & arrow for largest gain and largest range candle since 50MA crosses 150MA.

I manage to display the label correctly but somehow my painting strategy ain't showing. Appreciate if anyone can give some advise.

Code:
def downtrend = SimpleMovingAvg(length = 50) < SimpleMovingAvg(length = 150);

def countuptrend = if downtrend[1] then 1 else countuptrend[1] + 1;

#AddLabel(1, "Bar since 50x150: "+ countuptrend, (if countuptrend >50 then color.DARK_GREEN else color.red));

plot largestgainD = fold i = 0 to countuptrend with p1 do if GetValue(close - close[1],i) > p1 then GetValue(close - close[1],i) else p1;

plot largestrangeD = fold j = 0 to countuptrend  with p2 do if GetValue(high-low,j) > p2 then GetValue(high-low,j) else p2;

#not working here
largestgainD.SetPaintingStrategy(PaintingStrategy.ARROW_UP);

def isLargestgainD = close-close[1] >= largestgainD;
def isLargestrangeD = high-low >= largestrangeD;

AddLabel(1, "Largest Daily Gain: $ "+ largestgainD, (if isLargestgainD and countuptrend > 1 then color.red else color.GRAY));

AddLabel(1, "Largest Daily Range: $ "+ largestrangeD, (if isLargestrangeD and countuptrend > 1 then color.red else color.GRAY));
 
Last edited by a moderator:
Solution
Hey guys,

I am working on a new indicator to display lable & arrow for largest gain and largest range candle since 50MA crosses 150MA.

I manage to display the label correctly but somehow my painting strategy ain't showing. Appreciate if anyone can give some advise.

Code:
def downtrend = SimpleMovingAvg(length = 50) < SimpleMovingAvg(length = 150);

def countuptrend = if downtrend[1] then 1 else countuptrend[1] + 1;

#AddLabel(1, "Bar since 50x150: "+ countuptrend, (if countuptrend >50 then color.DARK_GREEN else color.red));

plot largestgainD = fold i = 0 to countuptrend with p1 do if GetValue(close - close[1],i) > p1 then GetValue(close - close[1],i) else p1;

plot largestrangeD = fold j = 0 to countuptrend  with p2 do if...

Join useThinkScript to post your question to a community of 21,000+ developers and traders.

I changed to boolean arrow but still nothing come up. Is it due to the fold function ?

00M1Ec5.png
 
Hey guys,

I am working on a new indicator to display lable & arrow for largest gain and largest range candle since 50MA crosses 150MA.

I manage to display the label correctly but somehow my painting strategy ain't showing. Appreciate if anyone can give some advise.

Code:
def downtrend = SimpleMovingAvg(length = 50) < SimpleMovingAvg(length = 150);

def countuptrend = if downtrend[1] then 1 else countuptrend[1] + 1;

#AddLabel(1, "Bar since 50x150: "+ countuptrend, (if countuptrend >50 then color.DARK_GREEN else color.red));

plot largestgainD = fold i = 0 to countuptrend with p1 do if GetValue(close - close[1],i) > p1 then GetValue(close - close[1],i) else p1;

plot largestrangeD = fold j = 0 to countuptrend  with p2 do if GetValue(high-low,j) > p2 then GetValue(high-low,j) else p2;

#not working here
largestgainD.SetPaintingStrategy(PaintingStrategy.ARROW_UP);

def isLargestgainD = close-close[1] >= largestgainD;
def isLargestrangeD = high-low >= largestrangeD;

AddLabel(1, "Largest Daily Gain: $ "+ largestgainD, (if isLargestgainD and countuptrend > 1 then color.red else color.GRAY));

AddLabel(1, "Largest Daily Range: $ "+ largestrangeD, (if isLargestrangeD and countuptrend > 1 then color.red else color.GRAY));

To get the arrow to plot, the plot lg = the point when close-close[1] equals largestgainD result.

Capture.jpg
Ruby:
def downtrend = SimpleMovingAvg(length = 50) < SimpleMovingAvg(length = 150);

def countuptrend = if downtrend[1] then 1 else countuptrend[1] + 1;

#AddLabel(1, "Bar since 50x150: "+ countuptrend, (if countuptrend >50 then color.DARK_GREEN else color.red));

def largestgainD = fold i = 0 to HighestAll(countuptrend) with p1 do if GetValue(close - close[1], i) > p1 then GetValue(close - close[1], i) else p1;

def largestrangeD = fold j = 0 to HighestAll(countuptrend)  with p2 do if GetValue(high - low, j) > p2 then GetValue(high - low, j) else p2;

##############
plot lg = (close - close[1]) == largestgainD;
lg.SetPaintingStrategy(PaintingStrategy.BOOLEAN_ARROW_UP);
lg.setlineWeight(5);
##############

def isLargestgainD = close - close[1] >= largestgainD;
def isLargestrangeD = high - low >= largestrangeD;

AddLabel(1, "Largest Daily Gain: $ " + largestgainD, (if isLargestgainD and countuptrend > 1 then Color.RED else Color.GRAY));

AddLabel(1, "Largest Daily Range: $ " + largestrangeD, (if isLargestrangeD and countuptrend > 1 then Color.RED else Color.GRAY));
 
Solution
I know this is absolutely and completely jacked, but I can't focus very well at all lately
Code:
input barsback = 126;
def lowofperiod = lowest(close,barsback);

plot ll = getminvalueoffset(close,barsback);
ll.SetPaintingStrategy(PaintingStrategy.BOOLEAN_ARROW_UP);

def countuptrend = if  lowofperiod[1] then 1 else countuptrend[1] + 1;

def largestgainD = fold i = 0 to HighestAll(countuptrend) with p1 do if GetValue(close - ll, i) > p1 then GetValue(close - ll, i) else p1;

##############
plot lg = (close -ll) == largestgainD;
lg.SetPaintingStrategy(PaintingStrategy.BOOLEAN_ARROW_UP);
lg.setlineWeight(5);
##############

def isLargestgainD = close - close[1] >= largestgainD;

AddLabel(1, "Largest Gain: $ " + largestgainD, (if isLargestgainD and countuptrend > 1 then Color.RED else Color.GRAY));

AddLabel(1, "Largest Gain: " + aspercent(largestgainD/ll),  Color.GRAY);
. Can somebody please check this and see where the errors are? All I'm trying to do is mark the arrow to the highest % gain from the lowest low within the last 126 bars and have the label display how large that percentage gain is. Really appreciate it in advance.
 
I know this is absolutely and completely jacked, but I can't focus very well at all lately
Code:
input barsback = 126;
def lowofperiod = lowest(close,barsback);

plot ll = getminvalueoffset(close,barsback);
ll.SetPaintingStrategy(PaintingStrategy.BOOLEAN_ARROW_UP);

def countuptrend = if  lowofperiod[1] then 1 else countuptrend[1] + 1;

def largestgainD = fold i = 0 to HighestAll(countuptrend) with p1 do if GetValue(close - ll, i) > p1 then GetValue(close - ll, i) else p1;

##############
plot lg = (close -ll) == largestgainD;
lg.SetPaintingStrategy(PaintingStrategy.BOOLEAN_ARROW_UP);
lg.setlineWeight(5);
##############

def isLargestgainD = close - close[1] >= largestgainD;

AddLabel(1, "Largest Gain: $ " + largestgainD, (if isLargestgainD and countuptrend > 1 then Color.RED else Color.GRAY));

AddLabel(1, "Largest Gain: " + aspercent(largestgainD/ll),  Color.GRAY);
. Can somebody please check this and see where the errors are? All I'm trying to do is mark the arrow to the highest % gain from the lowest low within the last 126 bars and have the label display how large that percentage gain is. Really appreciate it in advance. hal_slope


not sure, what exactly you are trying to do.
you say lowest low, but are using close?
what gain, from what to what ? from the lowest low, to what,? the highest high? to the current bar close ?

i added a bubble to display some variables.
i made some notes in your code, describing what is wrong.

after this is my version

Code:
#highest_gain_x_bars

#https://usethinkscript.com/threads/largest-gain-range-since-uptrend.2418/#post-135315
#wtf_dude
#6
#I know this is absolutely and completely jacked, but I can't focus very well at all lately

# Can somebody please check this and see where the errors are? All I'm trying to do is mark the arrow to the highest % gain from the lowest low within the last 126 bars and have the label display how large that percentage gain is. Really appreciate it in advance.

def na = double.nan;
def bn = barnumber();

input barsback = 126;

# the lowest price in last 126 bars,
# this uses  CLOSE , instead of low ??
def lowofperiod = lowest(close, barsback);


# plotting a boolean arrow on a number... instead of true/false .
# the numbers will be interpretted as true, so you get an arrow on every bar
# this uses  CLOSE , instead of low ??
# add size, and color
# plots on every bar
plot ll = getminvalueoffset(close, barsback);
ll.SetPaintingStrategy(PaintingStrategy.BOOLEAN_ARROW_UP);
ll.setlineWeight(2);
ll.setdefaultcolor(color.yellow);


# lowofperiod[1]  is a number, not true/false,  so this is always true, and = 1
def countuptrend = if lowofperiod[1] then 1 else countuptrend[1] + 1;


# since countuptrend = 1 ( and loops don't process the last number) it counts from 0 to 0.
# so just 0 is used as an offset, the current bar.
# ll will be a different value on the 126 bars
def largestgainD = fold i = 0 to HighestAll(countuptrend)
 with p1
 do if GetValue(close - ll, i) > p1 then GetValue(close - ll, i) else p1;


addchartbubble(0, low*0.999,
bn + "\n" +
lowofperiod + "\n" +
ll + "\n" +
countuptrend + "\n" +
largestgainD
, color.magenta, no);


##############
# chg arrow to be down, so it isn't on top of other arrow, to verify when it is triggered
# plots on every bar
plot lg = (close -ll) == largestgainD;
#lg.SetPaintingStrategy(PaintingStrategy.BOOLEAN_ARROW_UP);
lg.SetPaintingStrategy(PaintingStrategy.BOOLEAN_ARROW_down);
lg.setlineWeight(5);
lg.setdefaultcolor(color.white);

##############

def isLargestgainD = close - close[1] >= largestgainD;

AddLabel(1, "Largest Gain: $ " + largestgainD, (if isLargestgainD and countuptrend > 1 then Color.RED else Color.GRAY));

AddLabel(1, "Largest Gain: " + aspercent(largestgainD/ll),  Color.GRAY);


#========================


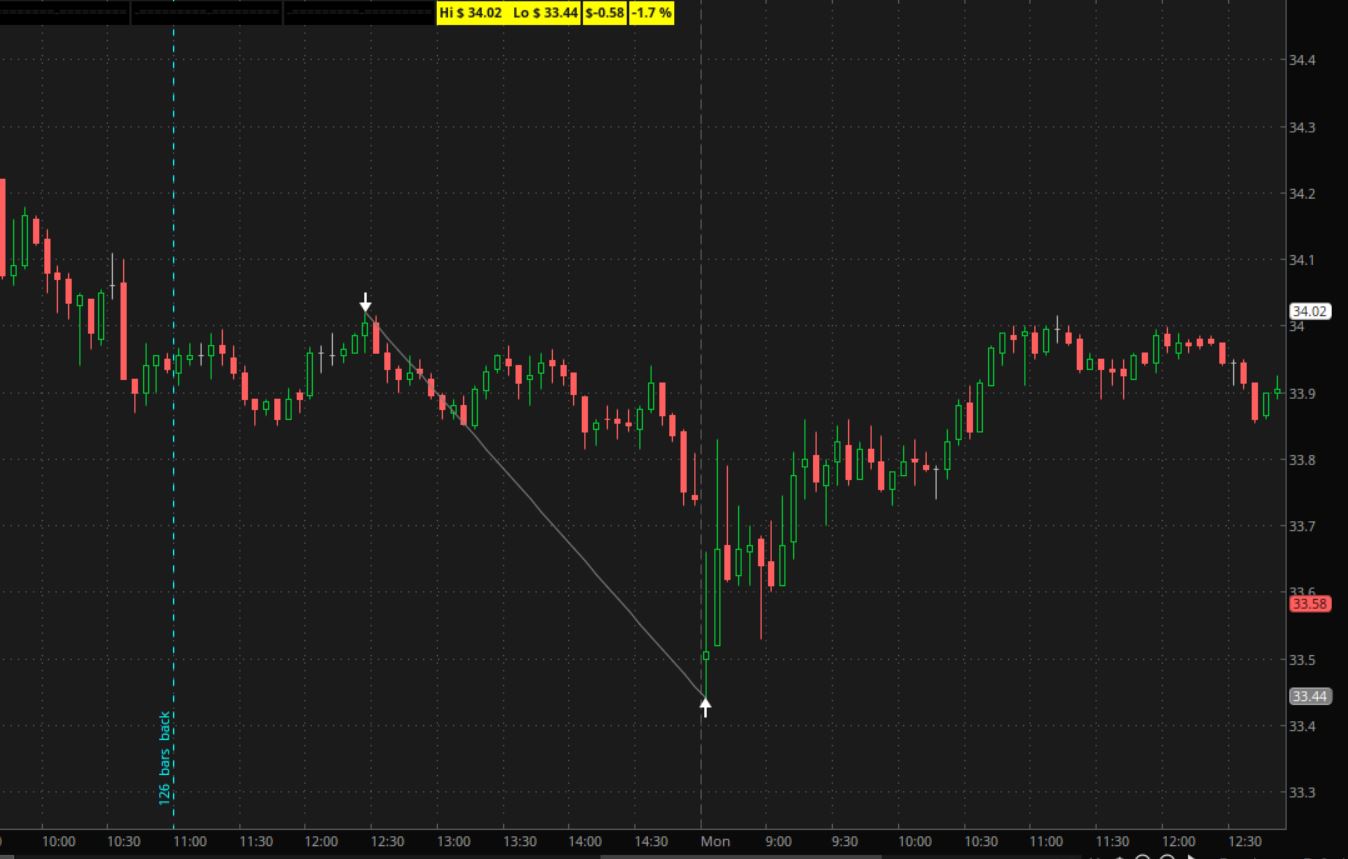
here my version,
it finds the highest high and lowest low, within the last 126 bars on the chart.
labels show the dollar difference and a % gain


Code:
#highest_gain_x_bars_01

#https://usethinkscript.com/threads/largest-gain-range-since-uptrend.2418/#post-135315
#wtf_dude
#6
#I know this is absolutely and completely jacked, but I can't focus very well at all lately

# Can somebody please check this and see where the errors are? All I'm trying to do is mark the arrow to the highest % gain from the lowest low within the last 126 bars and have the label display how large that percentage gain is. Really appreciate it in advance.

def na = double.nan;
def bn = barnumber();

input barsback = 126;


# redo the code

# find the bar that is 126 bars before the last bar,
# find the bars with highest high and lowest low after 126 bar
# read prices from the highest and lowest
# hold those values to the last bar
# calculate a slope, and difference


# define a bar 126 bars before last bar
def x = (!isnan(close[-(barsback-1)]) and isnan(close[-barsback]));
input vertical_line_126bars_back = yes;
addverticalline(vertical_line_126bars_back and x, "   " + barsback + "  bars  back", color.cyan);


def big = 99999;
def hibn;
def hi;
def lobn;
def lo;
def slope;
if bn == 1 then {
 hibn = 0;
 hi = 0;
 lobn = 0;
 lo = 0;
 slope = 0;
} else if x then {
 hi = fold a = 0 to barsback
 with p
 do max(p, getvalue(high, -a));
 hibn = fold b = 0 to barsback
 with q
 do if getvalue(high, -b) == hi then getvalue(bn, -b) else q;

 lo = fold c = 0 to barsback
 with r = big
 do min(r, getvalue(low, -c));
 lobn = fold d = 0 to barsback
 with s
 do if getvalue(low, -d) == lo then getvalue(bn, -d) else s;

 slope = (hi-lo)/(hibn-lobn);
} else {
 hibn = hibn[1];
 hi = hi[1];
 lobn = lobn[1];
 lo = lo[1];
 slope = slope[1];
}


def line = if bn == 1 then na
 else if bn == hibn and high == hi then high
 else if bn == lobn and low == lo then low
 else if bn > max(hibn, lobn) then na
 else line[1] + slope;

plot z1 = line;
z1.setdefaultcolor(color.gray);


#addverticalline( bn == hibn or bn == lobn, "--", color.cyan);

# arrows on highest and lowest
plot zhi = if bn == hibn then high else na;
zhi.SetPaintingStrategy(PaintingStrategy.aRROW_down);
zhi.setlineWeight(2);
zhi.setdefaultcolor(color.white);

plot zlo = if bn == lobn then low else na;
zlo.SetPaintingStrategy(PaintingStrategy.ARROW_up);
zlo.setlineWeight(2);
zlo.setdefaultcolor(color.white);


def per = round(100*((hi-lo)*(sign(hibn-lobn)))/lo, 1);

addlabel(1, "Hi $ " + hi + "   Lo $ " + lo, color.yellow);
addlabel(1, "$" + (hi-lo)*(sign(hibn-lobn)), color.yellow);
addlabel(1, per + " %", color.yellow);


#-----------------------------
addchartbubble(0, high*1.001,
bn + "\n" +
hi + "\n" +
hibn + "\n" +
lo + "\n" +
lobn + "\n" +
slope
, color.magenta, yes);
#

A5Z8Ahy.jpg
 
Good god man, thank you so much. NO WAY I would have figured out that logic. Originally my issue was that I could figure out how to establish where the lowest low/close was but since you couldn't use a variable number for the getmaxvalueoffset I was tearing my hair out how to make sure that the peak came after the valley. Nothing I tried wouldn't run into that same error of not having a constant to use. That being said, it's going to take a minute to wrap my head around how you did this exactly but again thanks so much for the help!

*I was trying to get the lowest close to highest close, sorry for not being clear. Now I'm trying to figure out how to restrict to only largest gain? Dont need largest loss

** And if you're curious why I'm bothering with this it's because I've found that instead of using ATR to determine if a stock is a fast enough mover, it's much more effective to find out how far a stock has moved AND is able to hold on to the gain within a certain amount of time. Often you get wide ATR/ADR stocks, but they just chop sideways which means you're going to end up with alot of extra wide chopping garbage in your scans. I've already been using a way to measure it based on the biggest move within 5 days, but the way I have that coded you have to individually compare the gains of each day vs using a fold functtion. I didn't want to have to write out % gain equations 50 different times.
 
Last edited:
@halcyonguy sorry man, I can't seem to get it to work to restrict finding only the largest gain. Could you give me a hand? Sorry to bother. Would I be making a whole new if then statement using the bar number found for the low? This all still seems pretty convoluted to me, fold/counts are the bane of my existence
 
Good god man, thank you so much. NO WAY I would have figured out that logic. Originally my issue was that I could figure out how to establish where the lowest low/close was but since you couldn't use a variable number for the getmaxvalueoffset I was tearing my hair out how to make sure that the peak came after the valley. Nothing I tried wouldn't run into that same error of not having a constant to use. That being said, it's going to take a minute to wrap my head around how you did this exactly but again thanks so much for the help!

*I was trying to get the lowest close to highest close, sorry for not being clear. Now I'm trying to figure out how to restrict to only largest gain? Dont need largest loss

** And if you're curious why I'm bothering with this it's because I've found that instead of using ATR to determine if a stock is a fast enough mover, it's much more effective to find out how far a stock has moved AND is able to hold on to the gain within a certain amount of time. Often you get wide ATR/ADR stocks, but they just chop sideways which means you're going to end up with alot of extra wide chopping garbage in your scans. I've already been using a way to measure it based on the biggest move within 5 days, but the way I have that coded you have to individually compare the gains of each day vs using a fold functtion. I didn't want to have to write out % gain equations 50 different times.
welcome. i will work on a modified version. if only a gain is desired, then the high barnumber will be bigger than the low barnumber.
it may be possible for the biggest gain to start from a low , before and higher , than the lowest low. maybe looking back from the highest high, then look back for a low will work? but if the highest high is 100 bars back, the hi lo diff before it might be small while after that high, there could be a larger hi lo diff (the biggest gain may not be from the highest or lowest). will think about it.
 
@halcyonguy sorry man, I can't seem to get it to work to restrict finding only the largest gain. Could you give me a hand? Sorry to bother. Would I be making a whole new if then statement using the bar number found for the low? This all still seems pretty convoluted to me, fold/counts are the bane of my existence

i think i will have to use 2 nested loops to check every hi lo combination...? to find, the biggest gain, with the high after the low.
something like this...
thinking
https://usethinkscript.com/threads/ants-—-momentum-volume-and-price-mvp.7497/#post-74080
 
welcome. i will work on a modified version. if only a gain is desired, then the high barnumber will be bigger than the low barnumber.
it may be possible for the biggest gain to start from a low , before and higher , than the lowest low. maybe looking back from the highest high, then look back for a low will work? but if the highest high is 100 bars back, the hi lo diff before it might be small while after that high, there could be a larger hi lo diff (the biggest gain may not be from the highest or lowest). will think about it.
hmm i guess you could find the highest high/close, then make the lookback for the low only in between the window of between that high and 126 bars back? (Btw 126 is being used as 2 qtrs/6 months, not just random number)
 
hmm i guess you could find the highest high/close, then make the lookback for the low only in between the window of between that high and 126 bars back? (Btw 126 is being used as 2 qtrs/6 months, not just random number)

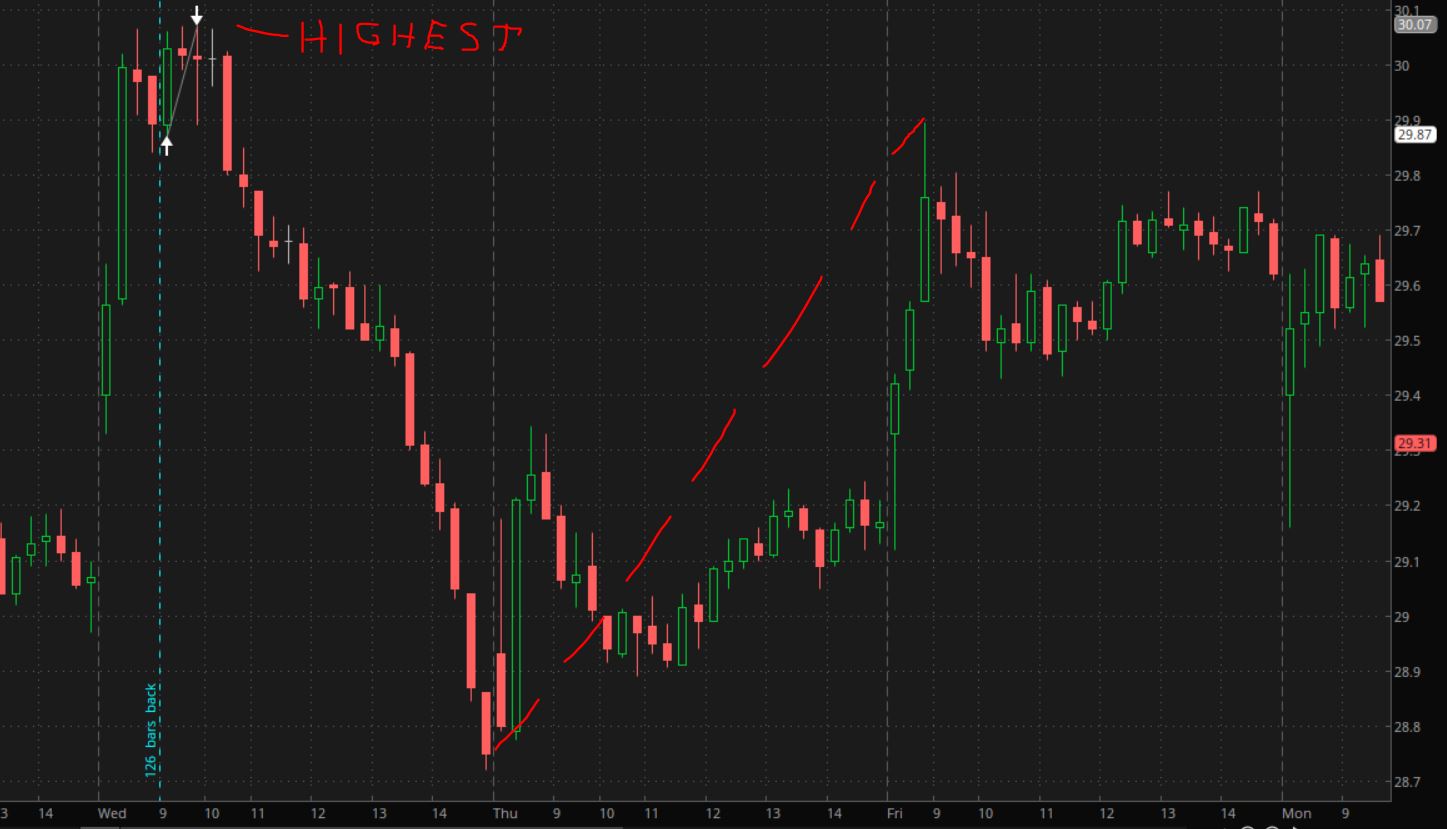
recap , if you only want +gains, then the low is before the high.

this version looks for the highest high. then look back for the lowest low before that high.
changed the loops around code line 65+

here you can see this doesn't result in the biggest price difference, (using the highest high).
the red line is what should be found.

(oops still using high and low, instead of close. will switch in next ver)

will keep experimenting...

***** added a 2nd ver after this one *****


Code:
#highest_gain_x_bars_02

# only look at low to high, biggest gain

# ver a -
#  find highest high.
#  then look before it for lowest low


#https://usethinkscript.com/threads/largest-gain-range-since-uptrend.2418/#post-135315
#wtf_dude
#6
#I know this is absolutely and completely jacked, but I can't focus very well at all lately

# Can somebody please check this and see where the errors are? All I'm trying to do is mark the arrow to the highest % gain from the lowest low within the last 126 bars and have the label display how large that percentage gain is. Really appreciate it in advance.

def na = double.nan;
def bn = barnumber();

input barsback = 126;


# redo the code

# find the bar that is 126 bars before the last bar,
# find the bars with highest high and lowest low after 126 bar
# read prices from the highest and lowest
# hold those values to the last bar
# calculate a slope, and difference


# define a bar 126 bars before last bar
def x = (!isnan(close[-(barsback-1)]) and isnan(close[-barsback]));
input vertical_line_126bars_back = yes;
addverticalline(vertical_line_126bars_back and x, "   " + barsback + "  bars  back", color.cyan);

def xbn = if bn == 1 then 0
 else if x then bn
 else xbn[1];


def big = 99999;
def hibn;
def hi;
def lobn;
def lo;
def slope;
if bn == 1 then {
 hibn = 0;
 hi = 0;
 lobn = 0;
 lo = 0;
 slope = 0;
} else if x then {
 hi = fold a = 0 to barsback
 with p
 do max(p, getvalue(high, -a));
 hibn = fold b = 0 to barsback
 with q
 do if getvalue(high, -b) == hi then getvalue(bn, -b) else q;


 lo = fold c = 0 to (hibn - xbn)
 with r = big
 do min(r, getvalue(low, -c));

 lobn = fold d = 0 to (hibn - xbn)
 with s
 do if getvalue(low, -d) == lo then getvalue(bn, -d) else s;

 slope = (hi-lo)/(hibn-lobn);
} else {
 hibn = hibn[1];
 hi = hi[1];
 lobn = lobn[1];
 lo = lo[1];
 slope = slope[1];
}


def line = if bn == 1 then na
 else if bn == hibn and high == hi then high
 else if bn == lobn and low == lo then low
 else if bn > max(hibn, lobn) then na
 else line[1] + slope;

plot z1 = line;
z1.setdefaultcolor(color.gray);

#addverticalline( bn == hibn or bn == lobn, "--", color.cyan);

# arrows on highest and lowest
plot zhi = if bn == hibn then high else na;
zhi.SetPaintingStrategy(PaintingStrategy.aRROW_down);
zhi.setlineWeight(2);
zhi.setdefaultcolor(color.white);

plot zlo = if bn == lobn then low else na;
zlo.SetPaintingStrategy(PaintingStrategy.ARROW_up);
zlo.setlineWeight(2);
zlo.setdefaultcolor(color.white);


def per = round(100*((hi-lo)*(sign(hibn-lobn)))/lo, 1);

addlabel(1, "Hi $ " + hi + "   Lo $ " + lo, color.yellow);
addlabel(1, "$" + (hi-lo)*(sign(hibn-lobn)), color.yellow);
addlabel(1, per + " %", color.yellow);

addchartbubble(0, high*1.001,
bn + "\n" +
hi + "\n" +
hibn + "\n" +
lo + "\n" +
lobn + "\n" +
slope
, color.magenta, yes);
#

z12KLSW.jpg


======================

another ver
uses close for price levels. can pick price parameters
finds highest close, then looks for lowest close


Code:
#highest_gain_x_bars_02

# only look at low to high, biggest gain


# ver 02b
#  chg to close, no low and high ( add inputs)
#  loop over every close (for a low)
#   from that close , loop over bars fater and find bn with biggest close to close diff


#https://usethinkscript.com/threads/largest-gain-range-since-uptrend.2418/#post-135315
#wtf_dude
#6
#I know this is absolutely and completely jacked, but I can't focus very well at all lately

# Can somebody please check this and see where the errors are? All I'm trying to do is mark the arrow to the highest % gain from the lowest low within the last 126 bars and have the label display how large that percentage gain is. Really appreciate it in advance.

def na = double.nan;
def bn = barnumber();

input barsback = 126;

input high_price = close;
input low_price = close;

# redo the code

# find the bar that is 126 bars before the last bar,
# find the bars with highest high and lowest low after 126 bar
# read prices from the highest and lowest
# hold those values to the last bar
# calculate a slope, and difference


# define a bar 126 bars before last bar
def x = (!isnan(close[-(barsback-1)]) and isnan(close[-barsback]));
input vertical_line_126bars_back = yes;
addverticalline(vertical_line_126bars_back and x, "   " + barsback + "  bars  back", color.cyan);

def xbn = if bn == 1 then 0
 else if x then bn
 else xbn[1];


def big = 99999;
def hibn;
def hi;
def lobn;
def lo;
def slope;
if bn == 1 then {
 hibn = 0;
 hi = 0;
 lobn = 0;
 lo = 0;
 slope = 0;
} else if x then {
 hi = fold a = 0 to barsback
 with p
 do max(p, getvalue(high_price, -a));
 hibn = fold b = 0 to barsback
 with q
 do if getvalue(high_price, -b) == hi then getvalue(bn, -b) else q;


 lo = fold c = 0 to (hibn - xbn)
 with r = big
 do min(r, getvalue(low_price, -c));

 lobn = fold d = 0 to (hibn - xbn)
 with s
 do if getvalue(low_price, -d) == lo then getvalue(bn, -d) else s;

 slope = (hi-lo)/(hibn-lobn);
} else {
 hibn = hibn[1];
 hi = hi[1];
 lobn = lobn[1];
 lo = lo[1];
 slope = slope[1];
}


def line = if bn == 1 then na
 else if bn == hibn and high_price == hi then high_price
 else if bn == lobn and low_price == lo then low_price
 else if bn > max(hibn, lobn) then na
 else line[1] + slope;

plot z1 = line;
z1.setdefaultcolor(color.gray);

#addverticalline( bn == hibn or bn == lobn, "--", color.cyan);

# arrows on highest and lowest
plot zhi = if bn == hibn then high_price else na;
zhi.SetPaintingStrategy(PaintingStrategy.aRROW_down);
zhi.setlineWeight(2);
zhi.setdefaultcolor(color.white);

plot zlo = if bn == lobn then low_price else na;
zlo.SetPaintingStrategy(PaintingStrategy.ARROW_up);
zlo.setlineWeight(2);
zlo.setdefaultcolor(color.white);


def per = round(100*((hi-lo)*(sign(hibn-lobn)))/lo, 1);

addlabel(1, "Hi $ " + hi + "   Lo $ " + lo, color.yellow);
addlabel(1, "$" + (hi-lo)*(sign(hibn-lobn)), color.yellow);
addlabel(1, per + " %", color.yellow);

addchartbubble(0, high*1.001,
bn + "\n" +
hi + "\n" +
hibn + "\n" +
lo + "\n" +
lobn + "\n" +
slope
, color.magenta, yes);
#
 
Last edited:
hmm i guess you could find the highest high/close, then make the lookback for the low only in between the window of between that high and 126 bars back? (Btw 126 is being used as 2 qtrs/6 months, not just random number)

this is sloppy, but it finds the max gain in dollars.
it doesn't mark the low and high bars. that could be a future version


Code:
#highest_gain_x_bars_02

# only look at low to high, biggest gain


# ver 02b 
#  chg to close, no low and high ( add inputs)
#  loop over every close (for a low)
#   from that close , loop over bars fater and find bn with biggest close to close diff


#https://usethinkscript.com/threads/largest-gain-range-since-uptrend.2418/#post-135315
#wtf_dude
#6
#I know this is absolutely and completely jacked, but I can't focus very well at all lately

# Can somebody please check this and see where the errors are? All I'm trying to do is mark the arrow to the highest % gain from the lowest low within the last 126 bars and have the label display how large that percentage gain is. Really appreciate it in advance.

def na = double.nan;
def bn = barnumber();

input barsback = 126;

input high_price = close;
input low_price = close;

# redo the code

# find the bar that is 126 bars before the last bar,
# find the bars with highest high and lowest low after 126 bar
# read prices from the highest and lowest
# hold those values to the last bar
# calculate a slope, and difference


# define a bar 126 bars before last bar
def x = (!isnan(close[-(barsback-1)]) and isnan(close[-barsback]));
input vertical_line_126bars_back = yes;
addverticalline(vertical_line_126bars_back and x, "   " + barsback + "  bars  back", color.cyan);

def xbn = if bn == 1 then 0
 else if x then bn
 else xbn[1];


def big = 99999;
def gain;
def hibn;
def hi;
def lobn;
def lo;
def slope;
if bn == 1 then {
 gain = 0;
 hibn = 0;
 hi = 0;
 lobn = 0;
 lo = 0;
 slope = 0;
} else if x then {

#  loop thru all close.(lows)
#  then loop thru all close(highs) after it, to find the biggest gain


# gain = fold a1 = 0 to barsback 
# with p1
# do  max(
#   (fold a2 = (a1 + 1) to (barsback )
#    with p2
#    do max( getvalue(high_price, -a2) - getvalue(low_price, -a1), p2))
# , p1); 


 gain = fold a1 = 0 to barsback 
 with p1
 do  max(
   (fold a2 = (a1 + 1) to (barsback )
    with p2
    do max( getvalue(high_price, -a2) - getvalue(low_price, -a1), p2))
 , p1); 


# high_price 
# low_price 

# do min(r, getvalue(low_price, -c));

lo = 0;


 lobn = fold d = 0 to barsback
 with s
 do if getvalue(low_price, -d) == lo then getvalue(bn, -d) else s;


# (hibn - xbn)
 hi = fold a = 0 to barsback
 with p
 do max(p, getvalue(high_price, -a));
 hibn = fold b = 0 to barsback 
 with q
 do if getvalue(high_price, -b) == hi then getvalue(bn, -b) else q;


 slope = (hi-lo)/(hibn-lobn);
} else {
 gain = gain[1];
 hibn = hibn[1];
 hi = hi[1];
 lobn = lobn[1];
 lo = lo[1];
 slope = slope[1];
}


#def gain2 = fold b2 = 0 to barsback 
# with p1
# do  max(
#   (fold a2 = (a1 + 1) to (barsback )
#    with p2
#    do max( getvalue(high_price, -a2) - getvalue(low_price, -a1), p2))
# , p1); 


input test3 = no;
addchartbubble(test3, high*1.001,
#high + "\n" +
#low + "\n" +
close
, color.white, yes);


addchartbubble(test3, low*0.999,
gain
, color.white, no);


addlabel(1, "Gain $ " + gain, color.green);


def line = if bn == 1 then na
 else if bn == hibn and high_price == hi then high_price
 else if bn == lobn and low_price == lo then low_price
 else if bn > max(hibn, lobn) then na
 else line[1] + slope;

plot z1 = line;
z1.setdefaultcolor(color.gray);

#addverticalline( bn == hibn or bn == lobn, "--", color.cyan);

# arrows on highest and lowest
plot zhi = if bn == hibn then high_price else na;
zhi.SetPaintingStrategy(PaintingStrategy.aRROW_down);
zhi.setlineWeight(2);
zhi.setdefaultcolor(color.white);

plot zlo = if bn == lobn then low_price else na;
zlo.SetPaintingStrategy(PaintingStrategy.ARROW_up);
zlo.setlineWeight(2);
zlo.setdefaultcolor(color.white);


def per = round(100*((hi-lo)*(sign(hibn-lobn)))/lo, 1);

#addlabel(1, "Hi $ " + hi + "   Lo $ " + lo, color.yellow);
#addlabel(1, "$" + (hi-lo)*(sign(hibn-lobn)), color.yellow);
#addlabel(1, per + " %", color.yellow);


addchartbubble(0, high*1.001,
bn + "\n" +
hi + "\n" +
hibn + "\n" +
lo + "\n" +
lobn + "\n" +
slope
, color.magenta, yes);

#
 
hmm i guess you could find the highest high/close, then make the lookback for the low only in between the window of between that high and 126 bars back? (Btw 126 is being used as 2 qtrs/6 months, not just random number)
but the highest price won't always be the top of the gain range
 
this is sloppy, but it finds the max gain in dollars.
it doesn't mark the low and high bars. that could be a future version


Code:
#highest_gain_x_bars_02

# only look at low to high, biggest gain


# ver 02b
#  chg to close, no low and high ( add inputs)
#  loop over every close (for a low)
#   from that close , loop over bars fater and find bn with biggest close to close diff


#https://usethinkscript.com/threads/largest-gain-range-since-uptrend.2418/#post-135315
#wtf_dude
#6
#I know this is absolutely and completely jacked, but I can't focus very well at all lately

# Can somebody please check this and see where the errors are? All I'm trying to do is mark the arrow to the highest % gain from the lowest low within the last 126 bars and have the label display how large that percentage gain is. Really appreciate it in advance.

def na = double.nan;
def bn = barnumber();

input barsback = 126;

input high_price = close;
input low_price = close;

# redo the code

# find the bar that is 126 bars before the last bar,
# find the bars with highest high and lowest low after 126 bar
# read prices from the highest and lowest
# hold those values to the last bar
# calculate a slope, and difference


# define a bar 126 bars before last bar
def x = (!isnan(close[-(barsback-1)]) and isnan(close[-barsback]));
input vertical_line_126bars_back = yes;
addverticalline(vertical_line_126bars_back and x, "   " + barsback + "  bars  back", color.cyan);

def xbn = if bn == 1 then 0
 else if x then bn
 else xbn[1];


def big = 99999;
def gain;
def hibn;
def hi;
def lobn;
def lo;
def slope;
if bn == 1 then {
 gain = 0;
 hibn = 0;
 hi = 0;
 lobn = 0;
 lo = 0;
 slope = 0;
} else if x then {

#  loop thru all close.(lows)
#  then loop thru all close(highs) after it, to find the biggest gain


# gain = fold a1 = 0 to barsback
# with p1
# do  max(
#   (fold a2 = (a1 + 1) to (barsback )
#    with p2
#    do max( getvalue(high_price, -a2) - getvalue(low_price, -a1), p2))
# , p1);


 gain = fold a1 = 0 to barsback
 with p1
 do  max(
   (fold a2 = (a1 + 1) to (barsback )
    with p2
    do max( getvalue(high_price, -a2) - getvalue(low_price, -a1), p2))
 , p1);


# high_price
# low_price

# do min(r, getvalue(low_price, -c));

lo = 0;


 lobn = fold d = 0 to barsback
 with s
 do if getvalue(low_price, -d) == lo then getvalue(bn, -d) else s;


# (hibn - xbn)
 hi = fold a = 0 to barsback
 with p
 do max(p, getvalue(high_price, -a));
 hibn = fold b = 0 to barsback
 with q
 do if getvalue(high_price, -b) == hi then getvalue(bn, -b) else q;


 slope = (hi-lo)/(hibn-lobn);
} else {
 gain = gain[1];
 hibn = hibn[1];
 hi = hi[1];
 lobn = lobn[1];
 lo = lo[1];
 slope = slope[1];
}


#def gain2 = fold b2 = 0 to barsback
# with p1
# do  max(
#   (fold a2 = (a1 + 1) to (barsback )
#    with p2
#    do max( getvalue(high_price, -a2) - getvalue(low_price, -a1), p2))
# , p1);


input test3 = no;
addchartbubble(test3, high*1.001,
#high + "\n" +
#low + "\n" +
close
, color.white, yes);


addchartbubble(test3, low*0.999,
gain
, color.white, no);


addlabel(1, "Gain $ " + gain, color.green);


def line = if bn == 1 then na
 else if bn == hibn and high_price == hi then high_price
 else if bn == lobn and low_price == lo then low_price
 else if bn > max(hibn, lobn) then na
 else line[1] + slope;

plot z1 = line;
z1.setdefaultcolor(color.gray);

#addverticalline( bn == hibn or bn == lobn, "--", color.cyan);

# arrows on highest and lowest
plot zhi = if bn == hibn then high_price else na;
zhi.SetPaintingStrategy(PaintingStrategy.aRROW_down);
zhi.setlineWeight(2);
zhi.setdefaultcolor(color.white);

plot zlo = if bn == lobn then low_price else na;
zlo.SetPaintingStrategy(PaintingStrategy.ARROW_up);
zlo.setlineWeight(2);
zlo.setdefaultcolor(color.white);


def per = round(100*((hi-lo)*(sign(hibn-lobn)))/lo, 1);

#addlabel(1, "Hi $ " + hi + "   Lo $ " + lo, color.yellow);
#addlabel(1, "$" + (hi-lo)*(sign(hibn-lobn)), color.yellow);
#addlabel(1, per + " %", color.yellow);


addchartbubble(0, high*1.001,
bn + "\n" +
hi + "\n" +
hibn + "\n" +
lo + "\n" +
lobn + "\n" +
slope
, color.magenta, yes);

#
BAM looks like you nailed it. The markers weren't nearly as important as just getting the result, I just needed to make sure it was checking the right spots. Found that if you just made it a lower indicator and plotted the gain you could make sure the gain wasn't chopping for one reason or another. Thank you so much for your hard work on this! Really appreciate it
 
this is sloppy, but it finds the max gain in dollars.
it doesn't mark the low and high bars. that could be a future version


Code:
#highest_gain_x_bars_02

# only look at low to high, biggest gain


# ver 02b
#  chg to close, no low and high ( add inputs)
#  loop over every close (for a low)
#   from that close , loop over bars fater and find bn with biggest close to close diff


#https://usethinkscript.com/threads/largest-gain-range-since-uptrend.2418/#post-135315
#wtf_dude
#6
#I know this is absolutely and completely jacked, but I can't focus very well at all lately

# Can somebody please check this and see where the errors are? All I'm trying to do is mark the arrow to the highest % gain from the lowest low within the last 126 bars and have the label display how large that percentage gain is. Really appreciate it in advance.

def na = double.nan;
def bn = barnumber();

input barsback = 126;

input high_price = close;
input low_price = close;

# redo the code

# find the bar that is 126 bars before the last bar,
# find the bars with highest high and lowest low after 126 bar
# read prices from the highest and lowest
# hold those values to the last bar
# calculate a slope, and difference


# define a bar 126 bars before last bar
def x = (!isnan(close[-(barsback-1)]) and isnan(close[-barsback]));
input vertical_line_126bars_back = yes;
addverticalline(vertical_line_126bars_back and x, "   " + barsback + "  bars  back", color.cyan);

def xbn = if bn == 1 then 0
 else if x then bn
 else xbn[1];


def big = 99999;
def gain;
def hibn;
def hi;
def lobn;
def lo;
def slope;
if bn == 1 then {
 gain = 0;
 hibn = 0;
 hi = 0;
 lobn = 0;
 lo = 0;
 slope = 0;
} else if x then {

#  loop thru all close.(lows)
#  then loop thru all close(highs) after it, to find the biggest gain


# gain = fold a1 = 0 to barsback
# with p1
# do  max(
#   (fold a2 = (a1 + 1) to (barsback )
#    with p2
#    do max( getvalue(high_price, -a2) - getvalue(low_price, -a1), p2))
# , p1);


 gain = fold a1 = 0 to barsback
 with p1
 do  max(
   (fold a2 = (a1 + 1) to (barsback )
    with p2
    do max( getvalue(high_price, -a2) - getvalue(low_price, -a1), p2))
 , p1);


# high_price
# low_price

# do min(r, getvalue(low_price, -c));

lo = 0;


 lobn = fold d = 0 to barsback
 with s
 do if getvalue(low_price, -d) == lo then getvalue(bn, -d) else s;


# (hibn - xbn)
 hi = fold a = 0 to barsback
 with p
 do max(p, getvalue(high_price, -a));
 hibn = fold b = 0 to barsback
 with q
 do if getvalue(high_price, -b) == hi then getvalue(bn, -b) else q;


 slope = (hi-lo)/(hibn-lobn);
} else {
 gain = gain[1];
 hibn = hibn[1];
 hi = hi[1];
 lobn = lobn[1];
 lo = lo[1];
 slope = slope[1];
}


#def gain2 = fold b2 = 0 to barsback
# with p1
# do  max(
#   (fold a2 = (a1 + 1) to (barsback )
#    with p2
#    do max( getvalue(high_price, -a2) - getvalue(low_price, -a1), p2))
# , p1);


input test3 = no;
addchartbubble(test3, high*1.001,
#high + "\n" +
#low + "\n" +
close
, color.white, yes);


addchartbubble(test3, low*0.999,
gain
, color.white, no);


addlabel(1, "Gain $ " + gain, color.green);


def line = if bn == 1 then na
 else if bn == hibn and high_price == hi then high_price
 else if bn == lobn and low_price == lo then low_price
 else if bn > max(hibn, lobn) then na
 else line[1] + slope;

plot z1 = line;
z1.setdefaultcolor(color.gray);

#addverticalline( bn == hibn or bn == lobn, "--", color.cyan);

# arrows on highest and lowest
plot zhi = if bn == hibn then high_price else na;
zhi.SetPaintingStrategy(PaintingStrategy.aRROW_down);
zhi.setlineWeight(2);
zhi.setdefaultcolor(color.white);

plot zlo = if bn == lobn then low_price else na;
zlo.SetPaintingStrategy(PaintingStrategy.ARROW_up);
zlo.setlineWeight(2);
zlo.setdefaultcolor(color.white);


def per = round(100*((hi-lo)*(sign(hibn-lobn)))/lo, 1);

#addlabel(1, "Hi $ " + hi + "   Lo $ " + lo, color.yellow);
#addlabel(1, "$" + (hi-lo)*(sign(hibn-lobn)), color.yellow);
#addlabel(1, per + " %", color.yellow);


addchartbubble(0, high*1.001,
bn + "\n" +
hi + "\n" +
hibn + "\n" +
lo + "\n" +
lobn + "\n" +
slope
, color.magenta, yes);

#
I added the following two lines to get the percent change:

def percent_change = round(gain/low_price);
addLabel(yes, "% change over " + barsback + " days:" + percent_change * 100 + "%", color.yellow);

I am able to see an arrow down at the high price but not the arrow up at the low price.
Is it possible to make the price % gain a watchlist column? That would be very useful for sorting.
 
Last edited:
I added the following two lines to get the percent change:

def percent_change = round(gain/low_price);
addLabel(yes, "% change over " + barsback + " days:" + percent_change * 100 + "%", color.yellow);

I am able to see an arrow down at the high price but not the arrow up at the low price.
Is it possible to make the price % gain a watchlist column? That would be very useful for sorting.

you changed your post.

here is a chart study to find the % change , from a date to the highest high after the date.
( set chart to day)

Code:
#chg_from_date_to_high

#https://usethinkscript.com/threads/largest-gain-range-since-uptrend.2418/#post-139855
#Amarante  #17
# I would like to compare the price % change from the beginning of November 2023 to the highest high up until now. The % gain is more helpful so that I can compare stock performance over the last 5 months. I removed the # from addlabel(1, per + " %", color.yellow);
# but this gave me a huge number (922,337, 203,685,477,630 %). Can you please update it for percent change?

def na = Double.NaN;
def bn = BarNumber();
def big = 99999;

input start_date = 20231101;
def d = GetYYYYMMDD();
def startbar = d[1] < start_date and d >= start_date;

def startbn = if bn == 1 then 0
 else if startbar then bn
 else startbn[1];
def startbn2 = highestall(startbn);

def startprice = if bn == 1 then 0
 else if startbar then close
 else startprice[1];

def hihi = if (bn == 1) then 0
 else if bn > startbn2 then Max(hihi[1], high)
 else hihi[1];

def hiprice = highestall(hihi);

def hihibn = if bn == 1 then big
 else if hiprice == high and bn > startbn2 and  hihibn [1] == big then bn
 else hihibn[1];

def hibar = if bn == hihibn then 1 else 0;

def hidate = if bn == hihibn then d else hidate[1];

def spanbars = if bn == 1 then 0
 else if hiprice == high then (hihibn-startbn2)
 else spanbars[1];

addverticalline(startbar, asprice(start_date), color.cyan);
addverticalline(hibar, asprice(hidate), color.yellow);

def diffprice = (hiprice-startprice);
def diffper = round(100*diffprice/startprice,1);

addlabel(1, "change from " + asprice(start_date) + " to " + asprice(hidate), color.yellow);
addlabel(1, spanbars + " bars", color.yellow);
addlabel(1, " $" + diffprice, color.yellow);
addlabel(1, diffper + " %", color.yellow);


input horz_lines = yes;
plot z1 = if isnan(close) then na else if startprice > 0 then startprice else na;
plot z2 = if isnan(close) then na else if bn >= hihibn then hiprice else na;
z1.setdefaultcolor(color.light_gray);
z2.setdefaultcolor(color.light_gray);


addchartbubble(0, low,
hihi + "\n" +
hiprice + "\n" +
bn + "\n" +
hihibn + "\n" 
, color.yellow, no);
#
 

Attachments

  • img1.JPG
    img1.JPG
    114.3 KB · Views: 155
you changed your post.

here is a chart study to find the % change , from a date to the highest high after the date.
( set chart to day)

Code:
#chg_from_date_to_high

#https://usethinkscript.com/threads/largest-gain-range-since-uptrend.2418/#post-139855
#Amarante  #17
# I would like to compare the price % change from the beginning of November 2023 to the highest high up until now. The % gain is more helpful so that I can compare stock performance over the last 5 months. I removed the # from addlabel(1, per + " %", color.yellow);
# but this gave me a huge number (922,337, 203,685,477,630 %). Can you please update it for percent change?

def na = Double.NaN;
def bn = BarNumber();
def big = 99999;

input start_date = 20231101;
def d = GetYYYYMMDD();
def startbar = d[1] < start_date and d >= start_date;

def startbn = if bn == 1 then 0
 else if startbar then bn
 else startbn[1];
def startbn2 = highestall(startbn);

def startprice = if bn == 1 then 0
 else if startbar then close
 else startprice[1];

def hihi = if (bn == 1) then 0
 else if bn > startbn2 then Max(hihi[1], high)
 else hihi[1];

def hiprice = highestall(hihi);

def hihibn = if bn == 1 then big
 else if hiprice == high and bn > startbn2 and  hihibn [1] == big then bn
 else hihibn[1];

def hibar = if bn == hihibn then 1 else 0;

def hidate = if bn == hihibn then d else hidate[1];

def spanbars = if bn == 1 then 0
 else if hiprice == high then (hihibn-startbn2)
 else spanbars[1];

addverticalline(startbar, asprice(start_date), color.cyan);
addverticalline(hibar, asprice(hidate), color.yellow);

def diffprice = (hiprice-startprice);
def diffper = round(100*diffprice/startprice,1);

addlabel(1, "change from " + asprice(start_date) + " to " + asprice(hidate), color.yellow);
addlabel(1, spanbars + " bars", color.yellow);
addlabel(1, " $" + diffprice, color.yellow);
addlabel(1, diffper + " %", color.yellow);


input horz_lines = yes;
plot z1 = if isnan(close) then na else if startprice > 0 then startprice else na;
plot z2 = if isnan(close) then na else if bn >= hihibn then hiprice else na;
z1.setdefaultcolor(color.light_gray);
z2.setdefaultcolor(color.light_gray);


addchartbubble(0, low,
hihi + "\n" +
hiprice + "\n" +
bn + "\n" +
hihibn + "\n"
, color.yellow, no);
#
Thank you halcyonguy. Is it possible to make the percent change a watchlist column?
 

Similar threads

Not the exact question you're looking for?

Start a new thread and receive assistance from our community.

87k+ Posts
482 Online
Create Post

Similar threads

Similar threads

The Market Trading Game Changer

Join 2,500+ subscribers inside the useThinkScript VIP Membership Club
  • Exclusive indicators
  • Proven strategies & setups
  • Private Discord community
  • ‘Buy The Dip’ signal alerts
  • Exclusive members-only content
  • Add-ons and resources
  • 1 full year of unlimited support

Frequently Asked Questions

What is useThinkScript?

useThinkScript is the #1 community of stock market investors using indicators and other tools to power their trading strategies. Traders of all skill levels use our forums to learn about scripting and indicators, help each other, and discover new ways to gain an edge in the markets.

How do I get started?

We get it. Our forum can be intimidating, if not overwhelming. With thousands of topics, tens of thousands of posts, our community has created an incredibly deep knowledge base for stock traders. No one can ever exhaust every resource provided on our site.

If you are new, or just looking for guidance, here are some helpful links to get you started.

What are the benefits of VIP Membership?
VIP members get exclusive access to these proven and tested premium indicators: Buy the Dip, Advanced Market Moves 2.0, Take Profit, and Volatility Trading Range. In addition, VIP members get access to over 50 VIP-only custom indicators, add-ons, and strategies, private VIP-only forums, private Discord channel to discuss trades and strategies in real-time, customer support, trade alerts, and much more. Learn all about VIP membership here.
How can I access the premium indicators?
To access the premium indicators, which are plug and play ready, sign up for VIP membership here.
Back
Top