Would it be possible to add green and red arrows to the respective crossovers (whether that's in addition to or instead of the labels)?
The problem with labels is that they don't stay on the chart and therefore lose out on the history of the data.
Yeah, only because the two before that are more meant to show you the raw numbers. With the third, it's imitating a MACD in a sense using values from the second indicator. But without exponential smoothing, the changes from one bar to the next were too erratic to really get any useful information out of it. The fast line of the indicator would fluctuate dramatically and cross below and above the signal line too often, giving far too many signals that are mostly unimportant making it difficult to discern anything of significant importance between the signals. I can always provide the code if you want to add exponential smoothing to the other two indicators if that's why you're asking. That's not a problem, I just personally don't think it's all that important to include it with the first two indicators because they're meant to show the raw volume as percentages of the candle. The raw numbers are a more important aspect with those particular indicators, in my opinion. Doesn't mean I can't include that as an option by any means, just giving you my two cents on it, but who knows it's always possible that someone sees something of more significant importance that I may have not thought about or overlooked.
Would it be possible to add green and red arrows to the respective crossovers (whether that's in addition to or instead of the labels)?
The problem with labels is that they don't stay on the chart and therefore lose out on the history of the data.
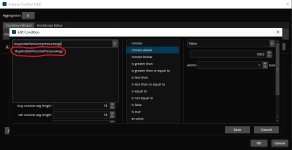
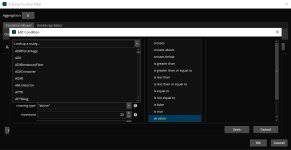
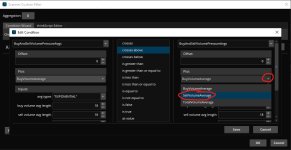
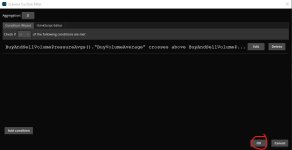
Are you talking about the Buy And Sell Volume Pressure Averages or the BSVPACD or both? Either way, I'm sure I can implement it in either one. However, unless someone is able to answer for me whether it's possible to have an indicator display both on the chart and below the chart and how to do that, I'd have to provide a copy of either indicator that doesn't display on the bottom and only displays the arrows on the price chart itself, if that's what you're intending to accomplish.
First, I'll start by saying I think someone else has posted a similar base indicator for the indicators I'm about to post here, but I didn't look into the details of their calculations.
I first started by creating an indicator that essentially separates buy volume pressure from sell volume pressure. The calculation is as follows:
Edit: Below, I did my best to draw up a visual description using paint 3D of how my calculations of "Buying And Selling Volume Pressure" work. Also, I made the realization that I forgot to include "/ (high - low)" before "* volume" in the visual descriptions. Please forgive me for that for now until I update the image.
The Buy Volume Pressure is always a positive number while the Sell Volume Pressure is always a negative number. I simply call this indicator "Buy And Sell Volume Pressure" since it outputs a percentage of the volume as "Buying" or "Selling" Pressure. It also includes labels for the total volume, total buy volume pressure, and total sell volume pressure. Here's the code for the Buy And Sell Volume Pressure indicator:
Edit: Because someone asked for the percentages of buying and selling volume pressure for another indicator included in this thread, I've decided to include labels for that in this indicator as well (the code below has been updated):
The next indicator I created is a two average indicator, anaverage for buy volume pressure and an average for sell volume pressure. The average types and lengths are adjustable. In this case, I used the absolute value rather than the negative number output of the sell volume pressure for the sell volume pressure average. When the buy volume pressure average crosses above the sell volume pressure average it indicates that buy volume pressure is increasing at a faster rate than sell volume pressure and vice versa, or you could say if the buy volume pressure average crosses below the sell volume pressure average buy volume pressure is decreasing at a faster rate than sell volume pressure and vice versa. Here's the code for the Buy And Sell Volume Pressure Averages indicator:
Last but certainly not least, I came up with a Buy And Sell Volume Pressure Average Convergence Divergence(BSVPACD) indicator. This indicator works and looks very similar to the MACD (Moving Average Convergence Divergence) indicator, however it is based on the Buy And Sell Volume Pressure Averages, can give slightly earlier signals than the MACD indicator, and divergences are more pronounced than on the MACD indicator (I honestly don't know if this has to do with the particular default settings I picked for it). What this indicator does is it calculates the difference between the Buy Volume Pressure Average and the Sell Volume Pressure Average, plots that difference, then plots an average of the difference between the two averages (the signal line), and finally plots the difference between the difference of the Buy Volume Pressure and Sell Volume Pressure Averages and the signal line as a histogram just like MACD. The average types and lengths are all adjustable. I've also included an option that exponentially smooths the difference between the Buy And Sell Volume Pressure Averages that's toggled on by default due to the fact that the change in the difference tends to be somewhat erratic. You can also change the smoothing factor which is set to 3 by default. Here's the code for the BSVPACD indicator:
A screenshot of the indicators below a price chart of the SPY (from top to bottom, Buy And Sell Volume Pressure, Buy And Sell Volume Pressure Averages, and BSVPACD): View attachment 3239
A screenshot of the BSVPACD compared to the MACD (MACD up top, BSVPACD on bottom): View attachment 3240
Is anyone able to help me with this: I'd like to edit the script so that the blue line (buy vol) turns green when going up and red when going down, regardless of its relation to the sell vol line? Any help with this is appreciated.
Again, this is not a representation of how many people are buying and selling, for every buyer there is a seller. When you look at total volume, that's how many shares were boughtandsold as you can't have a buyer without a seller. But, to answer your question, I've added what you're looking for which is a percentage of buying pressure vs a percentage of selling pressure. I've added the labels for that in the code below:
Code:
input smoothingLength = 3;
input paintBars = yes;


def buyvol = Round(((high - open) + (close - low)) / 2 / (high - low) * volume(), 0);
def sellvol = Round(((low - open) + (close - high)) / 2 / (high - low) * volume(), 0);
def haclose = (open + high + low + close) / 4;
def haopen = CompoundValue(1, (haopen[1] + haclose[1]) / 2, (open[1] + close[1]) / 2);
def diff = haclose - haopen;
def Avg = Average(diff, smoothingLength);
def buyvolper = buyvol / volume() * 100;
def sellvolper = absValue(sellvol) / volume() * 100;

plot TUBU = close > open and diff > 0;
plot TUBD = close < open and diff > 0;
plot TDBD = close < open and diff < 0;
plot TDBU = close > open and diff < 0;

TUBU.hide();
TUBD.hide();
TDBD.hide();
TDBU.hide();

DefineGlobalColor("TUBU", Color.GREEN);
DefineGlobalColor("TUBD", Color.DARK_RED);
DefineGlobalColor("TDBD", Color.RED);
DefineGlobalColor("TDBU", Color.DARK_GREEN);

AssignPriceColor(if !paintBars then Color.CURRENT
else if TUBU then GlobalColor("TUBU")
else if TUBD then GlobalColor("TUBD")
else if TDBD then GlobalColor("TDBD")
else if TDBU then GlobalColor("TDBU")
else Color.Current);
addLabel(yes, "Total Volume: " + volume(), color.LIGHT_GRAY);
addLabel(yes, "Buy Volume: " + buyvol, color.GREEN);
addLabel(yes, "Sell Volume: " + absValue(sellvol), color.RED);
addLabel(yes, "BVP%: " + buyvolper, color.GREEN);
addLabel(yes, "SVP%: " + sellvolper, color.RED);
BVP% = Buying Volume Pressure Percentage.
SVP% = Selling Volume Pressure Percentage.
Note that these will fluctuate when a candle is in progress as the percentage changes based on the candle structure.
@littletamla While you could use the same Chart for both Stocks and Options, a separate Chart tends to work better as it can be customized for Options instead of Stocks...
One thing to keep in mind is that as an Option gets OTM it would skew some of the indicators that benefit from the continual data flow for Stocks... On top of that, you might want a different set of indicators and Chart Labels for Option contracts...
Because I primarily scalp SPY Options these days I tend to keep a Chart for the Call I am actively monitoring as well as another identical Chart for the Put I am monitoring... My Chart labels and indicators, few as there may be, are for Option performance... For example, I want to know the current ATR and Delta of each contract... Below is the current Chart layout I am using for Options which is a two panel Chart Grid... Neither the BollingerBands nor VWAP are needed but I like having them... As you can see, I also have a label for the underlying symbols current price... I like having my custom lower OptionDelta indicator for historical purposes, which displays AbsValue() for both Calls and Puts... I also utilize several different OBO Brackets with varying Limit and StopLoss that I can select from, again, based on current market conditions...
All that said, most of my Option scalps are made from a Flexible Grid Chart that displays the underlying on the left and only Active Trader ladders for my preselected Call and Put stacked on the right... The image below shows just one of my scalping layouts... Either of the Option panels can be maximized and a Chart displayed if desired... I like flexibility...
Most of my trading actually happens from my Main Panel on its Flexible Grid... I can update my Call and Put selections at any time from the Option Hacker driven Option Watchlist on the lower left to maintain my desired Price and Delta range for the current market by Right-Clicking on an Option entry and sending it to the corresponding Numbered/Colored Option AT panel... See the image below...
Most of this information has been shared elsewhere in these forums, as well as other setups I have used over the years... Again, scalping SPY Options is my main endeavor and this system works well for that purpose...I hope you find this information helpful...
@rad14733 I was looking for rad buy sell volume pressure everywhere on this website but I failed to found any of it. can you please share the code for that indicator? thank you.
@rad14733 I was looking for rad buy sell volume pressure everywhere on this website but I failed to found any of it. can you please share the code for that indicator? thank you.
useThinkScript is the #1 community of stock market investors using indicators and other tools to power their trading strategies. Traders of all skill levels use our forums to learn about scripting and indicators, help each other, and discover new ways to gain an edge in the markets.
How do I get started?
We get it. Our forum can be intimidating, if not overwhelming. With thousands of topics, tens of thousands of posts, our community has created an incredibly deep knowledge base for stock traders. No one can ever exhaust every resource provided on our site.
If you are new, or just looking for guidance, here are some helpful links to get you started.
VIP members get exclusive access to these proven and tested premium indicators: Buy the Dip, Advanced Market Moves 2.0, Take Profit, and Volatility Trading Range. In addition, VIP members get access to over 50 VIP-only custom indicators, add-ons, and strategies, private VIP-only forums, private Discord channel to discuss trades and strategies in real-time, customer support, trade alerts, and much more. Learn all about VIP membership here.
How can I access the premium indicators?
To access the premium indicators, which are plug and play ready, sign up for VIP membership here.


 HOT ZONE - RSI with IV Percentile: Buy Stock or Sell Put Options Signal For ThinkOrSwim