Here is the IWO Turning Point indicator for ThinkorSwim. You can trade options with it. Usage and trading notes can be found in the code below.

16:08 FrankB3: Received e-mail from a trader, given me: IWO Turning Point Indicator (TPI) : tried to make a header and notes, best I can. http://tos.mx/8fm8ji
Code:
# IWO Turning Point Indicator BY STEVEN PLACE (12/5/18)
#The TPI is a way to quantify the rate of change of a stock or market.
#It gives you specific levels that shows the probabilities of a move in a stock. The TPI has a few components.
#The first is the “Rolling” line. This shows us the rolling returns of a stock for whatever timeframe we want.
#The default setting is a period of 10 trading days, which is the equivalent of 2 weeks.
#So, for an example, if a stock is a reading of 4.7%, that means it has rallied 4.7% over 10 trading days.
#The rest of the lines are volatility bands, using a 60-day sample. 60 days is about 3 calendar months.
#The indicator looks back at all of the rolling returns data, and calculates the standard deviations.
#This is important because it gives us context for a stock.
#As an example, you can say “oh wow, this stock has moved big.”
#But the other questions to ask are…
#1. How big? 2. Has it happened in the past? 3. What kind of moves should we expect?
#The volatility bands are a guide.
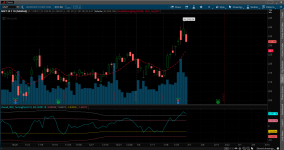
#In the chart above, the upper volatility band is at 7.55%.
#What does this mean?
#It means we should expect, about 95% of the time, for the stock to not rally 7.5%.
#And with options trading, it’s just as important to know where a stock isn’t headed just as much as to where it is.
#The sweet spot is at 30 days to expiration.
#If you can capture 50% of maximum credit with 30 days left to expiration, that's a good exit.
#If you can capture 20% of maximum credit after being in the trade for only 10 days, that's also a good exit.
#The goal here is to maximize returns and minimizing time in the market. WHAT TIMEFRAMES TO USE
#There are few timeframes that I follow. Each has its own reasoning, but it basically comes down to how much a stock has moved…
#… in the past week
#… in the past two weeks
#… in the past month
#… in the past 3 months
#Your trading style and strategy choice will dictate what kind of timeframe you need to use.
#Here are the inputs for each timeframe:
#One week (5, 60)
#Two weeks (10, 60)
#One Month (20, 80)
#Three Months (60, 252)
#Because we only look at trading days not calendar days, our numbers are shortened.
#Oh, and that “252” is because there are 252 trading days in a year. Neat, right? HOW TO TRADE WITH THE TPI:
#The TPI is an indicator best suited with looking for reversion-based moves.
#Simply put, you wait for an expansion in volatility and then fade any further moves from that.
#Let’s take an example.
#A stock is trading in a long-term uptrend with a closing price of 155, then over a 10-day period it moves -8%. That’s below its 2nd standard deviation band.
#Its closing price is 142.
#Now the odds of seeing downside continuation are very low, especially within the next 10 days. So, you can look to structure a bull put spread, an option strategy that profits as long as the stock doesn’t move below a certain strike price.
#The cool part? You can use the TPI to figure out where you should place that strike price.
#So you can move the timeframe of the TPI out to 20 days, and then you get this chart:
#The lower band shows -6%, which means that based on the past 3 months volatility the odds of seeing a selloff greater than that is around 5%.
#And given the fact that the stock is already deeply oversold, the odds are further in your favor.
#Put it all together.
##The stock is statistically oversold, with a closing price of $142 per share.
#6% off that current price is around 133.
#So you can sell the 130/125 credit spread for around 0.65.
#With a max reward of 65 and a risk of 435, that puts your return on risk at 14%.
#Do the math!
#The reward relative to the risk is much higher than the statistical odds!
declare lower;input length = 10;input stdLength = 60;plot rolling = (close - close[length])*100/close[length];plot updev = StDev(rolling, stdLength);plot twoupdev = 2*StDev(rolling, stdLength);plot downdev = -StDev(rolling, stdLength);plot twodowndev = -2*StDev(rolling, stdLength);