-
Happy Father's Day! For a limited time: take $50 off VIP Membership with code DAD50 Claim Discount

You should upgrade or use an alternative browser.
IPO stocks
- Thread starter stock2020
- Start date
https://usethinkscript.com/threads/ipo-stocks.4379/#post-40322I want to create a study to use in the stock scanner that shows stocks trading for less than 200 days (they don't have a 200 moving average yet).
My attempt to code this shows stocks that have just started trading for 200 days (DOCS for instance), but that's not what I'm looking for. Any help would be greatly appreciated!Code:plot Data = compoundvalue(1, if IsNan(close[200]) then 1 else 0,close);
Join useThinkScript to post your question to a community of 21,000+ developers and traders.
Thanks, so I guess it is not possible.Moved you to this thread. Members have provided what they have used.
tradephoric
New member
Ticker CYN would be a good example as it's a recent IPO that just passed the 180 day mark.
I'm currently using the following code to highlight the first 90 bars Red after an IPO begins trading. But the problem is it highlights the first 90 bars (NOT the first 90 days). Any suggestions?
def test = Open()[0];
AddCloud(if highest(test, 1) > 0 then Double.POSITIVE_INFINITY else Double.NaN, if Highest(test, 1) > 0 then Double.NEGATIVE_INFINITY else Double.NaN, Color.RED, Color.GREEN);
AddCloud(if highest(test, 90) > 0 then Double.POSITIVE_INFINITY else Double.NaN, if Highest(test, 90) > 0 then Double.NEGATIVE_INFINITY else Double.NaN, Color.BLUE, Color.CURRENT);
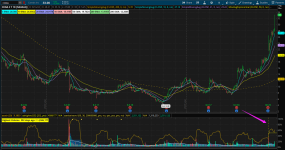
A visual of what I'm looking for. First 90 days shaded red, next 90 days shaded blue, then no shading after 180 days.
I simplified the code a little. I'm still trying to figure out a way to highlight the first 90 days red as opposed to the first 90 bars though. Any ideas?
AddCloud(if barnumber()<=90 then Double.POSITIVE_INFINITY else Double.NaN,  Double.NEGATIVE_INFINITY, Color.RED, Color.RED);
AddCloud(if between(barnumber(), 90, 180) then Double.POSITIVE_INFINITY else Double.NaN,  Double.NEGATIVE_INFINITY, Color.BLUE, Color.BLUE);
I created this code that highlights a chart red the first 90 bars after an IPO begins trading. However, I really want the code to highlight the first 90 trading days (and NOT just the first 90 bars). Any ideas how to tweak this code?
AddCloud(if barnumber()<=90 then Double.POSITIVE_INFINITY else Double.NaN, Double.NEGATIVE_INFINITY, Color.RED, Color.RED);Currently, there is no identifications of "IPO".Hi,
Is there a way to find the lowest and highest daily values of any stock since the beginning of its trading period (IPO)?
I tried using a the Lowest(Low, standard input lookback period) but this doesn't work and returns N/A.
Appreciate any help.
@stock2020 @tradephoricTOS built in scanner - filtering based on IPO date
How can I add a filter to a scanner for including only companies that have been trading for at least X years?
Thanks
There is no simple method to identify an IPO.
This thread discusses the suggestions of how to begin your coding quest in attempts to identify IPOs
 Ruby:
Ruby:def ymd = GetYYYYMMDD(); def bn = BarNumber(); def hd = GetMaxValueOffset(high, 252); def begindate = if bn == HighestAll(bn - hd) then ymd else begindate[1]; input days = 90; def enddate = if bn == HighestAll(bn - hd) + days then ymd else enddate[1]; input showlabel = yes; AddLabel(showlabel, " Cloud Range : " + AsPrice(begindate) + " - " + AsPrice(enddate)); input showverticalline = yes; AddVerticalLine(showverticalline and ymd == begindate, ""); AddVerticalLine(showverticalline and ymd == enddate, ""); DefineGlobalColor("Range", Color.RED); input showcloud = yes; AddCloud(if showcloud and Between(bn, HighestAll(bn - hd), HighestAll(bn - hd) + 90) then Double.POSITIVE_INFINITY else Double.NaN, Double.NEGATIVE_INFINITY, GlobalColor("Range"), GlobalColor("Range"));
Def Days; Def Date;
    If BarNumber() == 1 {
        Date = getyYYYMMDD();
        Days = highestall(daysFromDate(Date));
    } else {
        Date = Date[1];
        Days = Days[1];
    }
;
Def Days90 =
    DaysFromDate(Date) <= 90;
;
Def Days200 =
    Days <= 200;
;
AddCloud(
    if Days90 and Days200
        then Double.POSITIVE_INFINITY
        else Double.NaN,
    Double.NEGATIVE_INFINITY,
    Color.LIGHT_RED
);Since the lockup period ends, I don't want to just scan for x days since IPO. I want to scan for any upcoming expiration of lockup period within x number of days?
or is this info available easily somewhere else?
The ToS data feeds do not have expiration of lockup period information available to filter on.Is there a way to scan for upcoming end of IPO lockup period?
Since the lockup period ends, I don't want to just scan for x days since IPO. I want to scan for any upcoming expiration of lockup period within x number of days?
or is this info available easily somewhere else?
No new ideas. But your post was moved here as this thread has everything that has been discussed on this forum on this topicI would also like to find a script that will identify stocks with less than 252 trading days. Any new ideas on this topic?
shakib3585
Active member
I am trying to work with a scan filter in month aggregation mentioned in the code. However, I see no stocks were scanned using this criteria. Please help. Thank you
def d = isnaN(open [1]);

plot scan = d;Hello,
Is there a function that can output the days a stock traded since IPO?
Thanks
Well, first you would have to identify IPO stocks.
Read here about the trials and tribulations related to IPO:
https://usethinkscript.com/threads/ipo-stocks.4379/
It sounds like you are attempting to use barnumber function to find an IPO.I am trying in the following way on a daily aggregation to track IPOs, but it seems not to be working. Can you please suggest @Joshua
Code:def a = isnan(open[1])==1; plot scan = a;
@Joshua provided you with the syntax that you need.
You need to stop leaving barnumber out of your code.
While the following post does not do what you want; it does provide an example of using barnumber to identify IPOs:
https://usethinkscript.com/threads/ipo-stocks.4379/page-3#post-98927
Please read through this thread, to get a better understanding of the trials and tribulations of finding IPOs.
it works on the chart, try to scan, not workable.See if this helps. This is a workaround some of thinkscript's limitations when dealing with symbols opened less than the 'barsago' days. As mentioned, there may be simpler solutions, but this may be what you are requesting. The attached chart shows the same study in both the upper and lower panes.
View attachment 2214Code:#Example Highest Volume within Last barsago #Usethinkscript request #Workaround to handle charts with less than barsago input bars #Sleepyz #Use at least on a 2 YEAR DAILY CHART input barsago = 252; input showlabel = yes; def lastbar = if IsNaN(close[-1]) and !IsNaN(close) then BarNumber() else Double.NaN; def range = CompoundValue(1, if Between(BarNumber(), HighestAll(lastbar) - barsago, HighestAll(lastbar)) then 1 else 0, 1); #Highest Volume on a chart with more bars than barsago def vol = if range[1] == 0 and range == 1 then volume else if volume > vol[1] then volume else vol[1]; def volext = if BarNumber() > HighestAll(lastbar) then volext[1] else vol; def volb = if range == 1 and volume == vol then BarNumber() else Double.NaN; plot v252_end = if HighestAll(lastbar) > barsago and BarNumber() >= HighestAll(volb) then volext else Double.NaN; v252_end.setdefaultColor(color.yellow); v252_end.setpaintingStrategy(paintingStrategy.HORIZONTAL); #Highest Volume on a chart with less bars than barsago def r = if HighestAll(lastbar) < barsago then 1 else 0; def volh = if BarNumber() == 1 and !IsNaN(range) then volume else if volume > volh[1] then volume else volh[1]; def volhext = if BarNumber() > HighestAll(lastbar) then volhext[1] else volh; def volb1 = if volume == volh then barnumber() else Double.NaN; plot v1_end = if isnan(r) or r then volhext else double.nan; v1_end.setdefaultColor(color.yellow); v1_end.setpaintingStrategy(paintingStrategy.HORIZONTAL); AddLabel(showlabel, "Highest Volume" + (if r==1 then " Less than " else " ") + barsago + " days ago == " + (if r==1 then volh else vol), Color.YELLOW); addverticalLine(if r==1 then barnumber()==highestall(volb1) else barnumber()==highestall(volb),"",color.yellow);
Attachments
it works on the chart, try to scan, not workable.
You are correct. The HighestAll() function is calculated from the number of bars assigned to the timeframe on the CHART.
There is no way for the scanner to calculate
"the number of bars assigned to the timeframe on the CHART"
| Thread starter | Similar threads | Forum | Replies | Date |
|---|---|---|---|---|
| P | Trailing stop backtesting long stocks | Questions | 1 | |
| B | Need Help to develop a tick indicator for MAG7 stocks | Questions | 23 | |
| F | Scanner to find out stocks move out of range | Questions | 1 | |
| S | stocks that have gone up x of the last y days | Questions | 6 | |
| D | Custom Filter for scan that excludes Stocks that had recent Earnings | Questions | 2 |
Similar threads
-
-
-
-
-
Custom Filter for scan that excludes Stocks that had recent Earnings
- Started by defset17
- Replies: 2
Not the exact question you're looking for?
Start a new thread and receive assistance from our community.
Similar threads
-
-
-
-
-
Custom Filter for scan that excludes Stocks that had recent Earnings
- Started by defset17
- Replies: 2
Similar threads
-
-
-
-
-
Custom Filter for scan that excludes Stocks that had recent Earnings
- Started by defset17
- Replies: 2
The Market Trading Game Changer
- Exclusive indicators
- Proven strategies & setups
- Private Discord community
- ‘Buy The Dip’ signal alerts
- Exclusive members-only content
- Add-ons and resources
- 1 full year of unlimited support
Frequently Asked Questions
useThinkScript is the #1 community of stock market investors using indicators and other tools to power their trading strategies. Traders of all skill levels use our forums to learn about scripting and indicators, help each other, and discover new ways to gain an edge in the markets.
We get it. Our forum can be intimidating, if not overwhelming. With thousands of topics, tens of thousands of posts, our community has created an incredibly deep knowledge base for stock traders. No one can ever exhaust every resource provided on our site.
If you are new, or just looking for guidance, here are some helpful links to get you started.
- The most viewed thread:
https://usethinkscript.com/threads/repainting-trend-reversal-for-thinkorswim.183/ - Our most popular indicator:
https://usethinkscript.com/threads/buy-the-dip-indicator-for-thinkorswim.3553/ - Answers to frequently asked questions:
https://usethinkscript.com/threads/answers-to-commonly-asked-questions.6006/