Hi, i'm new here. I've tried searching but had no luck.
Can someone help me create a script that can measure the intraday swing high and low (preferably in points, ticks works too)?
I'm not a coder, so I tried copying and pasting stuff, but not getting what I want. This is a start (from Ben's anchored VWAP), I changed n=4
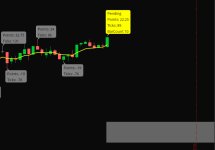
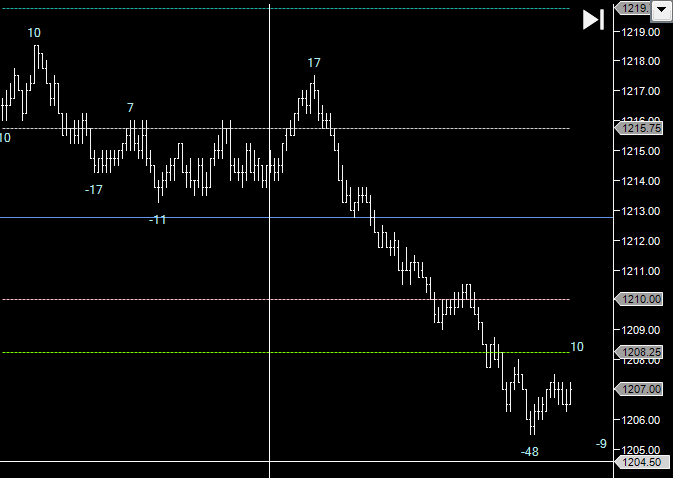
But I was wondering if it's possible to change the arrows to the number of ticks or points it moved from the swing high or low, like this image?
I would like to know the points it moved without having to draw a trendline to count.
Here is the image of what I would like to look like:
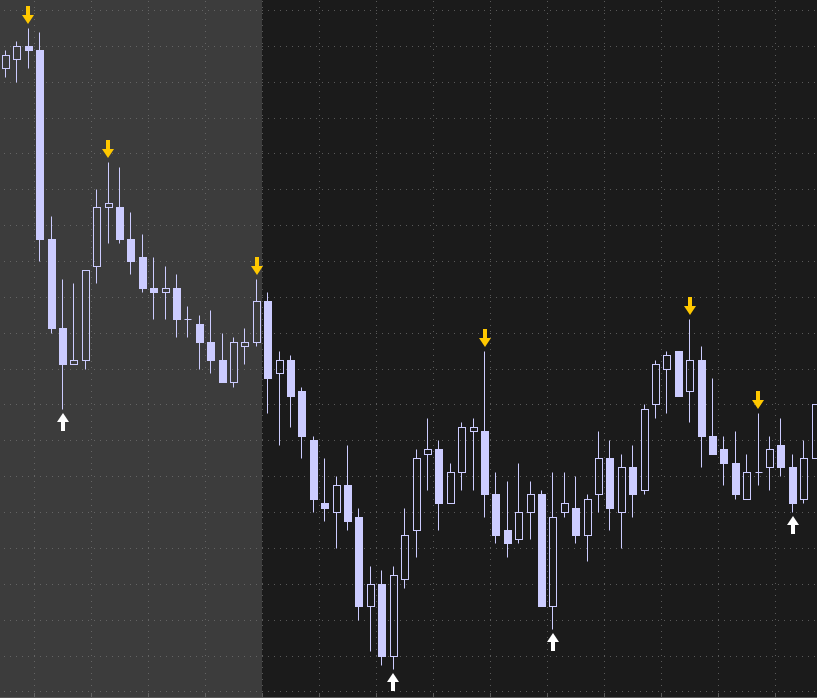
and this is what I have so far:
#hint n: Lookback period for finding swing highs, lows.
input n = 4;
#hint ticks: Offset High/Low VWAP lines by this number of ticks.
input ticks = 2.0;
def bnOK = barNumber() > n;
def isHigher = fold i = 1 to n + 1 with p = 1
while p do high > GetValue(high, -i);
def HH = if bnOK and isHigher
and high == Highest(high, n)
then high else Double.NaN;
def isLower = fold j = 1 to n + 1 with q = 1
while q do low < GetValue(low, -j);
def LL = if bnOK and isLower
and low == Lowest(low, n)
then low else Double.NaN;
def PivH = if HH > 0 then HH else Double.NaN;
def PivL = if LL > 0 then LL else Double.NaN;
plot Up = !isNaN(PivL);
Up.SetPaintingStrategy(PaintingStrategy.BOOLEAN_ARROW_UP);
Up.SetLineWeight(3);
Up.SetDefaultColor(Color.WHITE);
plot Dn = !isNaN(PivH);
Dn.SetPaintingStrategy(PaintingStrategy.BOOLEAN_ARROW_DOWN);
Dn.SetLineWeight(3);
Dn.SetDefaultColor(Color.ORANGE);
Can someone help me create a script that can measure the intraday swing high and low (preferably in points, ticks works too)?
I'm not a coder, so I tried copying and pasting stuff, but not getting what I want. This is a start (from Ben's anchored VWAP), I changed n=4
But I was wondering if it's possible to change the arrows to the number of ticks or points it moved from the swing high or low, like this image?
I would like to know the points it moved without having to draw a trendline to count.
Here is the image of what I would like to look like:
and this is what I have so far:
#hint n: Lookback period for finding swing highs, lows.
input n = 4;
#hint ticks: Offset High/Low VWAP lines by this number of ticks.
input ticks = 2.0;
def bnOK = barNumber() > n;
def isHigher = fold i = 1 to n + 1 with p = 1
while p do high > GetValue(high, -i);
def HH = if bnOK and isHigher
and high == Highest(high, n)
then high else Double.NaN;
def isLower = fold j = 1 to n + 1 with q = 1
while q do low < GetValue(low, -j);
def LL = if bnOK and isLower
and low == Lowest(low, n)
then low else Double.NaN;
def PivH = if HH > 0 then HH else Double.NaN;
def PivL = if LL > 0 then LL else Double.NaN;
plot Up = !isNaN(PivL);
Up.SetPaintingStrategy(PaintingStrategy.BOOLEAN_ARROW_UP);
Up.SetLineWeight(3);
Up.SetDefaultColor(Color.WHITE);
plot Dn = !isNaN(PivH);
Dn.SetPaintingStrategy(PaintingStrategy.BOOLEAN_ARROW_DOWN);
Dn.SetLineWeight(3);
Dn.SetDefaultColor(Color.ORANGE);