Intraday high and low moves

KD3

New member
Hi, i'm new here. I've tried searching but had no luck.
Can someone help me create a script that can measure the intraday swing high and low (preferably in points, ticks works too)?
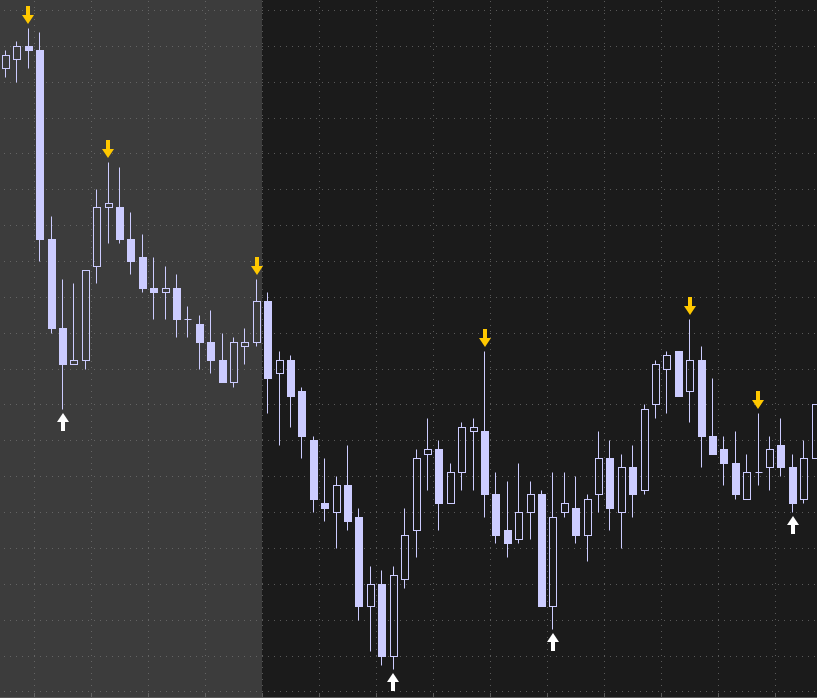
I'm not a coder, so I tried copying and pasting stuff, but not getting what I want. This is a start (from Ben's anchored VWAP), I changed n=4
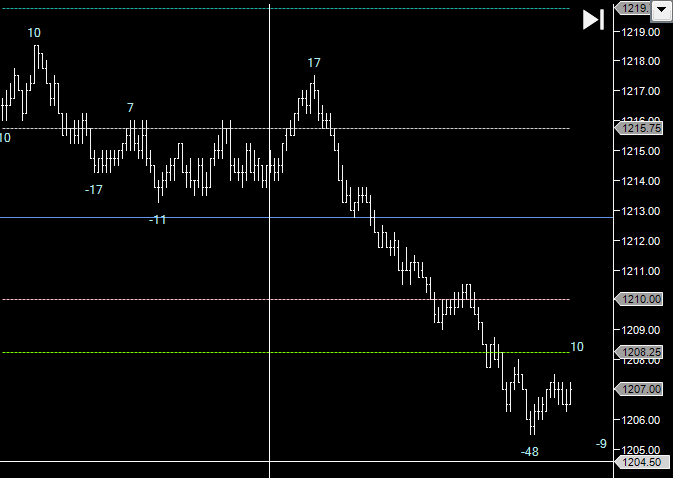
But I was wondering if it's possible to change the arrows to the number of ticks or points it moved from the swing high or low, like this image?
I would like to know the points it moved without having to draw a trendline to count.
Here is the image of what I would like to look like:
N3nVcZY.png

and this is what I have so far:
eMuIOW8.png


#hint n: Lookback period for finding swing highs, lows.
input n = 4;

#hint ticks: Offset High/Low VWAP lines by this number of ticks.
input ticks = 2.0;

def bnOK = barNumber() > n;

def isHigher = fold i = 1 to n + 1 with p = 1
while p do high > GetValue(high, -i);

def HH = if bnOK and isHigher
and high == Highest(high, n)
then high else Double.NaN;

def isLower = fold j = 1 to n + 1 with q = 1
while q do low < GetValue(low, -j);

def LL = if bnOK and isLower
and low == Lowest(low, n)
then low else Double.NaN;

def PivH = if HH > 0 then HH else Double.NaN;
def PivL = if LL > 0 then LL else Double.NaN;

plot Up = !isNaN(PivL);
Up.SetPaintingStrategy(PaintingStrategy.BOOLEAN_ARROW_UP);
Up.SetLineWeight(3);
Up.SetDefaultColor(Color.WHITE);

plot Dn = !isNaN(PivH);
Dn.SetPaintingStrategy(PaintingStrategy.BOOLEAN_ARROW_DOWN);
Dn.SetLineWeight(3);
Dn.SetDefaultColor(Color.ORANGE);
 
Solution
Hi, i'm new here. I've tried searching but had no luck.
Can someone help me create a script that can measure the intraday swing high and low (preferably in points, ticks works too)?
I'm not a coder, so I tried copying and pasting stuff, but not getting what I want. This is a start (from Ben's anchored VWAP), I changed n=4
But I was wondering if it's possible to change the arrows to the number of ticks or points it moved from the swing high or low, like this image?
I would like to know the points it moved without having to draw a trendline to count.
Here is the image of what I would like to look like:
N3nVcZY.png

and this is what I have so far:
eMuIOW8.png


#hint n: Lookback period...
Hi, i'm new here. I've tried searching but had no luck.
Can someone help me create a script that can measure the intraday swing high and low (preferably in points, ticks works too)?
I'm not a coder, so I tried copying and pasting stuff, but not getting what I want. This is a start (from Ben's anchored VWAP), I changed n=4
But I was wondering if it's possible to change the arrows to the number of ticks or points it moved from the swing high or low, like this image?
I would like to know the points it moved without having to draw a trendline to count.
Here is the image of what I would like to look like:
N3nVcZY.png

and this is what I have so far:
eMuIOW8.png


#hint n: Lookback period for finding swing highs, lows.
input n = 4;

#hint ticks: Offset High/Low VWAP lines by this number of ticks.
input ticks = 2.0;

def bnOK = barNumber() > n;

def isHigher = fold i = 1 to n + 1 with p = 1
while p do high > GetValue(high, -i);

def HH = if bnOK and isHigher
and high == Highest(high, n)
then high else Double.NaN;

def isLower = fold j = 1 to n + 1 with q = 1
while q do low < GetValue(low, -j);

def LL = if bnOK and isLower
and low == Lowest(low, n)
then low else Double.NaN;

def PivH = if HH > 0 then HH else Double.NaN;
def PivL = if LL > 0 then LL else Double.NaN;

plot Up = !isNaN(PivL);
Up.SetPaintingStrategy(PaintingStrategy.BOOLEAN_ARROW_UP);
Up.SetLineWeight(3);
Up.SetDefaultColor(Color.WHITE);

plot Dn = !isNaN(PivH);
Dn.SetPaintingStrategy(PaintingStrategy.BOOLEAN_ARROW_DOWN);
Dn.SetLineWeight(3);
Dn.SetDefaultColor(Color.ORANGE);

Rather than using the code you provided, here is code that I have posted that is similar, but forces a zigzag pattern as shown in your first example.

This code already had a showbubbles option, which is set to NO for your request, but has many options that may interest you. I have added a bubbles option which is set to YES, which has your request for Points and Ticcks.

The upper image is the code provided below. The lower code is what you provided. It does not provide a zigzag as there are often multiple, consecutive highs or lows without an interceding high or low between these.

Screenshot 2023-10-26 155941.png
Code:
#Swing_HL_Pivots_Stats_v1

input pivotlength = 4;
input showhorizontals = no;
input show_zigzag_line = no;
input HHLLlabels = no;
input showbubbles = no;
input showHHLL_in_bubbles = no;
input showprice_in_bubbles = no;
input showpercentpricechange_in_bubbles = no;
input showbarcount_in_bubbles = no;
input showdollarchange_in_bubbles = no;

def h = high;
def l = low;
def c = close;
def o = open;
def v = volume;

# Simple Swing Pivots

def HH1 = h >= Highest(h, pivotlength) and h >= Highest(h, pivotlength)[-pivotlength];
def High1 = if HH1 then h else Double.NaN;
def LL1 = l <= Lowest(l, pivotlength) and l <= Lowest(l, pivotlength)[-pivotlength];
def Low1 = if LL1 then l else Double.NaN;
def PointCount = if BarNumber() == 1 then 0 else
                 if IsNaN(c) then PointCount[1] else
                 if !IsNaN(High1) then Max(1, PointCount[1] + 1) else
                 if !IsNaN(Low1) then Min(-1, PointCount[1] - 1)
                 else PointCount[1];

#Horizontal Lines at Pivots1
def RangeHI = if !IsNaN(High1) and PointCount == 1
then h else RangeHI[1];
plot Rhi = RangeHI;
Rhi.SetPaintingStrategy(PaintingStrategy.HORIZONTAL);
Rhi.SetLineWeight(1);
Rhi.SetDefaultColor(Color.GRAY);
Rhi.SetHiding(!showhorizontals);
def RangeLO = if !IsNaN(Low1) and PointCount == -1
then l else RangeLO[1];
plot Rlo = RangeLO;
Rlo.SetPaintingStrategy(PaintingStrategy.HORIZONTAL);
Rlo.SetLineWeight(1);
Rlo.SetDefaultColor(Color.GRAY);
Rlo.SetHiding(!showhorizontals);

#HH/LH & LH/LL1 Labels

def rh1 = if !IsNaN(Rhi) then Rhi else rh1[1];
def rh2 = if rh1 != rh1[1] then rh1[1] else rh2[1];

AddLabel(HHLLlabels, if rh1 > rh2
              then "Higher Highs"
              else "Lower Highs",
              if rh1 > rh2
              then Color.GREEN
              else Color.RED);

def rl1 = if !IsNaN(Rlo) then Rlo else rl1[1];
def rl2 = if rl1 != rl1[1] then rl1[1] else rl2[1];
AddLabel(HHLLlabels, if  rl1 > rl2
              then "Higher Lows"
              else "Lower Lows",
              if rl1 > rl2
              then Color.GREEN
              else Color.RED);

#ZigZags
def zHI;
def zLO;

zHI = if !IsNaN(High1) and PointCount == 1 then h else Double.NaN;
zLO = if !IsNaN(Low1) and PointCount == -1 then l else Double.NaN;

def bn = BarNumber();
def lastzhi = if !IsNaN(zHI) then bn else lastzhi[1];
def lastzlo = if !IsNaN(zLO) then bn else lastzlo[1];

#ZigZag Line
plot hilowline = if !IsNaN(zHI) then zHI else zLO;
hilowline.EnableApproximation();
hilowline.SetLineWeight(3);
hilowline.SetDefaultColor(Color.GRAY);
hilowline.SetHiding(!show_zigzag_line);

def last = if IsNaN(close[-1]) and !IsNaN(close) then BarNumber() else Double.NaN;
def lastbar   = if BarNumber() == HighestAll(last) then 1 else 0;
def lastvalue = if lastbar then close else Double.NaN;

plot hilowline1 = if bn < Max(lastzhi, lastzlo)
                  then Double.NaN
                  else if lastzlo > lastzhi and !IsNaN(zLO)
                  then zLO
                  else if lastzlo < lastzhi and !IsNaN(zHI)
                  then zHI else lastvalue;
hilowline1.EnableApproximation();
hilowline1.SetLineWeight(3);
hilowline1.SetDefaultColor(Color.GRAY);
hilowline1.SetHiding(!show_zigzag_line);

def xxhigh  = if rh1 == high then high else xxhigh[1];
def xxlow   = if rl1 == low then low else xxlow[1];

#Percent Price Change between ZigZags
def chghigh = (rh1 - xxlow[1]) / xxlow[1] * 100;
def chglow  = (rl1 - xxhigh[1]) / xxhigh[1] * 100;

#Bar Count between ZigZags
def barcountchange = AbsValue(lastzhi - lastzlo);


AddChartBubble(showbubbles and !IsNaN(High1) and PointCount == 1, high,
(if showHHLL_in_bubbles then
(if rh1 > rh2 then "HH\n" else "LH\n")
else "") +
(if showprice_in_bubbles then
AsText(high) + "\n" else "") +
(if showpercentpricechange_in_bubbles
then Round(chghigh) + "%\n" else "") +
(if showbarcount_in_bubbles then
 barcountchange + "\n" else "") +
(if showdollarchange_in_bubbles then
"" + AsDollars((rh1 - xxlow[1])) else "") ,
Color.GRAY
#if xxhigh > xxhigh[1] then Color.GREEN else Color.RED
);

AddChartBubble(showbubbles and !IsNaN(Low1) and PointCount == -1, low,
(if showHHLL_in_bubbles then
(if rl1 > rl2 then "HL\n" else "LL\n")
else "") +
(if showprice_in_bubbles then
AsText(low) + "\n" else "") +
(if showpercentpricechange_in_bubbles
then Round(chglow) + "%\n" else "") +
(if showbarcount_in_bubbles then
barcountchange + "\n" else "") +
(if showdollarchange_in_bubbles then
"" + AsDollars(rl1 - xxhigh[1]) else ""),
#if xxlow > xxlow[1] then Color.GREEN else Color.RED,
Color.GRAY, no);

input bubbles = yes;
AddChartBubble(bubbles and !IsNaN(High1) and PointCount == 1,
high,
"Points: " + (Rhi - Rlo[1]) +
"\nTicks: " + ((Rhi - Rlo[1]) / TickSize()),
Color.GRAY);

AddChartBubble(bubbles and !IsNaN(Low1) and PointCount == -1,
low,
"Points: " + (Rlo - Rhi[1]) +
"\nTicks: " + ((Rlo - Rhi[1]) / TickSize()),
Color.GRAY,
no);

#If last bar is not a pivot, then Pending based upon high/low of that bar
def pivhbar = lastzhi;#if !IsNaN(pivh) then BarNumber() else pivhbar[1];
def pivlbar = lastzlo;#if !IsNaN(pivl) then BarNumber() else pivlbar[1];

AddChartBubble(bubbles and IsNaN(close[-1]) and !IsNaN(close),
if pivhbar > pivlbar then low else high,
"Pending\n" + "Points: " + (if pivhbar > pivlbar then Rhi - low else high - Rlo) +
"\nTicks: " + if pivhbar > pivlbar then (Rhi - low) / TickSize() else (high - Rlo) / TickSize(), Color.YELLOW,
if pivhbar > pivlbar then no else yes);

input test = no;
AddLabel(test, TickSize() + " " + TickValue());

#
 
Last edited:
Solution
Rather than using the code you provided, here is code that I have posted that is similar, but forces a zigzag patteern as shown in your first example.

This code already had a showbubbles option, which is set to NO for your request, but has many options that may interest you. I have added a bubbles option which is set to YES, which has your request for Points and Ticcks.

The upper image is the code provided below. The lower code is what you provided. It does not provide a zigzag as there are often multiple, consecutive highs or lows without an interceding high or low between these.
that's amazing! thats exactly what I was wanting. thank you so much! This is great!
 
Last edited by a moderator:
Rather than using the code you provided, here is code that I have posted that is similar, but forces a zigzag pattern as shown in your first example.

This code already had a showbubbles option, which is set to NO for your request, but has many options that may interest you. I have added a bubbles option which is set to YES, which has your request for Points and Ticcks.

The upper image is the code provided below. The lower code is what you provided. It does not provide a zigzag as there are often multiple, consecutive highs or lows without an interceding high or low between these.
@SleepyZ This script is great, thank you so much. I have a question: it all works wonderfully except that the "barcountchange" variable doesn't work well for tracking the current bar count that has elapsed since the last pivot high or low. If the bar count is added to the "pending" bubble, it instead shows the total bar count that occurred until the last pivot high or low. To create a bar count for the bars that have elapsed since after the last pivot high or low, I tried "pending_barcountchange = if !isNan(high1) or !isNan(low1) then 1 else pending_barcountchange[1] + 1;"

Sometimes I am confused by how the script repaints the last pivot high or low and what this does to the bar count. I have observed a case where the last pivot high or low bubble disappears but then the current "pending" one still shows a bar count as if the last pivot high or low had not disappeared (for example, if two bars ago the last pivot low bubble shows "Bars: 42" and then the current "pending" bubble shows: "Bars: 2" then it has happened where the pivot showing "Bars: 42" disappeared on the next bar, but then the "pending" bubble still shows "Bars: 3" instead of showing "Bars: 45" as I'd expect if the last pivot high or low had really been deleted. Maybe this issue is only limited to occasionally happening while the script is repainting, I'm not sure.

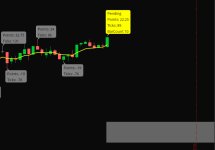
I have includeda screenshot of an example of how the numbers for "pending"barcountchange" don't add up as expected sometimes (the "BullCt," BearCt," "NeutralCt" stats are additions based on other signals that aren't part of the original script but I have not altered the original script in any way other than adding the "pending_barcountchange" variable and displaying its value in the pending bubble instead of using the "barcountchange" variable in that bubble):

Capture-pendingbarcountchg.PNG


Can you suggest a better way of defining the pending bar count so that it would correctly read as 5 instead of 2 as in the above screenshotted example?
 
@SleepyZ This script is great, thank you so much. I have a question: it all works wonderfully except that the "barcountchange" variable doesn't work well for tracking the current bar count that has elapsed since the last pivot high or low. If the bar count is added to the "pending" bubble, it instead shows the total bar count that occurred until the last pivot high or low. To create a bar count for the bars that have elapsed since after the last pivot high or low, I tried "pending_barcountchange = if !isNan(high1) or !isNan(low1) then 1 else pending_barcountchange[1] + 1;"

Sometimes I am confused by how the script repaints the last pivot high or low and what this does to the bar count. I have observed a case where the last pivot high or low bubble disappears but then the current "pending" one still shows a bar count as if the last pivot high or low had not disappeared (for example, if two bars ago the last pivot low bubble shows "Bars: 42" and then the current "pending" bubble shows: "Bars: 2" then it has happened where the pivot showing "Bars: 42" disappeared on the next bar, but then the "pending" bubble still shows "Bars: 3" instead of showing "Bars: 45" as I'd expect if the last pivot high or low had really been deleted. Maybe this issue is only limited to occasionally happening while the script is repainting, I'm not sure.

I have includeda screenshot of an example of how the numbers for "pending"barcountchange" don't add up as expected sometimes (the "BullCt," BearCt," "NeutralCt" stats are additions based on other signals that aren't part of the original script but I have not altered the original script in any way other than adding the "pending_barcountchange" variable and displaying its value in the pending bubble instead of using the "barcountchange" variable in that bubble):

View attachment 20399

Can you suggest a better way of defining the pending bar count so that it would correctly read as 5 instead of 2 as in the above screenshotted example?
@lmk99 was your question to @SleepyZ resolved or did you figure it out. If you don't mind, if you figured it out, kindly share the new script. Thanks.
 
@lmk99 was your question to @SleepyZ resolved or did you figure it out. If you don't mind, if you figured it out, kindly share the new script. Thanks.

Sorry, missed imk99's request. This barct def should fix that pending barcount.

Code:
#If last bar is not a pivot, then Pending based upon high/low of that bar
def pivhbar = lastzhi;#if !IsNaN(pivh) then BarNumber() else pivhbar[1];
def pivlbar = lastzlo;#if !IsNaN(pivl) then BarNumber() else pivlbar[1];
def barct = if pivhbar > pivlbar then AbsValue(pivhbar - BarNumber()) else AbsValue(pivlbar - BarNumber());

AddChartBubble(bubbles and IsNaN(close[-1]) and !IsNaN(close),
if pivhbar > pivlbar then low else high,
"Pending\n" + "Points: " + (if pivhbar > pivlbar then Rhi - low else high - Rlo) +
"\nTicks: " + (if pivhbar > pivlbar then (Rhi - low) / TickSize() else (high - Rlo) / TickSize()) + " \nBarCount " + barct, Color.YELLOW,
if pivhbar > pivlbar then no else yes);

Here is the full code with that fix added showing an example of pending following a high/low prior pivot.

Screenshot 2024-01-14 100350.png
Code:
#Swing_HL_Pivots_Stats_v1

input pivotlength = 4;
input showhorizontals = no;
input show_zigzag_line = no;
input HHLLlabels = no;
input showbubbles = no;
input showHHLL_in_bubbles = no;
input showprice_in_bubbles = no;
input showpercentpricechange_in_bubbles = no;
input showbarcount_in_bubbles = no;
input showdollarchange_in_bubbles = no;

def h = high;
def l = low;
def c = close;
def o = open;
def v = volume;

# Simple Swing Pivots

def HH1 = h >= Highest(h, pivotlength) and h >= Highest(h, pivotlength)[-pivotlength];
def High1 = if HH1 then h else Double.NaN;
def LL1 = l <= Lowest(l, pivotlength) and l <= Lowest(l, pivotlength)[-pivotlength];
def Low1 = if LL1 then l else Double.NaN;
def PointCount = if BarNumber() == 1 then 0 else
                 if IsNaN(c) then PointCount[1] else
                 if !IsNaN(High1) then Max(1, PointCount[1] + 1) else
                 if !IsNaN(Low1) then Min(-1, PointCount[1] - 1)
                 else PointCount[1];

#Horizontal Lines at Pivots1
def RangeHI = if !IsNaN(High1) and PointCount == 1
then h else RangeHI[1];
plot Rhi = RangeHI;
Rhi.SetPaintingStrategy(PaintingStrategy.HORIZONTAL);
Rhi.SetLineWeight(1);
Rhi.SetDefaultColor(Color.GRAY);
Rhi.SetHiding(!showhorizontals);
def RangeLO = if !IsNaN(Low1) and PointCount == -1
then l else RangeLO[1];
plot Rlo = RangeLO;
Rlo.SetPaintingStrategy(PaintingStrategy.HORIZONTAL);
Rlo.SetLineWeight(1);
Rlo.SetDefaultColor(Color.GRAY);
Rlo.SetHiding(!showhorizontals);

#HH/LH & LH/LL1 Labels

def rh1 = if !IsNaN(Rhi) then Rhi else rh1[1];
def rh2 = if rh1 != rh1[1] then rh1[1] else rh2[1];

AddLabel(HHLLlabels, if rh1 > rh2
              then "Higher Highs"
              else "Lower Highs",
              if rh1 > rh2
              then Color.GREEN
              else Color.RED);

def rl1 = if !IsNaN(Rlo) then Rlo else rl1[1];
def rl2 = if rl1 != rl1[1] then rl1[1] else rl2[1];
AddLabel(HHLLlabels, if  rl1 > rl2
              then "Higher Lows"
              else "Lower Lows",
              if rl1 > rl2
              then Color.GREEN
              else Color.RED);

#ZigZags
def zHI;
def zLO;

zHI = if !IsNaN(High1) and PointCount == 1 then h else Double.NaN;
zLO = if !IsNaN(Low1) and PointCount == -1 then l else Double.NaN;

def bn = BarNumber();
def lastzhi = if !IsNaN(zHI) then bn else lastzhi[1];
def lastzlo = if !IsNaN(zLO) then bn else lastzlo[1];

#ZigZag Line
plot hilowline = if !IsNaN(zHI) then zHI else zLO;
hilowline.EnableApproximation();
hilowline.SetLineWeight(3);
hilowline.SetDefaultColor(Color.GRAY);
hilowline.SetHiding(!show_zigzag_line);

def last = if IsNaN(close[-1]) and !IsNaN(close) then BarNumber() else Double.NaN;
def lastbar   = if BarNumber() == HighestAll(last) then 1 else 0;
def lastvalue = if lastbar then close else Double.NaN;

plot hilowline1 = if bn < Max(lastzhi, lastzlo)
                  then Double.NaN
                  else if lastzlo > lastzhi and !IsNaN(zLO)
                  then zLO
                  else if lastzlo < lastzhi and !IsNaN(zHI)
                  then zHI else lastvalue;
hilowline1.EnableApproximation();
hilowline1.SetLineWeight(3);
hilowline1.SetDefaultColor(Color.GRAY);
hilowline1.SetHiding(!show_zigzag_line);

def xxhigh  = if rh1 == high then high else xxhigh[1];
def xxlow   = if rl1 == low then low else xxlow[1];

#Percent Price Change between ZigZags
def chghigh = (rh1 - xxlow[1]) / xxlow[1] * 100;
def chglow  = (rl1 - xxhigh[1]) / xxhigh[1] * 100;

#Bar Count between ZigZags
def barcountchange = AbsValue(lastzhi - lastzlo);


AddChartBubble(showbubbles and !IsNaN(High1) and PointCount == 1, high,
(if showHHLL_in_bubbles then
(if rh1 > rh2 then "HH\n" else "LH\n")
else "") +
(if showprice_in_bubbles then
AsText(high) + "\n" else "") +
(if showpercentpricechange_in_bubbles
then Round(chghigh) + "%\n" else "") +
(if showbarcount_in_bubbles then
 barcountchange + "\n" else "") +
(if showdollarchange_in_bubbles then
"" + AsDollars((rh1 - xxlow[1])) else "") ,
Color.GRAY
#if xxhigh > xxhigh[1] then Color.GREEN else Color.RED
);

AddChartBubble(showbubbles and !IsNaN(Low1) and PointCount == -1, low,
(if showHHLL_in_bubbles then
(if rl1 > rl2 then "HL\n" else "LL\n")
else "") +
(if showprice_in_bubbles then
AsText(low) + "\n" else "") +
(if showpercentpricechange_in_bubbles
then Round(chglow) + "%\n" else "") +
(if showbarcount_in_bubbles then
barcountchange + "\n" else "") +
(if showdollarchange_in_bubbles then
"" + AsDollars(rl1 - xxhigh[1]) else ""),
#if xxlow > xxlow[1] then Color.GREEN else Color.RED,
Color.GRAY, no);

input bubbles = yes;
AddChartBubble(bubbles and !IsNaN(High1) and PointCount == 1,
high,
"Points: " + (Rhi - Rlo[1]) +
"\nTicks: " + ((Rhi - Rlo[1]) / TickSize()),
Color.GRAY);

AddChartBubble(bubbles and !IsNaN(Low1) and PointCount == -1,
low,
"Points: " + (Rlo - Rhi[1]) +
"\nTicks: " + ((Rlo - Rhi[1]) / TickSize()),
Color.GRAY,
no);

#If last bar is not a pivot, then Pending based upon high/low of that bar
def pivhbar = lastzhi;#if !IsNaN(pivh) then BarNumber() else pivhbar[1];
def pivlbar = lastzlo;#if !IsNaN(pivl) then BarNumber() else pivlbar[1];
def barct = if pivhbar > pivlbar then AbsValue(pivhbar - BarNumber()) else AbsValue(pivlbar - BarNumber());

AddChartBubble(bubbles and IsNaN(close[-1]) and !IsNaN(close),
if pivhbar > pivlbar then low else high,
"Pending\n" + "Points: " + (if pivhbar > pivlbar then Rhi - low else high - Rlo) +
"\nTicks: " + (if pivhbar > pivlbar then (Rhi - low) / TickSize() else (high - Rlo) / TickSize()) + " \nBarCount " + barct, Color.YELLOW,
if pivhbar > pivlbar then no else yes);

input test = no;
AddLabel(test, TickSize() + " " + TickValue());
 
Sorry, missed imk99's request. This barct def should fix that pending barcount.


Here is the full code with that fix added showing an example of pending following a high/low prior pivot.
This is amazing! In the inputs/options it has a yes/no toggle for "showprice in bubbles", "showdollarchange" and "showpercentagepricechange in bubbles", however when I put them on yes it still only shows ticks and points. Is this something I am doing wrong or does the code need to be edited to have the bubble show current Price +/- and Price%change. Thanks
 

Join useThinkScript to post your question to a community of 21,000+ developers and traders.

Similar threads

Not the exact question you're looking for?

Start a new thread and receive assistance from our community.

87k+ Posts
431 Online
Create Post

Similar threads

Similar threads

The Market Trading Game Changer

Join 2,500+ subscribers inside the useThinkScript VIP Membership Club
  • Exclusive indicators
  • Proven strategies & setups
  • Private Discord community
  • ‘Buy The Dip’ signal alerts
  • Exclusive members-only content
  • Add-ons and resources
  • 1 full year of unlimited support

Frequently Asked Questions

What is useThinkScript?

useThinkScript is the #1 community of stock market investors using indicators and other tools to power their trading strategies. Traders of all skill levels use our forums to learn about scripting and indicators, help each other, and discover new ways to gain an edge in the markets.

How do I get started?

We get it. Our forum can be intimidating, if not overwhelming. With thousands of topics, tens of thousands of posts, our community has created an incredibly deep knowledge base for stock traders. No one can ever exhaust every resource provided on our site.

If you are new, or just looking for guidance, here are some helpful links to get you started.

What are the benefits of VIP Membership?
VIP members get exclusive access to these proven and tested premium indicators: Buy the Dip, Advanced Market Moves 2.0, Take Profit, and Volatility Trading Range. In addition, VIP members get access to over 50 VIP-only custom indicators, add-ons, and strategies, private VIP-only forums, private Discord channel to discuss trades and strategies in real-time, customer support, trade alerts, and much more. Learn all about VIP membership here.
How can I access the premium indicators?
To access the premium indicators, which are plug and play ready, sign up for VIP membership here.
Back
Top