ChocolateVol
New member
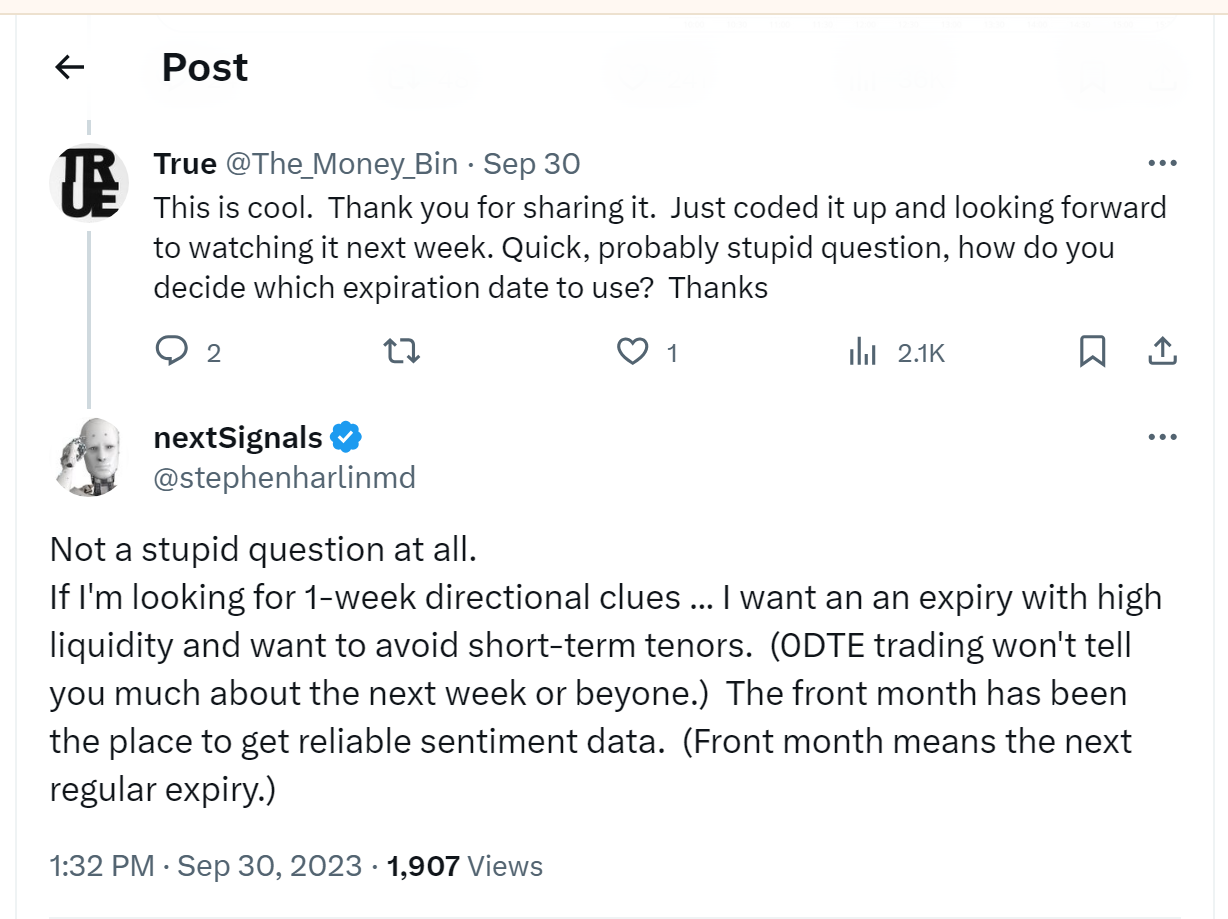
Reposting a recent bearish indicator publicly shared by Dr. Stephen Harlin here:
https://x.com/stephenharlinmd/status/1708146734587621505?s=20
Would be interested to find the most reliable timeframe and similarly a valid bullish indicator.
Dr. Harlin states:
Category: "On Inferring the Direction of Option Trades
https://x.com/stephenharlinmd/status/1708146734587621505?s=20
Would be interested to find the most reliable timeframe and similarly a valid bullish indicator.
Dr. Harlin states:
Category: "On Inferring the Direction of Option Trades
Market microstructure analysis begs a determination of whether a transaction was initiated by a buyer or a seller. Our broker data sets do not provide information about the initiator of a transaction ... so this must be inferred. (Guessed.)
There are multiple algorithms published in the research literature that examine the predictive value of various classification systems. Two of the most widely studied systems show accuracy in the 70-83% range.
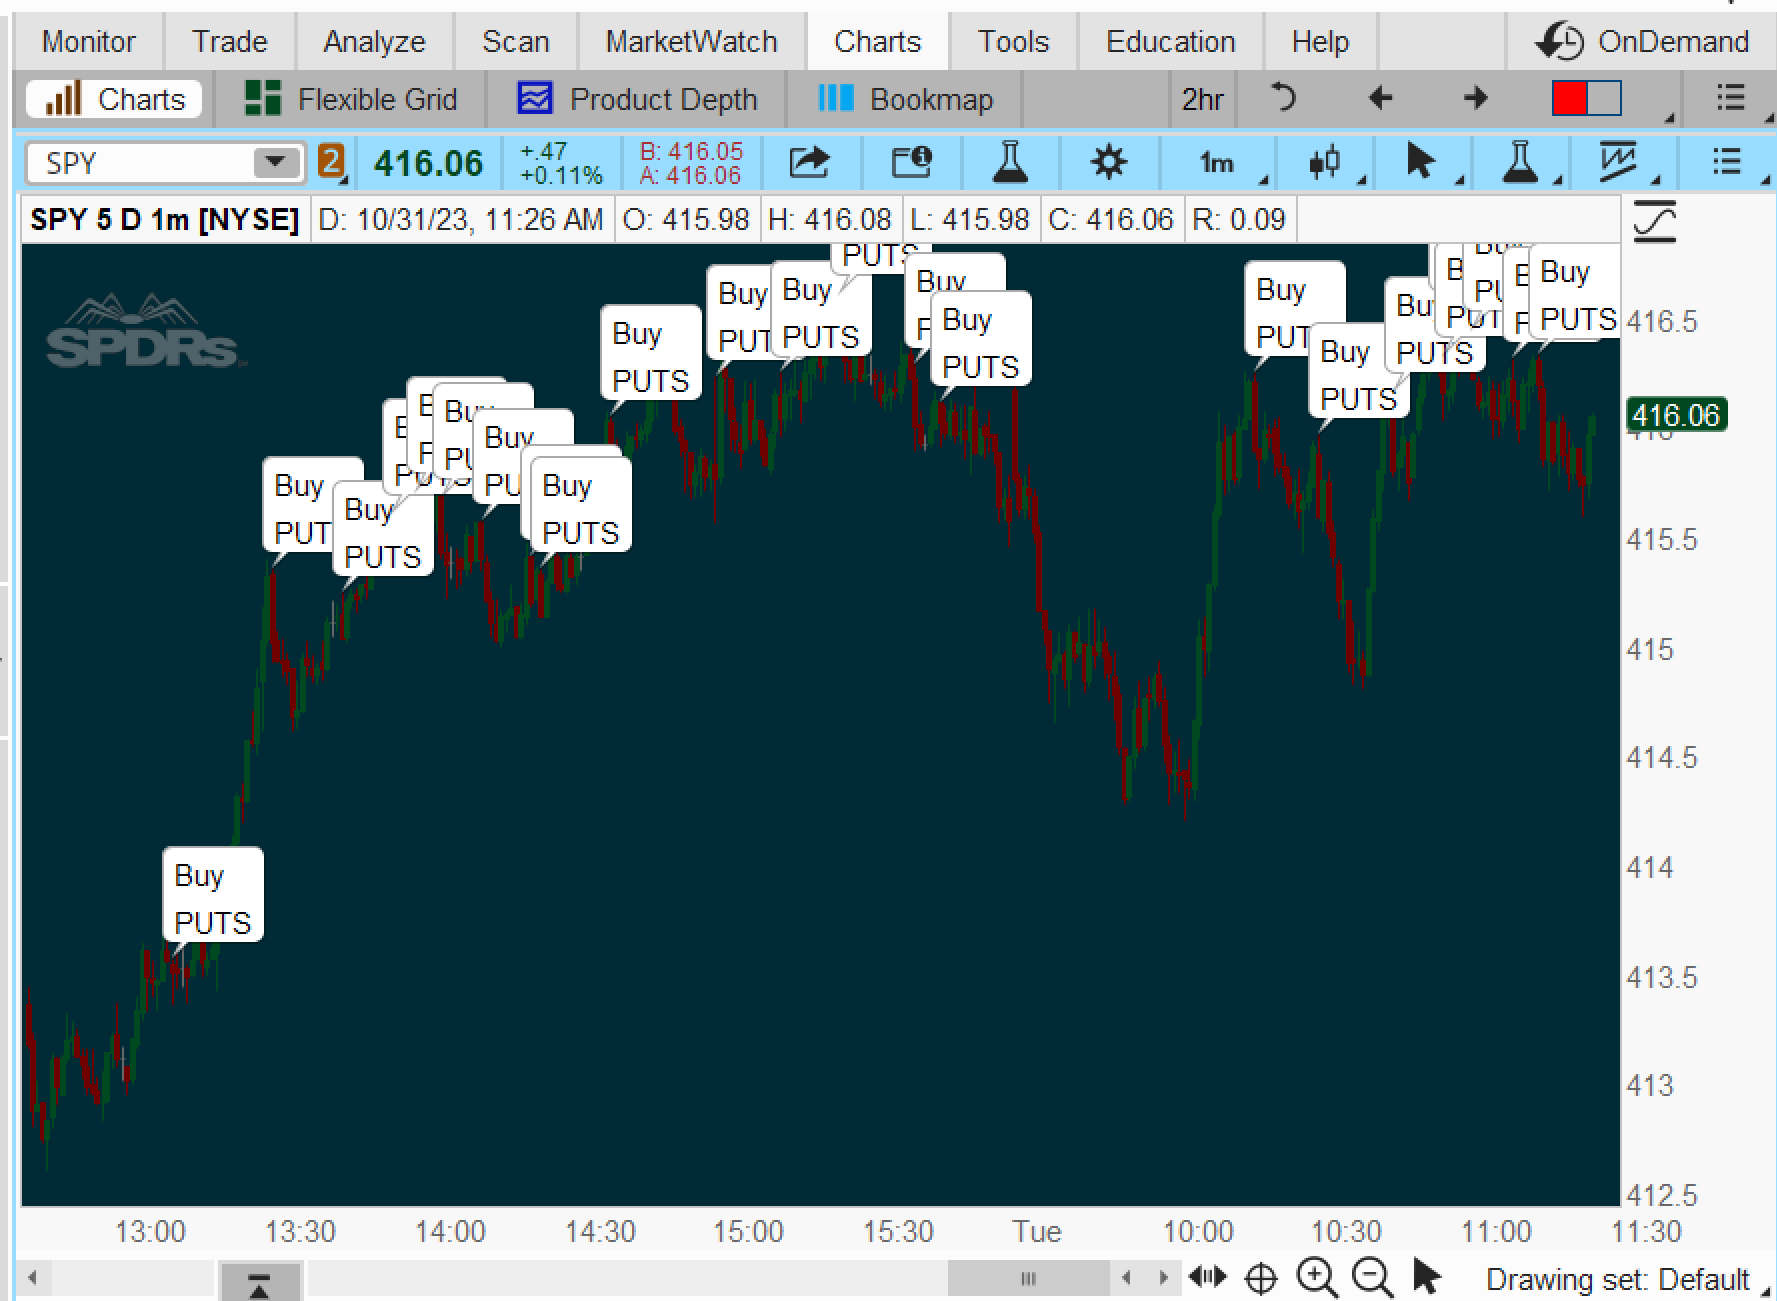
Thinkscript, show me occurences when ... ATM put option transaction volume exceeded 10 and, simultaneously:
• options volume pushed a close below the price bar's open,
• the market had just rallied (slope > 0),
• the high was above a 100-period moving average,
• the range of the price bar was > average true range, and
• the open was > the close 4 bars ago (DeMark qualifier).
In simple terms, this Thinkscript study just says, "Tag short-term rally highs when option volume contributes to push the close down off its open."
Points
1. There are lots of ways to infer whether options were bought or sold and they have been published and compared for accuracy ... for years.
2. In my own work on developing classification systems ... sometimes I see bursts of options activity related to news that absolutely gives away direction clues. And other times I see nothing suggesting institutional activity ... when a great trade could have been made.
On could rightfully argue that the criteria embedded in this Thinkscript is just a common sense trading strategy ... so who cares if institutions ... with their various motives ... are behind unusual options activity.
Code:
input expirationDate = 231030;
def ATR = MovingAverage(AverageType.WILDERS, TrueRange(high, close, low), 5);
def MA = Average(close, 100);
def range = high - low;
def m = 6 * (WMA(OHLC4, 6) - Average(OHLC4, 6)) / (6 - 1);
def atmVolume = volume(GetATMOption(GetUnderlyingSymbol(), expirationDate, OptionClass.PUT));

AddChartBubble(
close < open
and atmVolume > 10
and m > 0
and high > MA
and range > ATR
and open > close[4], high, "Buy" + "\nPUTS", Color.WHITE, yes);
Last edited by a moderator: