Identifying Chop, Sideways, Consolidation, Contraction, Congestion For ThinkOrSwim

MerryDay

Administrative
Staff member
Staff
VIP
Lifetime
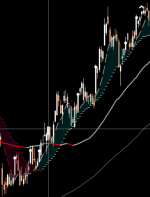
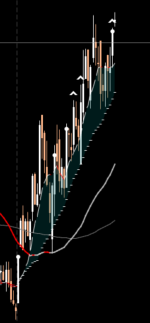
Most of 'Chop, Sideways, Consolidation, Contraction, Congestion' indicators display similar data: the zones where price lacks trend, momentum, volume, and direction; basically just lying there like a dead fish, not going anywhere ;).

What you use depends on what works best with your strategy, how much lower chart real estate you have available versus how cluttered you like your upper chart, and so on and so on.
Which indicator appearance appeals to you most? And whether the additional data provided besides the chop points is of interest to you.

Here are the forum indicators written specifically to identify Chop / Sideways action:
https://usethinkscript.com/search/816383/?q=chop*&t=post&c[child_nodes]=1&c[nodes][0]=3&c[title_only]=1&o=replies
https://usethinkscript.com/threads/indicator-to-identify-a-sideways-market.10878/
https://usethinkscript.com/threads/finding-stocks-on-sideways-trend.3878/
https://usethinkscript.com/threads/redk-chop-breakout-scout-v2-0-for-thinkorswim.12359/
https://usethinkscript.com/threads/chop-zone-with-moving-average-for-thinkorswim.13369/


Looking for Consolidation is the most common way members identify chop on the forum:
https://usethinkscript.com/threads/...ipts-to-detect-periods-of-consolidation.1159/
https://usethinkscript.com/threads/john-carters-squeeze-pro-indicator-for-thinkorswim-free.4021/
https://usethinkscript.com/threads/eci-gaussian-indicator-for-thinkorswim.1160/
https://usethinkscript.com/threads/...kout-breakdown-indicator-for-thinkorswim.103/
https://usethinkscript.com/threads/...n-lack-of-directional-momentum-indicator.404/
https://usethinkscript.com/threads/macd-label-count-consecutive-histogram-bars.8265/#post-77970
https://usethinkscript.com/threads/bull-bear-absolute-strength-indicator-for-thinkorswim.11160/
https://usethinkscript.com/threads/congestion-zone.10503/
https://usethinkscript.com/threads/gaussian-rainbow-ma-indicator-for-thinkorswim.279/


Contraction / Squeeze
https://usethinkscript.com/threads/...m-no-trend-signal-e-g-in-adx.8132/#post-77140
These Squeeze Indicators use the narrowing of bands to determine that a price is in chop. You can start with plugging and playing the ToS TTM Squeeze:
https://usethinkscript.com/threads/ttm-squeeze-format-scan-watchlist-label-for-thinkorswim.2751/
If you find it of value and want to see more, here are the most popular Custom Squeeze studies:
https://usethinkscript.com/threads/how-to-anticipate-an-all-day-squeeze.6579/
https://usethinkscript.com/search/8...1&c[nodes][0]=3&c[title_only]=1&o=replies&g=1
 
Last edited:

Join useThinkScript to post your question to a community of 21,000+ developers and traders.

HI Guys,
I have a lot of stocks coming out of the scanner are choppy, they might satisfy my criteria of have growth in the past few month, but the price action is just terrible.
I wonder how to set criteria to weed out some of these results, any ideas are welcome!
Just to be clear, my timeframe is looking at past 12 months action.

Disclaimer: If you define chop as sideways price action, then many stocks (especially across these last few months) might not be able to qualify.

That said, I can think of three ideas (others might chime in with more):
(1) comparing (to closes or highs or moving averages) )
(2) patterns
(3) multiple time frame analysis
.

Note: These are only bullish examples, but you can reverse the sign to search bearish.

#Closes
Code:
# Comparing closes to closes
# Time frame = MONTHLY
plot scan = close > close[1] && close[1] > close[2] && close[2] > close[3] && close[3] > close[5] && close[5] > close[7] && close[7] > close[9] && close[9] > close[11];

# Highs
Code:
# Comparing closes to highs:
# time frame = MONTHLY
plot scan = close > high[1] && close[1] > high[2] && close[2] > high[3] && close[3] > high[5] && close[5] > high[7] && close[7] > high[9] && close[9] > high[11];
# note: might have to tweak this one, as you may find almost too much filtered out, considering the recent regime changes that have impacted most stocks

#Moving Averages
Code:
# compare closes to moving averages:
# Timeframe = Daily
#  [you can try a smaller moving average, for fewer results.]
def SMA200 = Average(close, 200);
def EMA200 = ExpAverage(close, 200); # note: this example only uses SMA200.
plot scan = close > SMA200 && SMA200 > SMA200[21] && SMA200[21] > SMA200[42] && SMA200[42] > SMA200[63] && SMA200[63] > SMA200[105] && SMA200[105] > SMA200[147] && SMA200[147] > SMA200[189] && SMA200[189] > SMA200[231];

# Pattern: Channel-Up
Time frame: 1 year, 1 Day

#Multiple Time Frames
Code:
# Scanning across multiple time frames
# Note: You have to scan each time frame separately in the scanner.
# Suggested time frames: Weekly && Monthly && Quarterly && Yearly
plot scan = close > open && close > high[1];


# Bonus: Guppy Multiple Moving Averages (GMMA)

You might find that one interesting. [imagine scanning past moving averages to confirm they're above or below price -- just an adaptation of the moving average scan from earlier, just with more MAs.]

https://usethinkscript.com/threads/guppy-multiple-moving-averages-indicator-for-thinkorswim.732/
https://www.investopedia.com/terms/g/guppy-multiple-moving-average.asp
https://wishingwealthblog.com/2017/...market-and-individual-stocks-run-my-new-scan/
 
Thank you for your reply

My understanding of choppiness is

1, price respect moving average in the past period (can violate maybe 1 or 2 times)
2, the ATR does not have too much randomness(like if price is 50 and average daily candle is 2, you dont get random bars that is 5 and 10)
3, movement is linear, minimal false breakout and shakeout

i have put 2 picture comparison down below.
any idea is welcome
7GGnpIE.png
zPRIgvh.png
 

Attachments

  • 7GGnpIE.png
    7GGnpIE.png
    54.1 KB · Views: 829
Last edited by a moderator:
# I have an idea for #1 and #2:
define max violations
define a probation period
count how many times the violation occurred during the probation period
if countviolations < maxviolations, then you get parole

But I'm a bit lost on #3. I feel that the concept of breakout and shakeout depends on your identification of some support/resistance and/or trendline that gets broken in one direction or the other. If you have an indicator-based method of identifying breakout/shakeout then it might be possible to count the violations the same as for #1 and #2.

1, price respect moving average in the past period (can violate maybe 1 or 2 times)

Code:
# Here, "respect SMA" = a low or high piercing the SMA '
# (you can change the low or high condition to close, if that suits your definition better)
# SMA Length, max Violations, and Violation Period are configurable.

input SMALength = 20; #length of SMA
input maxSMAViolation = 5; #cap on violations
input SMAViolationPeriod = 30; #number of bars to scan for violation

def SMA = Average(close, SMALength);

# Breach of SMA is a violation
def SMAViolationLong = low < SMA; #Condition for SMA violation Long
def SMAViolationShort = high > SMA; # Condition for SMA Violation Short

# Count the violations per period
def countSMAViolationLong = SUM(SMAViolationLong, SMAViolationPeriod);
def countSMAViolationShort = SUM(SMAViolationShort, SMAViolationPeriod);

# Was the SMA "respected"?
def respectedSMALONG = countSMAViolationLong < maxSMAViolation;
def respectedSMAShort = countSMAViolationShort < maxSMAViolation;

#uncomment the one you want to scan for
#plot scan = respectedSMALong; 
#plot scan = respectedSMAshort;


##################################################

2, the ATR does not have too much randomness(like if price is 50 and average daily candle is 2, you dont get random bars that is 5 and 10)
Code:
# ATR uses the same logic of counting violations. 
# Assumption: Since 5 and 10 are both greater than 2
# Note: ATR isn't the same as average daily range.

input ATRMultiple = 1.75; #multiplier for finding compliant ATRs
input maxATRViolation = 3; #maximum number of ATR Violations
input ATRViolationPeriod = 75; #length of the probation period
input ATRLength = 14;
input averageType = AverageType.WILDERS;
def ATR = MovingAverage(averageType, TrueRange(high, close, low), ATRlength); #average true range
def DTR = TrueRange(high, close, low); #daily true range

def ATRViolation = DTR >= ATRMultiple *ATR;
def countATRViolation = SUM(ATRViolation, ATRViolationPeriod);
def respectedATR = countATRViolation < maxATRViolation;

plot scan = respectedATR;


3, movement is linear, minimal false breakout and shakeout

# I would be guessing at a relatively tight regression channel or standard deviation channel, where you'd count how many times price went outside the channel, but maybe you could clarify.
 
# I have an idea for #1 and #2:
define max violations
define a probation period
count how many times the violation occurred during the probation period
if countviolations < maxviolations, then you get parole

But I'm a bit lost on #3. I feel that the concept of breakout and shakeout depends on your identification of some support/resistance and/or trendline that gets broken in one direction or the other. If you have an indicator-based method of identifying breakout/shakeout then it might be possible to count the violations the same as for #1 and #2.

1, price respect moving average in the past period (can violate maybe 1 or 2 times)

Code:
# Here, "respect SMA" = a low or high piercing the SMA '
# (you can change the low or high condition to close, if that suits your definition better)
# SMA Length, max Violations, and Violation Period are configurable.

input SMALength = 20; #length of SMA
input maxSMAViolation = 5; #cap on violations
input SMAViolationPeriod = 30; #number of bars to scan for violation

def SMA = Average(close, SMALength);

# Breach of SMA is a violation
def SMAViolationLong = low < SMA; #Condition for SMA violation Long
def SMAViolationShort = high > SMA; # Condition for SMA Violation Short

# Count the violations per period
def countSMAViolationLong = SUM(SMAViolationLong, SMAViolationPeriod);
def countSMAViolationShort = SUM(SMAViolationShort, SMAViolationPeriod);

# Was the SMA "respected"?
def respectedSMALONG = countSMAViolationLong < maxSMAViolation;
def respectedSMAShort = countSMAViolationShort < maxSMAViolation;

#uncomment the one you want to scan for
#plot scan = respectedSMALong;
#plot scan = respectedSMAshort;


##################################################

2, the ATR does not have too much randomness(like if price is 50 and average daily candle is 2, you dont get random bars that is 5 and 10)
Code:
# ATR uses the same logic of counting violations.
# Assumption: Since 5 and 10 are both greater than 2
# Note: ATR isn't the same as average daily range.

input ATRMultiple = 1.75; #multiplier for finding compliant ATRs
input maxATRViolation = 3; #maximum number of ATR Violations
input ATRViolationPeriod = 75; #length of the probation period
input ATRLength = 14;
input averageType = AverageType.WILDERS;
def ATR = MovingAverage(averageType, TrueRange(high, close, low), ATRlength); #average true range
def DTR = TrueRange(high, close, low); #daily true range

def ATRViolation = DTR >= ATRMultiple *ATR;
def countATRViolation = SUM(ATRViolation, ATRViolationPeriod);
def respectedATR = countATRViolation < maxATRViolation;

plot scan = respectedATR;


3, movement is linear, minimal false breakout and shakeout

# I would be guessing at a relatively tight regression channel or standard deviation channel, where you'd count how many times price went outside the channel, but maybe you could clarify.
Do you have any thoughts on filter out the stocks been trading range bound in past 52 week?
say price is bouncing roundtrip from 30 to 50

ZgQamX9.png
kHpLnCg.png


Just better example of choppiness vs clean movement

how do you define the movement is more clean than other
 

Attachments

  • ZgQamX9.png
    ZgQamX9.png
    35.7 KB · Views: 734
Last edited by a moderator:
Do you have any thoughts on filter out the stocks been trading range bound in past 52 week?
say price is bouncing roundtrip from 30 to 50
What?! Do you realize that a bounce from 30 to 50 (is a 66.66..% move)? Please send me all the stocks you find that make repeated 66.66% price moves over the course of the year.

That said, one thing you can do is to make sure that the price isn't "inside" a prior trading range. Since you appear to be looking for up-trending stuff, you can scan for a certain number of two-up weekly bars across the last 52 weeks. (For definition of two-up, just search this forum (or the Internet for #theStrat.) This scan makes sure that at least 30 of the last 52 weeks broke the high of their prior week. I think that would break "range-bound" for you.

Code:
# Weekly Time Frame
input length = 52;
input target = 30;
def twoUp = high > high[1] && low >= low[1];
def countTwoUp = SUM(twoUp, length);
plot scan = countTwoUp >= target;

Here's one of the stocks from that scan, I think that would qualify.


I99Wpsu.png


ZgQamX9.png
kHpLnCg.png


Just better example of choppiness vs clean movement

how do you define the movement is more clean than other

Please note: For clarity I tend to consult the higher time frames. Higher time frames are usually less choppy, and the trends tend to be stronger.

That said, it might help to scan for things with less volatility on a per-candle basis. (That is, smaller range as a percentage of the price.)

The example below is for the daily time frame. If you're using smaller time frames, then you could test out smaller percentage numbers.

You could combine this with your uptrending scans (such as moving average filters). (Note that 1.5% of daily stock price is a relatively small range, and depending on what you scan, can turn up few symbols.)


Code:
input length = 252; #period
input maxRangePer = .015;  # 1.5% cap, adjust as necessary
def range = high - low;
def rangeper = range/close; # range is what fraction of the close?
def averageRangePer = Average(rangeper, length); #Average fraction over period

plot scan = averageRangePer <= maxRangePer;
 

Attachments

  • ZgQamX9.png
    ZgQamX9.png
    35.7 KB · Views: 723
Has anyone developed a way to avoid choppy days or lock on to trend following stocks? I have trend following strategies that I like, but choppy days are devastating.

Are there basic secrets to avoiding chop that are commonly known that I may be missing? Humbly asking. Thanks.
 
Sorry after reading many threads about this topic, please correct me if I am wrong that:

Fractal Energy = CHOP Index ??

RSI Laguerre + Fractal Energy = RSI Laguerre + CHOP Index ??

Expansion Contraction Indicator (ECI) = Fractal Energy ??
 
Last edited by a moderator:
Sorry after reading many threads about this topic, please correct me if I am wrong that:

Fractal Energy = CHOP Index ??

RSI Laguerre + Fractal Energy = RSI Laguerre + CHOP Index ??

Expansion Contraction Indicator (ECI) = Fractal Energy ??
Just because they have 'fractal' in their name does not mean they have the same definitions or uses.

The Fractal Linear Energy (FLE) aka Chop Index uses fractal energy to look for chop.

The RSI Laguerre uses a totally different FE calc to refine its definition of momentum. It is used as follows:
FE is a gauge of both mean reverting and linearity. Descending readings indicate a trend is on. A reading below .3 indicates exhaustion in trend or near exhaustion. A reading above .6 indicates moving sideways with rapid reversion and energy building for a move again.

Above .6 - Think price compression or squeeze
Below .3 - Think running out of gas
The utilization of Fractals in Technical Analysis is an advance concept. No one can explain it better than Mobius does in the below script.
It is important to note:
  • Fractal Energy isn't an indicator - it's a way of looking at price to see if it's linear or random.
  • FE does not indicate direction at all.
  • It simply shows linearity or non-linearity
The ECI uses a Gaussian filter and looks at contraction and probably is best at defining 'choppy' periods. But it does not look at all choppy periods.
It looks for contraction in hopes of identifying the next expansion.

Here are other ways that members identify chop:
https://usethinkscript.com/threads/...contraction-congestion-for-thinkorswim.11512/

## OneNote Archive Name: RSI_Laguerre With FE_AutoAdj_v2018_10_12_Mobius_JQvisuals

## Archive Section:

## Suggested Tos Name: RSI_LaguerreWithFE_AutoAdj_v2018_10_12_Mobius_JQvisuals

## Archive Date: 5.15.2018

## Archive Notes:


## "##" indicates an addition or adjustment by the OneNote Archivist


## Modified Code Follows

## 5.15.2018 JQ added code to permit user to disable bull and or bear alerts

## 5.19.2018 JQ added AddChartBubbble code on FE plot

## 9.19.2018 JQ added color to RSI Line

## 10.9.2018 JQ added FE dots

## 10.12.2018 JQ added takevaluecolor statements


# RSI in Laguerre Time Self Adjusting With Fractal Energy

# Mobius

# V03.06.15.2016

# Both Fractal Energy and RSI are plotted. RSI in cyan and FE in yellow. Look for trend exhaustion in the FE and a reversal of RSI or Price compression in FE and an RSI reversal.


## Lounge Notes

#15:51 Mobius©: Short trade setup I look for with RSI Laguerre adjusted with FE.

#1) Polarity Change - Equity has gone from making higher highs and higher lows to making a lower high and lower low and is now putting in another lower high

#2) RSI Laguerrer is above .8 and descending from 1

#3) Fractal Energy is below .38 and nose down or above .6 and rolling over. In the first case, below .38, FE is indicating trend exahustion and RSI is likely showing as a peak and not running across pegged at 1. In the second case Price has risen to a lower resistance and has been rolling slowly over building energy.


#Mobius©: I use a very simple method – RSI Laguerre and Fractal Energy on a list of very liquid stocks. I look for polarity change and trade when both RSI and FE are in “confluence”. If volatility is high enough I sell spreads if not I buy them. Other than hedging (which I do a lot of) that's it. I like it simple.


#The typical base setting I like to use for the FE is a length of 8. If I'm trading options I like to look at it about the length of time I'm buying or selling the option for. I want to know if it's reverting and where the energy is so I'll use a longer length for reversion and a shorter length to see if energy is building or waning.


#If RSI Laguerre is descending and FE over .6, that tells me something is changing and I'm already looking at an equity I've determined is about to make a polarity change. So the worse case that happens is that the security grinds sideways for a few days.


#A reading of the FE over .6 is an indication that energy has been built up. If the FE is high (over .6) and RSI LaGuerre is breaking lower FE will follow suit. If RSI reverses and goes above .8 I'm outa there, with the assumption I have a short position.


#FE is a gauge of both mean reverting and linearity. Descending readings indicate a trend is on. A reading below .3 indicates exhaustion in trend or near exhaustion. A reading above .6 indicates moving sideways with rapid reversion and energy building for a move again.


#Above .6 - Think price compression or squeeze

#Below .3 - Think running out of gas


# Here's an example:

#FE at 60 periods is oscillating around .5 tightly while FE at 8 periods is over .6. Zscore is over 2 and is starting to roll over. That is a good short to the mean.


#Short trade setup I look for with RSI Laguerre adjusted with FE.


#1) Polarity Change - Equity has gone from making higher highs and higher lows to making a lower high and lower low and is now putting in another lower high


#2) RSI Laguerrer is above .8 and descending from 1


#3) Fractal Energy is below .38 and nose down or above .6 and rolling over. In the first case, below .38, FE is indicating trend exahustion and RSI is likely showing as a peak and not running across pegged at 1. In the second case price has risen to a lower resistance and has been rolling slowly over building energy.


# Labels below added by Johnny Quotron based on zztop notes above 2018-04-11


def FE = gamma;

#addlabel (FE < .382, " FE is Linear (Price Trending) = " + FE, Color.light_GREEN);

#addlabel (FE > .618, " FE is Non-Linear/Random (Trendless) = " + FE, Color.Light_GRAY);

#addlabel (FE <= .618 and FE >= .382, " FE is transitioning = " + FE, Color.Light_orange);

#AddChartBubble(!IsNaN(close) and IsNaN(close[-1]), FE, if FE < .382 then "Trending" else "Not Trending", Color.WHITE, yes);

#AddChartBubble(!IsNaN(close) and IsNaN(close[-1]), FE, if FE < .382 then "Trending" else if FE < .618 then "Transitioning" else "Building Energy", gamma.#takeValueColor(), yes); ## 5.19.2018 JQ


# End Code RSI_Laguerre Self Adjusting with Fractal Energy


# Fractal Linear Energy

# Mobius

# 5.16.2016

# zztop Notes


# This indicator does NOT indicate OB or OS but linear or non-linear

# The closer to 1 the more non-linear (compressed or random) price is.

# The closer to 0 the more linear (trending) price is.


# Fractal Energy isn't an indicator - it's a way of looking at price

# to see if it's linear or random. There are NO trading signals on the

# FE study. Only signals NOT to trade.

#

# If the FE is at extremes, something is about to change. It's leading

# you to a conclusion. If the FE is below .382, price is parabolic and

# cannot maintain that. But you may not want to sell because it may

# still go further in it's trend and it may not change direction right

# away. It's telling you though that it's not going to stay trending

# at the current rate of speed. If it's over .618 it telling you price

# is compressing and going sideways rebuilding energy getting ready for

# another run one way ot the other.

#

# Using price in fractals and different times, or ORB with FE and

# supertrend or some way to measure when price expansion is contracting

# or expanding is all you need. Any more than that and you'll be

# paralyzed by information overload

#

# FE does not indicate direction at all. It simply shows linearity or

# non-linearity. Trend or non-trend. It has nothing that determines

# which way trend is going, as in up or down.

#

# Lets say you want to buy ABC company. FE on a monthly, weekly and daily

# shows values of 40, 35 and 30. Price is showing lower lows but random
# lower high. You would know ABC company is close to selling exhaustion

# and it's time to look for a few higher highs to a near term fractal

# pivot then look for short reversal to a higher low over the previous

# recent low and when the bars start setting high highs and lower lows

# again it's time to go long. The FE is what tells you to start looking

# for those signals
 
Last edited:
Most of 'Chop, Sideways, Consolidation, Contraction, Congestion' indicators display similar data: the zones where price lacks trend, momentum, volume, and direction; basically just lying there like a dead fish, not going anywhere ;).

What you use depends on what works best with your strategy, how much lower chart real estate you have available versus how cluttered you like your upper chart, and so on and so on.
Which indicator appearance appeals to you most? And whether the additional data provided besides the chop points is of interest to you.

Here are the forum indicators written specifically to identify Chop / Sideways action:
https://usethinkscript.com/search/816383/?q=chop*&t=post&c[child_nodes]=1&c[nodes][0]=3&c[title_only]=1&o=replies
https://usethinkscript.com/threads/indicator-to-identify-a-sideways-market.10878/
https://usethinkscript.com/threads/finding-stocks-on-sideways-trend.3878/


Looking for Consolidation is the most common way members identify chop on the forum:
https://usethinkscript.com/threads/...ipts-to-detect-periods-of-consolidation.1159/
https://usethinkscript.com/threads/john-carters-squeeze-pro-indicator-for-thinkorswim-free.4021/
https://usethinkscript.com/threads/eci-gaussian-indicator-for-thinkorswim.1160/
https://usethinkscript.com/threads/...kout-breakdown-indicator-for-thinkorswim.103/
https://usethinkscript.com/threads/...n-lack-of-directional-momentum-indicator.404/
https://usethinkscript.com/threads/macd-label-count-consecutive-histogram-bars.8265/#post-77970
https://usethinkscript.com/threads/bull-bear-absolute-strength-indicator-for-thinkorswim.11160/
https://usethinkscript.com/threads/congestion-zone.10503/
https://usethinkscript.com/threads/gaussian-rainbow-ma-indicator-for-thinkorswim.279/


Contraction / Squeeze
https://usethinkscript.com/threads/...m-no-trend-signal-e-g-in-adx.8132/#post-77140
These Squeeze Indicators use the narrowing of bands to determine that a price is in chop. You can start with plugging and playing the ToS TTM Squeeze:
https://usethinkscript.com/threads/ttm-squeeze-format-scan-watchlist-label-for-thinkorswim.2751/
If you find it of value and want to see more, here are the most popular Custom Squeeze studies:
https://usethinkscript.com/threads/how-to-anticipate-an-all-day-squeeze.6579/
https://usethinkscript.com/search/8...1&c[nodes][0]=3&c[title_only]=1&o=replies&g=1
Can any of these Sideways/Chop and Consolidation indicators be made into scanners where you can adjust the days in consolidation/ sideways and the % moved in that time period? For ex. looking for 5 days of consolidation that has moved 2% up or down in that period.

I'm happy to finally join since I've found and used some of thinkscripts formulas. I did have a question which you may know the answer to. Is there an easier way to search for specific categories? It all seems mixed up and was wondering if there were sections for what people are specific looking for. I've searched and it seems like there are three major categories people talk, Indicators, Scanners, and Watchlists. Is there specific forums for indicators, another for scanners and a third for watchlists? If not I'd feel like this could greatly help searches. I ask because I've had trouble finding consolidation scanners, chop/sideways scanners, squeeze/contraction scanners. I know you posted a good one on june 6th with a ton of links which is great but most were indicators for charts. Is there something similar but for the scanners?
Thanks for your amazing help with this community
 
Last edited by a moderator:
Can any of these Sideways/Chop and Consolidation indicators be made into scanners where you can adjust the days in consolidation/ sideways and the % moved in that time period? For ex. looking for 5 days of consolidation that has moved 2% up or down in that period.

I'm happy to finally join since I've found and used some of thinkscripts formulas. I did have a question which you may know the answer to. Is there an easier way to search for specific categories? It all seems mixed up and was wondering if there were sections for what people are specific looking for. I've searched and it seems like there are three major categories people talk, Indicators, Scanners, and Watchlists. Is there specific forums for indicators, another for scanners and a third for watchlists? If not I'd feel like this could greatly help searches. I ask because I've had trouble finding consolidation scanners, chop/sideways scanners, squeeze/contraction scanners. I know you posted a good one on june 6th with a ton of links which is great but most were indicators for charts. Is there something similar but for the scanners?
Thanks for your amazing help with this community

Welcome @DevBar
The 1st post in this thread has a list of all the consolidation, chop/sideways, squeeze/contraction indicators.
To find the scanners for those indicators, follow these instructions:
https://usethinkscript.com/threads/answers-to-commonly-asked-questions.6006/#post-58238
 

Not the exact question you're looking for?

Start a new thread and receive assistance from our community.

87k+ Posts
426 Online
Create Post

The Market Trading Game Changer

Join 2,500+ subscribers inside the useThinkScript VIP Membership Club
  • Exclusive indicators
  • Proven strategies & setups
  • Private Discord community
  • ‘Buy The Dip’ signal alerts
  • Exclusive members-only content
  • Add-ons and resources
  • 1 full year of unlimited support

Frequently Asked Questions

What is useThinkScript?

useThinkScript is the #1 community of stock market investors using indicators and other tools to power their trading strategies. Traders of all skill levels use our forums to learn about scripting and indicators, help each other, and discover new ways to gain an edge in the markets.

How do I get started?

We get it. Our forum can be intimidating, if not overwhelming. With thousands of topics, tens of thousands of posts, our community has created an incredibly deep knowledge base for stock traders. No one can ever exhaust every resource provided on our site.

If you are new, or just looking for guidance, here are some helpful links to get you started.

What are the benefits of VIP Membership?
VIP members get exclusive access to these proven and tested premium indicators: Buy the Dip, Advanced Market Moves 2.0, Take Profit, and Volatility Trading Range. In addition, VIP members get access to over 50 VIP-only custom indicators, add-ons, and strategies, private VIP-only forums, private Discord channel to discuss trades and strategies in real-time, customer support, trade alerts, and much more. Learn all about VIP membership here.
How can I access the premium indicators?
To access the premium indicators, which are plug and play ready, sign up for VIP membership here.
Back
Top