#// This Pine Script™ code is subject to the terms of the Mozilla Public License 2.0 at https://mozilla.org/MPL/2.0/
#// © syntaxgeek
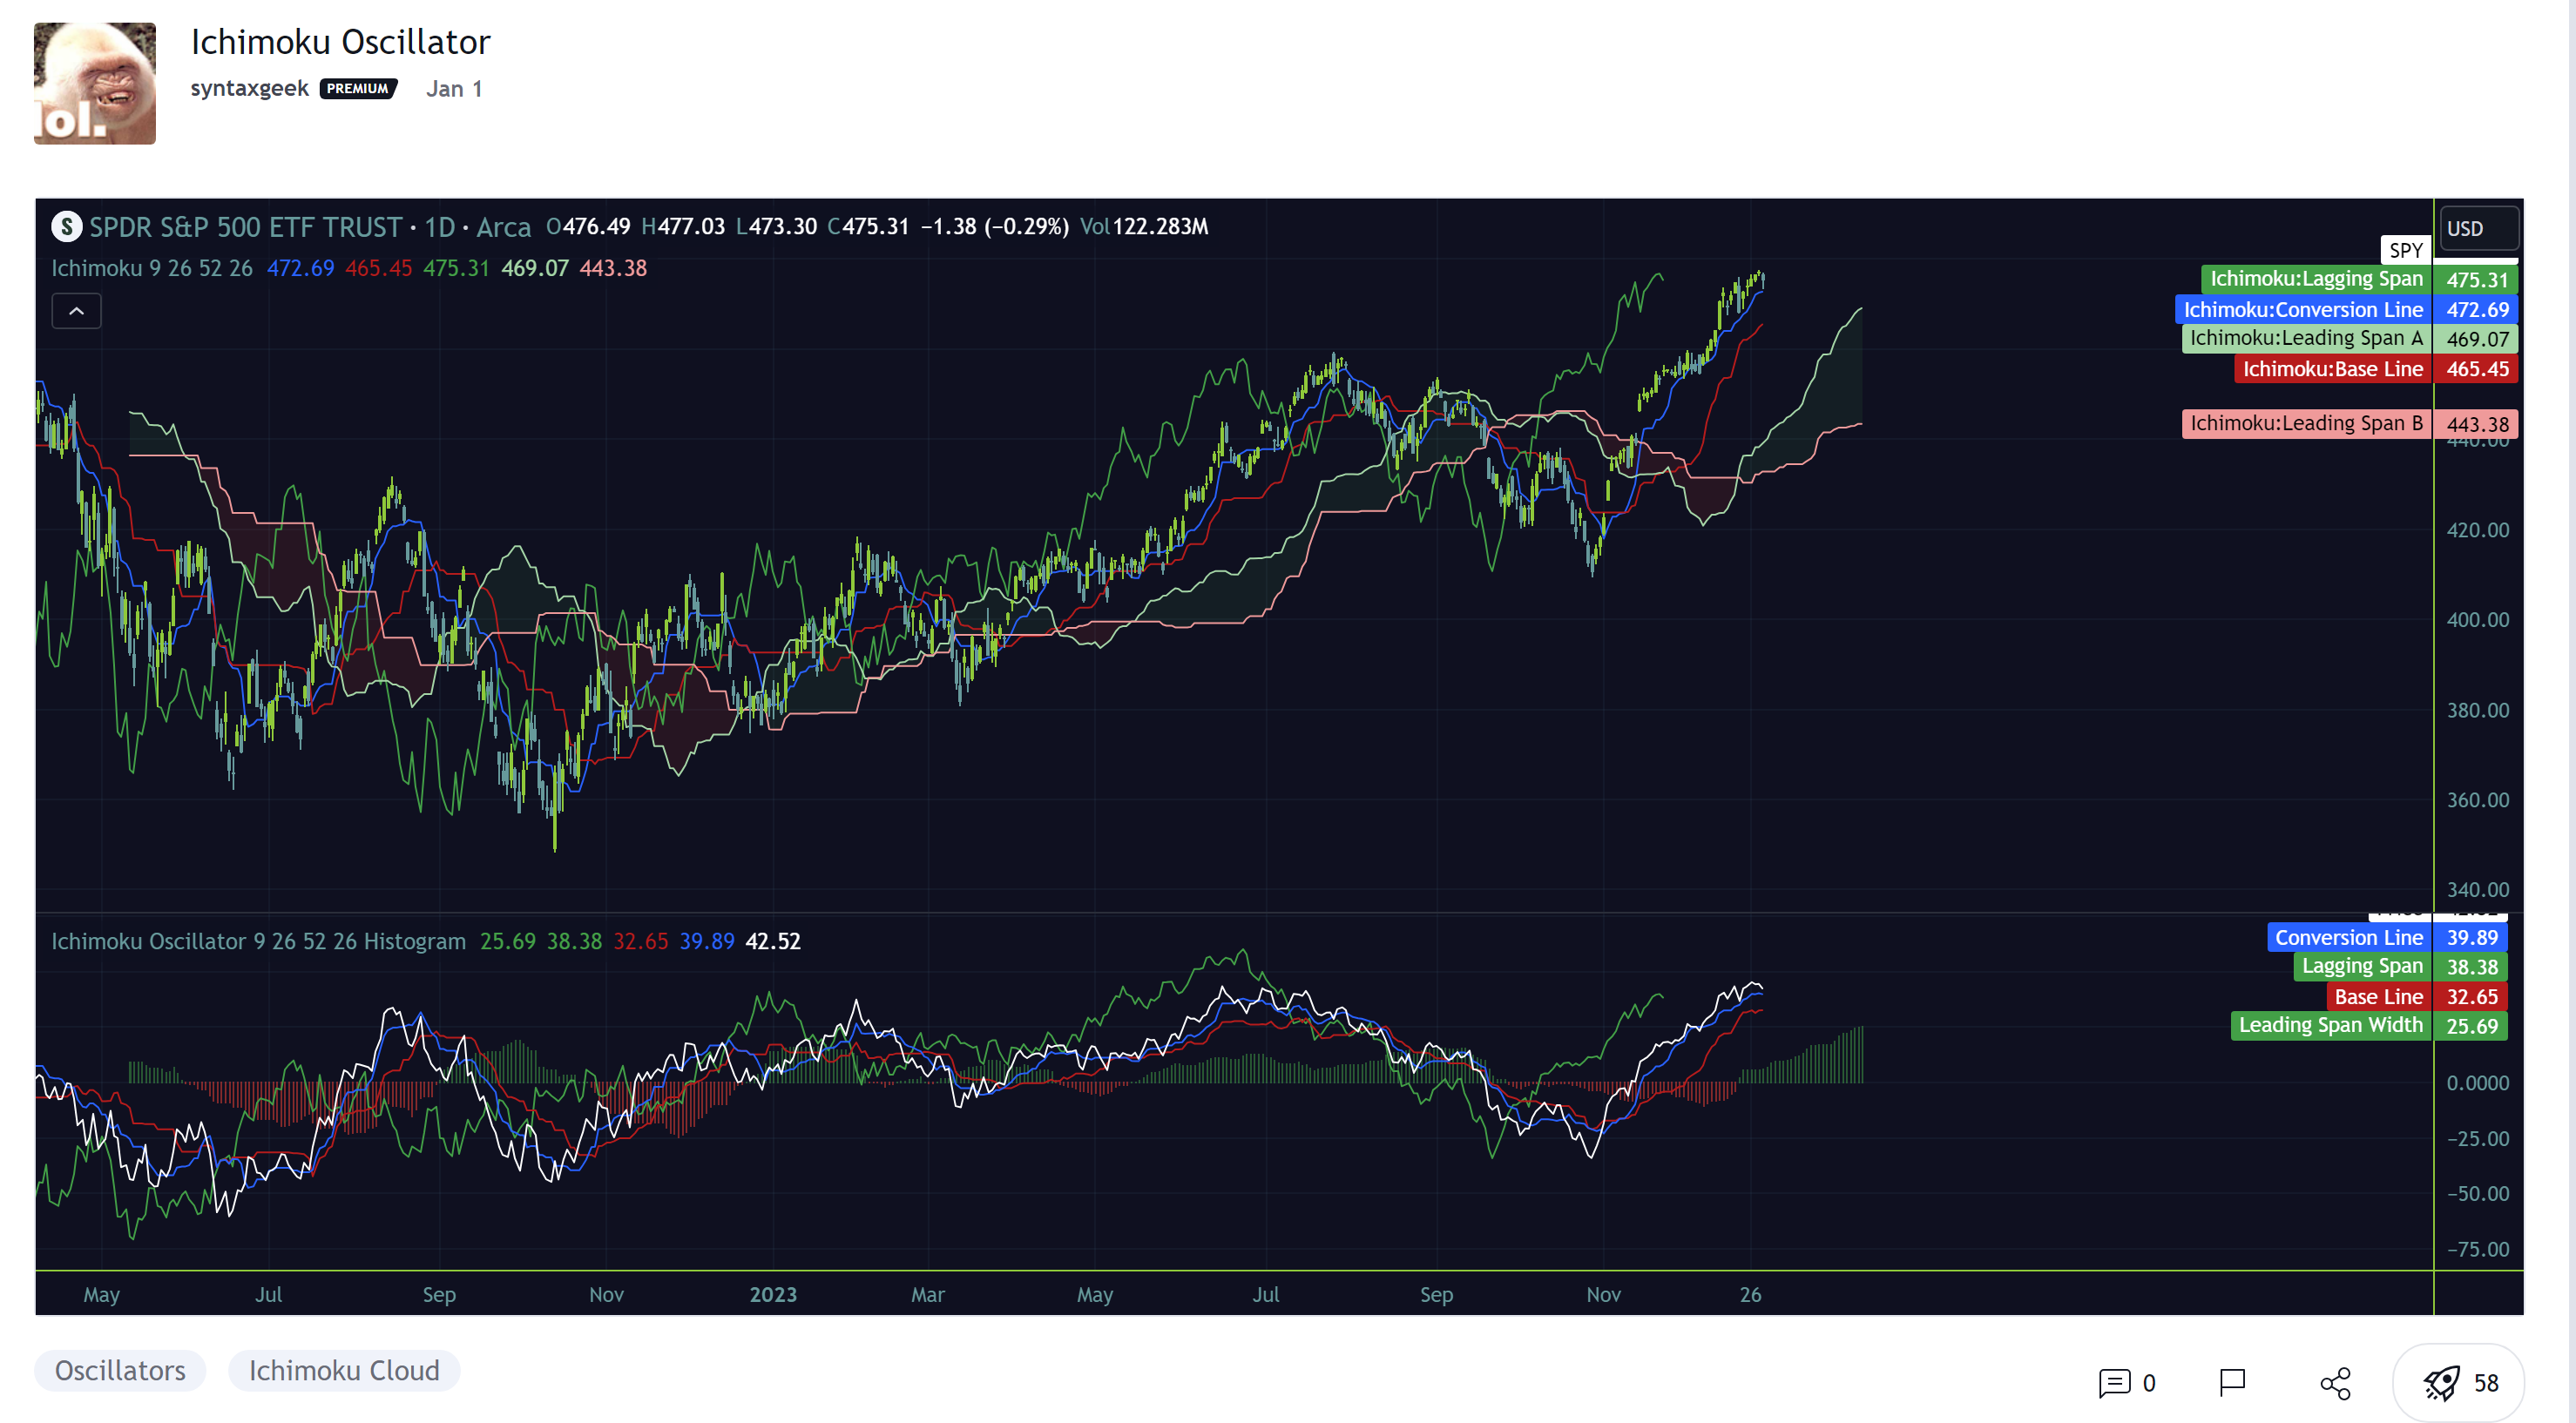
#indicator("Ichimoku Oscillator")
# Converted by Sam4Cok@Samer800 - 01/2024
declare lower;
input ConversionLineLength = 9;#, minval=1, title="Conversion Line Length")
input BaseLineLength = 26;#, minval=1, title="Base Line Length")
input LeadingSpanBLength = 52;#, minval=1, title="Leading Span B Length")
input LaggingSpan = 26;#, minval=1, title="Lagging Span")
input CloudFormat = { default "Histogram", "Filled (Classic)"}; # 'Cloud Format'
def na = Double.NaN;
def v_showHistoPlot = CloudFormat == CloudFormat."Histogram";
def v_showFillPlots = CloudFormat == CloudFormat."Filled (Classic)";
DefineGlobalColor("leadUp", Color.DARK_GREEN);#CreateColor(67, 160, 71));
DefineGlobalColor("leadDn", Color.DARK_RED);#CreateColor(244, 67, 54));
DefineGlobalColor("lag", Color.GREEN);
DefineGlobalColor("base", Color.RED);
DefineGlobalColor("conv", CreateColor(41,98,255));
DefineGlobalColor("price", Color.WHITE);
#// { funcs
script f_donchian {
input len = 9;
def hh = Highest(high, len);
def ll = Lowest(low, len);
def don = (hh + ll) / 2;
plot out = don;
}
#// original ichimoku calculations
def v_conversionLine = f_donchian(ConversionLineLength);
def v_baseLine = f_donchian(BaseLineLength);
def v_leadLine1 = (v_conversionLine + v_baseLine) / 2;
def v_leadLine2 = f_donchian(LeadingSpanBLength);
#// calculate absolute difference between span a and b
def v_leadDiff = AbsValue(v_leadLine1 - v_leadLine2);
#// determine whether difference should be negative or positive depending on span a and b orientation
def v_leadDiffComparison = (if v_leadLine1[LaggingSpan - 1] > v_leadLine2[LaggingSpan - 1]
then v_leadDiff[LaggingSpan - 1] else -v_leadDiff[LaggingSpan - 1]);
#// adjust price line to scale with span difference
def v_close = close - v_leadLine1[LaggingSpan - 1] + v_leadDiffComparison;
#// adjust displaced price lagging line to scale with twice displaced span a and adjust for span twice displaced difference
def v_laggingSpan = close - v_leadLine1[(LaggingSpan * 2) - 1] + v_leadDiffComparison[LaggingSpan - 1];
#// adjust displaced base line to scale with displaced span a and adjust for span difference
def v_baseLineAdjusted = v_baseLine - v_leadLine1[LaggingSpan - 1] + v_leadDiffComparison;
#// adjust displaced conversion line to scale with displaced span a and adjust for span difference
def v_conversionLineAdjusted = v_conversionLine - v_leadLine1[LaggingSpan - 1] + v_leadDiffComparison;
#// } vars
#// { plots
def spanWidth = if v_leadLine1 > v_leadLine2 then v_leadDiff else -v_leadDiff;
def spanA = if !v_showFillPlots then na else if v_leadLine1 > v_leadLine2 then v_leadDiff else 0;
def spanB = if !v_showFillPlots then na else if v_leadLine1 < v_leadLine2 then -v_leadDiff else 0;
plot Lagging = v_laggingSpan[-(LaggingSpan) + 1]; # "Lagging Span"
plot BaseLine = v_baseLineAdjusted; # "Base Line"
plot ConvLine = v_conversionLineAdjusted; # "Conversion Line"
plot price = v_close; # "Price"
Lagging.SetDefaultColor(GlobalColor("lag"));
BaseLine.SetDefaultColor(GlobalColor("base"));
ConvLine.SetDefaultColor(GlobalColor("conv"));
price.SetDefaultColor(GlobalColor("price"));
plot spanHist = if !v_showHistoPlot then na else spanWidth[LaggingSpan - 1]; # 'Leading Span Width'
spanHist.SetPaintingStrategy(PaintingStrategy.SQUARED_HISTOGRAM);
spanHist.AssignValueColor(if v_leadLine1[LaggingSpan - 1] > v_leadLine2[LaggingSpan - 1]
then GlobalColor("leadUp") else GlobalColor("leadDn"));
AddCloud(if !v_showFillPlots then na else spanWidth[LaggingSpan - 1], 0, GlobalColor("leadUp"), GlobalColor("leadDn"), yes);
#-- END of CODE