IBD Stock Charts Style and Scan for ThinkorSwim

Join useThinkScript to post your question to a community of 21,000+ developers and traders.

Here is a more accurate way to calculate the IBD Relative Price Strength but I don't know how to write the code.
(((2*(c/c63)+(c/c126)+(c/189)+(c/252))/4)
I probably don't have the parenthesis set up correctly?
This code would give a more accurate representation of the RPS do to it being "weighted" in the first variable "(2*(c/63))"
Thanks for your help in coding this RPS formula.
 
Another way to represent the current RPS would be to calculate the RPS from the day of a significant low on the SPX.
The two most recent major lows on the SPX were on 6/3/19 and 12/24/18.
What is the code to calculate how many "market days" ago these major lows occurred?
Here is a webpage that will calculate the number of business days between two given dates.
https://www.timeanddate.com/date/workdays.html?d1=3&m1=6&y1=2019&d2=24&m2=9&y2=2019&ti=on&June 3rd was 79 days ago so we can change the value from 252 to 79 to see the RPS from the SPX low on June 3d.
 
Here is a more accurate way to calculate the IBD Relative Price Strength but I don't know how to write the code.
(((2*(c/c63)+(c/c126)+(c/189)+(c/252))/4)
I probably don't have the parenthesis set up correctly?
This code would give a more accurate representation of the RPS do to it being "weighted" in the first variable "(2*(c/63))"
Thanks for your help in coding this RPS formula.
@arthurx I do need to revisit this, it just may be a while. I was thinking of something akin to this:
2*(c/c63)+1.25*(c/c126)+(c/c189)+0.75*(c/c252) then /4. I just don't know. I've been tied up for a while and will continue to be.

I have a few trials in Market Watch Columns that show quite a different take on the work I have done.
The release of the variations should be released by end of October. One of the codes uses too much data and I run over the limit.

If anyone would like to throw their code at the wall to see if it sticks, please feel free to do so! :) I'm sure @MBF has some ideas!!:eek:
My idea is, I stick with learning to day trade and stop getting mixed up in AP Calculus!
🧠 🔥
 
@markos Just wanted to express my thanks to you for all of your efforts in the uTS community and posting this excellent scan/watchlist. It may not be the exact replica of the original IBD list, but it sure provides some interesting "picks". NEE looks like a rocket to ride tomorrow and for the foreseeable future :cool:

Good Luck and Good Trading...
 
@markos Just wanted to express my thanks to you for all of your efforts in the uTS community and posting this excellent scan/watchlist. It may not be the exact replica of the original IBD list, but it sure provides some interesting "picks". NEE looks like a rocket to ride tomorrow and for the foreseeable future :cool:
Good Luck and Good Trading...
@netarchitech thanks for the kind words. That means a lot to me. It has been bothering me for years not having some point of reference.
NEE has good possibilities, just remember that is supposed to act like a stodgy old Utility and one day it will again.

As I mentioned in a post above, I have three proxies running side by side in my watchlist. The current one from above and two others i'm testing.
They may be as late as late Oct., Nov. Good trading and good fortune to you as well.
 
@markos
NEE has good possibilities, just remember that is supposed to act like a stodgy old Utility and one day it will again.
Point well taken...With that said, looking at a twenty year monthly chart, check out the AZO rocket that blasted off a while back and it's still going... In fact, it's gone from 650 to 1100 in the last year and a half! BKNG (formerly PCLN) is another prime example... Of course, there's Amazin' AMZN, but that's been ranging for the last year or so... Alas, like all rockets these too will run out of fuel at some point and gravity will take hold. Until then, stand back in amazement or, better yet, jump on...sky's the limit :D

In closing, I look forward to seeing what develops in late October / November. Thanks again for your efforts/contributions... It is most definitely much appreciated :)

Good Luck and Good Trading...
 
@netarchitech thanks for the kind words. That means a lot to me. It has been bothering me for years not having some point of reference.
NEE has good possibilities, just remember that is supposed to act like a stodgy old Utility and one day it will again.

As I mentioned in a post above, I have three proxies running side by side in my watchlist. The current one from above and two others i'm testing.
They may be as late as late Oct., Nov. Good trading and good fortune to you as well.
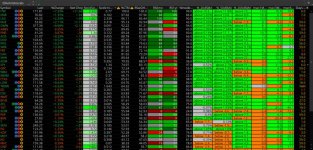
Ok, it's the End of October! 🥳 Here is a share link to 5 Different Relative Strength Indicators that also includes my watchlist setup.
https://tos.mx/xCZKBN9

Below the picture are the codes for the individual columns.
For those that will test this, please give it a good workout and provide feedback on the column that works best for you.

@BenTen @mc01439 @Hguru @skynetgen @korygill @dougn @diazlaz @Shinthus @MBF @netarchitech @arthurx @Nick
Apologies to anyone I missed.

UkTrpO2h.jpg

Here are the 5 Relative Strength Studies in the Picture Above:

Column #1:

%CTM - Chande Trend Meter is a Scan, Column, and Lower Study. https://tos.mx/az08ZJg This can be found in school.stockcharts.com

Code:
# %CTM_Chande_Trend_Meter Scan ported in TSL by Mobius per request
#declare lower;
def h = high;
def l = low;
def c = close;
script Scale {
    input c = close;
    input Min = 0;
    input Max = 100;
    def hh = HighestAll(c);
    def ll = LowestAll(c);
    plot Range = (((Max - Min) * (c - ll)) /  (hh - ll)) + Min;
}
script BB
    {
    input price = close;
    input length = 20;
    def avg = Average(price, length);
    def sd = StDev(price, length);
    def upperBand = avg + (2 * sd);
    def lowerBand = avg - (2 * sd);
    plot PercentB = (price - lowerBand) / (upperBand - lowerBand) * 10;
}
def BB20H = BB(h, 20);
def BB20L = BB(l, 20);
def BB20C = BB(c, 20);
def BB50H = BB(h, 50);
def BB50L = BB(l, 50);
def BB50C = BB(c, 50);
def BB75H = BB(h, 75);
def BB75L = BB(l, 75);
def BB75C = BB(c, 75);
def BB100H = BB(h, 100);
def BB100L = BB(l, 100);
def BB100C = BB(c, 100);
def zScore = ((c - Average(c, 100)) / StDev(c, 100)) * 10;
def RSI = RSI() / 10;
def PriceChannel = ((c - Lowest(l, 2)) / (Highest(h, 2) - Lowest(l, 2))) * 10;
def sum = BB20H + BB20L + BB20C + BB50H + BB50L + BB50C + BB75H + BB75L + BB75C + BB100H + BB100L + BB100C + zScore + RSI + PriceChannel;
plot CTM = scale(sum);
#plot "90" = if isNaN(c) then double.nan else 90;
#plot "80" = if isNaN(c) then double.nan else 80;
#plot "60" = if isNaN(c) then double.nan else 60;
#plot "20" = if isNaN(c) then double.nan else 20;
# End Code CTM

Column #2:
My Weighted RS Script https://tos.mx/mpjIxjA
Code:
#09:56 Dave_S: # October 9 2019 in TSL
# Hi markos: here's is your repaired script; It still throws complex code warning.
# 07:38 markos: Good Morning. I am attempting to create my own version of a RS Rating watchlist column that is weighted to the latest 3 months.  This little code throws a complex script warning. What can be done to simplify it? Loooking for suggestions. Thanks!
#MYexpRS3 by Markos chgd title to RSwQH3qY 10-2019
#The idea here is a hack to create a Weighted Relative Strength per the math in Def Data2.

#declare lower;

input lengthYR = 252;
input length3QTRs = 189;
input lengthHalfYr = 126;
input lengthQTR = 63;
input lengthWk = 6;
input mid = 50;

  def C252 = Average(close, lengthYR);
  def C189  = Average(close, length3QTRs);
  def C126  = Average(close, lengthHalfYr);
  def C63  = Average(close, lengthQTR);
  def C6 = Average(close, lengthWk);

# def Data1 = close / close("ITOT");
def Data1 = close / Average(close, 6);
# def Data2 = (((2*(c/c63))+(1.25*(c/c126))+(c/c189)+(0.75*(c/c252)))/4);
def Data2 = (((2*(close/c63))+(1.00*(close/c126))+(0.75*(close/c189))+(0.50*(close/c252)))/4);
#def Data2 = (((5*(close/c63))+(3.00*(close/c126))+(1.00*(close/c189))+(0.25*(close/c252)))/4);
def Data3 = Data1 * Data2;
def newRngMin = 1;
def newRngMax = 100;
def HHData3 = HighestAll( Data3);
def LLData3 = LowestAll( Data3 );
plot nr = ((( newRngMax - newRngMin ) * ( Data3 - LLData3 )) / ( HHData3 - LLData3 )) + newRngMin;
#plot midline = mid;
#End MyexpRS3 Markos chgd title to RSwQH3qY 10-2019

Column #3:
https://tos.mx/f8FS7hd RS 6 Month Column

Code:
#WLC_RS6mo
#RS_Rank - 8/28/2019 Developed by GHorschman  ([email protected])
#######################################################################
# This is a custom quote to compute the Relative Strength percentile.
# It is calculated the same way that IV_Percentile is computed.  Just
# change the length to specify the time frame of interest.  The
# background color is tied to the following ranges:
#
#    RS_Rank > 80       -- Dark Green
#    80 <= RS_Rank < 60 -- Light Green
#    60 <= RS_Rank < 40 -- Gray
#    40 <= RS_Rank < 20 -- Light Red
#    RS_Rank <= 20      -- Dark Red
######################################################################

# Set length to period of interest.

#  1 Wk – 5 trading days
#  1 Mos – 21 Days
#  3 Mos – 63 Days
#  6 Mos – 126 Days
#  12 Mos – 252 Days

def length = 126;

#def RS = if IsNan(relativeStrength("SPX")) then 0 else relativeStrength("SPX") ;
def RS = RelativeStrength ("ITOT");
def RSLow = Lowest(RS, length);
def RSHigh = Highest(RS, length);
def RSRank = round(100 * (RS - RSLow) / (RSHigh - RsLow),0);
addlabel (yes,RSRank);

#AddLabel (yes, if  RSRank >= 1 and RSRank < 100 then "000" + astext(RSRank) else astext( RSRank)   );

assignbackgroundcolor (if RSRank > 80 then color.dark_green else
                       if RSRank > 60 and RSRank <= 80 then createcolor(0,175,0) else
                       if RSRank > 40 and RSRank <= 60 then color.gray else
                       if RSRank > 20 and RSRank <= 40 then CreateColor(220, 0,0) else
                       if RSRank <= 20 then CreateColor(150, 0,0) else
                       color.white);
#End Code

Column #4:
https://tos.mx/BNYLITs RS 12 month Script

Code:
#WLC_RS1Yr
#RS_Rank - 8/28/2019 Developed by GHorschman  ([email protected])
#####################################
# This is a custom quote to compute the Relative Strength percentile.
# It is calculated the same way that IV_Percentile is computed.  Just
# change the length to specify the time frame of interest.  The
# background color is tied to the following ranges:
#
#    RS_Rank > 80       -- Dark Green
#    80 <= RS_Rank < 60 -- Light Green
#    60 <= RS_Rank < 40 -- Gray
#    40 <= RS_Rank < 20 -- Light Red
#    RS_Rank <= 20      -- Dark Red
######################################

# Set length to period of interest.

#  1 Wk – 5 trading days
#  1 Mos – 21 Days
#  3 Mos – 63 Days
#  6 Mos – 126 Days
#  12 Mos – 252 Days

def length = 252;

#def RS = if IsNan(relativeStrength("SPX")) then 0 else relativeStrength("SPX") ;
def RS = relativeStrength("ITOT"); #SPX is default
def RSLow = Lowest(RS, length);
def RSHigh = Highest(RS, length);
def RSRank = round(100 * (RS - RSLow) / (RSHigh - RsLow),0);
addlabel (yes,RSRank);

#AddLabel (yes, if  RSRank >= 1 and RSRank < 100 then "000" + astext(RSRank) else astext( RSRank)   );

assignbackgroundcolor (if RSRank > 80 then color.dark_green else
                       if RSRank > 60 and RSRank <= 80 then createcolor(0,175,0) else
                       if RSRank > 40 and RSRank <= 60 then color.gray else
                       if RSRank > 20 and RSRank <= 40 then CreateColor(220, 0,0) else
                       if RSRank <= 20 then CreateColor(150, 0,0) else
                       color.white);
#End Code

Column #5:
https://tos.mx/dqmp2K1 This was the iteration from page 1. It is Percent Inside 52 week range.

Code:
# Mobius© WLC Percent Inside 52 Week Range
def h = highest(high, 252);
def l = lowest(low, 252);
def x = (close - l) / (h - l); 
plot r = round(x * 100, 0);
#End Code

Please try out and see what works for you on your time frame!
 

Attachments

  • UkTrpO2h.jpg
    UkTrpO2h.jpg
    172.9 KB · Views: 344
Last edited:
Ok, it's the End of October! 🥳 Here is a share link to 5 Different Relative Strength Indicators that also includes my watchlist setup.
WARNING... Loading this probably will change your current Watchlist Set-Up!
TOS does NOT save Watchlist set-ups!
If you want your current set-up kept, please take a screen shot & download it so that it can be rebuilt.
https://tos.mx/xCZKBN9
For those that will test this, please give it a good workout and provide feedback.

UkTrpO2h.jpg
:unsure: :oops: 🥺😭
 
@markos thanks - for the watchlist, the share doesn't attach the studies and custom fields, as a chart. you will have to share each individual custom watchlist first, then add them , then import the watchlist. or you can add the code blocks for the custom lists in order to recreate the watchlist setup.
 
@markos thanks - for the watchlist, the share doesn't attach the studies and custom fields, as a chart. you will have to share each individual custom watchlist first, then add them , then import the watchlist. or you can add the code blocks for the custom lists in order to recreate the watchlist setup.
Thanks @diazlaz I'll look into that. I need to finish this up.
I will post each of the 5 RS indicators with their links below the screenshot up above.
 
Last edited:
thank you @markos - amazing work and orchestration. if you ever want to brainstorm in developing a trading plan around this and create a few plans and backtest them, count me in and i will invest time.
 
@diazlaz Here is the 20% column from TDA Twitter
Code:
#HINT: This is a custom watchlist column looking for xx% percent above or below moving average line. \n It provides a visual alert with the percent from MA line where you expect price to revert to the mean by reversing to return to the MA line.


## because this is a watchlist column there is no Edit box.  therefore def could have been used insted of input.  To change type of price and/or type of moving average, click on the word "Inspector" top right of this box and click on the word close or the word AverageType.SIMPLE and the Inspector will show you your other choices.
input price = close;
input length = 20;
input Average_Type = AverageType.SIMPLE;
input percent_from_MA = 1;


## these def or "define a new word to ThinkScript" did not have to be used, but it saved a lot of time and typing later in the code by providing ability to use the new "words" instead of typing the math formula multiple times in different lines later in the code

def Avg = MovingAverage(average_Type, price, length);
def MA_below_price = price > Avg;
def MA_above_price = price < Avg;
def percent_away = if MA_below_price or MA_above_price then (close / avg) - 1 else 0;


def oversold = percent_away * 100 <= percent_from_MA * (-1);
def overbought = percent_away * 100 >= (Percent_from_MA);


### AddLabel needs (1) condition to trigger it to be visible or the word yes if always visible, (2) text to appear in quotes + data to appear in the label, (3) color for the label which can be static color or can be dynamic using if __ then __ else ___

AddLabel(yes, if oversold then " below " + AsPercent(percent_away) else if overbought then " above " + AsPercent(percent_away) else AsPercent(percent_away), color.BLACK);
AssignBackgroundColor(if oversold then color.DARK_ORANGE else if overbought then color.GREEN else color.LIGHT_GRAY);


# end code ------------------
 
This is the 1 month return column.
Code:
#From TDA Twitter: 1 Month WLC
def stk = round(((close / close[21])-1)*100,1);
def bmark = round(((close("SPX") / close("SPX")[21])-1)*100,1);
def c = stk-bmark;
plot data =  stk;
data.AssignValueColor(color.BLACK);
AssignBackgroundColor (if  c > 0 then color.GREEN else if C < 0 then color.Dark_ORANGE else color.light_gray);
 
https://tos.mx/hfEeqh
NytzSNTl.jpg


Updated 9-5-19: In this shared Google Drive are 2 files:
1) a file comparison of yesterdays IBD Relative Strength direct from IBD, along with a listing of what the watchlist code reads for the same security. If you follow the stocks in IBD's 85-85 list, my hope is that you would find most of them ranked above 70 in the watchlist column.
2) the picture is of the watchlist code on the right on my screen shot of the same NASDAQ 100.

https://drive.google.com/drive/folders/13XOHAGuDNjx6k98U5VB8AL2TmQOjyQqS?usp=sharing

Here's the Code to put in a Custom Column:
Code:
#uTS Watchlist Code for %52WkRng
#Mobius© WLC Percent Inside 52 Week Range

def h = highest(high, 252);
def l = lowest(low, 252);
def x = (close - l) / (h - l);
plot r = round(x * 100, 0);

#4 lines is complete code#

Use whichever you would like! :)

Below is a scan that I came across that will pull the top 20% of Relative Strength stocks in a Scan of the S&P 500. After loading the scanned list, most were above the 75% line for the above chart's RS line. I also changed the inputs to 0 & 20 and the RS line on this chart was down on all on the list. I suggest scanning in S&P 100 or 500 to keep your list manageable. My thanks to Chris Baker.

Code:
# Scan - Price Rank in Range 80-100
# Edited by Markos to prove out scan for Relative Strength - Use is set for 1Yr-1Day Chart
# This Scan Tab study finds stocks whose price is in the given Price Rank (Price Percentile)
# in the given number of bars.
# By Chris Baker <[email protected]> @ChrisBaker97
# Latest version maintained at: https://bitbucket.org/ChrisBaker97/thinkscript/src/
# This thinkScript is designed for use in the Scan tab. Detailed
# instructions may be found at: https://bitbucket.org/ChrisBaker97/thinkscript/
#
# This work is licensed under the Creative Commons Attribution-ShareAlike
# 3.0 Unported License. To view a copy of this license, visit:
# http://creativecommons.org/licenses/by-sa/3.0/deed.en_US

#Start Code
input period = 252;
input prLo = 80;
input prHi = 100;

def hi = highest(high,period);
def lo =  lowest(low,period);
def range = hi - lo;

def priceRank = 100 * (open - lo) / range;

plot inRange = prLo <= priceRank and priceRank <= prHi;
#End Code
This is pretty dayum slick!
 

Similar threads

Not the exact question you're looking for?

Start a new thread and receive assistance from our community.

87k+ Posts
331 Online
Create Post

Similar threads

Similar threads

The Market Trading Game Changer

Join 2,500+ subscribers inside the useThinkScript VIP Membership Club
  • Exclusive indicators
  • Proven strategies & setups
  • Private Discord community
  • ‘Buy The Dip’ signal alerts
  • Exclusive members-only content
  • Add-ons and resources
  • 1 full year of unlimited support

Frequently Asked Questions

What is useThinkScript?

useThinkScript is the #1 community of stock market investors using indicators and other tools to power their trading strategies. Traders of all skill levels use our forums to learn about scripting and indicators, help each other, and discover new ways to gain an edge in the markets.

How do I get started?

We get it. Our forum can be intimidating, if not overwhelming. With thousands of topics, tens of thousands of posts, our community has created an incredibly deep knowledge base for stock traders. No one can ever exhaust every resource provided on our site.

If you are new, or just looking for guidance, here are some helpful links to get you started.

What are the benefits of VIP Membership?
VIP members get exclusive access to these proven and tested premium indicators: Buy the Dip, Advanced Market Moves 2.0, Take Profit, and Volatility Trading Range. In addition, VIP members get access to over 50 VIP-only custom indicators, add-ons, and strategies, private VIP-only forums, private Discord channel to discuss trades and strategies in real-time, customer support, trade alerts, and much more. Learn all about VIP membership here.
How can I access the premium indicators?
To access the premium indicators, which are plug and play ready, sign up for VIP membership here.
Back
Top