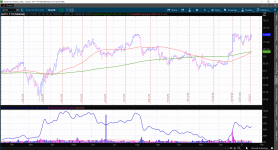
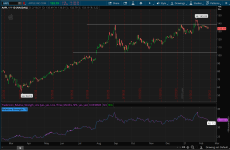
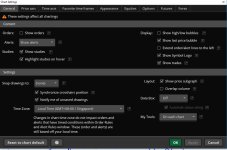
Below is the chart setup for ThinkorSwim inspired by IBD (Investor's Business Daily) stocks chart. Also, a watchlist column and the Relative Strength (RS) indicator.

Here's the Code to put in a Custom Watch List Column:
Shared Watch List Link: http://tos.mx/9VSRMyw
Click here for --> Easiest way to load shared links
Use whichever you would like!
Below is a scan that I came across that will pull the top 20% of Relative Strength stocks in a Scan of the S&P 500. After loading the scanned list, most were above the 75% line for the above chart's RS line. I also changed the inputs to 0 & 20 and the RS line on this chart was down on all on the list. I suggest scanning in S&P 100 or 500 to keep your list manageable. My thanks to Chris Baker.
Grid chart: https://tos.mx/hfEeqh

Here's the Code to put in a Custom Watch List Column:
Ruby:
#uTS Watchlist Code for %52WkRng
#Mobius© WLC Percent Inside 52 Week Range

def h = highest(high, 252);
def l = lowest(low, 252);
def x = (close - l) / (h - l);
plot r = round(x * 100, 0);
AssignBackgroundColor( if rs > 80 then color.dark_green else
                       if rs > 60 then createcolor(0,175,0) else
                       if rs > 40 then color.gray else
                       if rs > 20 then CreateColor(220, 0,0) else
                       if rs <= 20 then CreateColor(150, 0,0) else
color.white );Click here for --> Easiest way to load shared links
Use whichever you would like!
Below is a scan that I came across that will pull the top 20% of Relative Strength stocks in a Scan of the S&P 500. After loading the scanned list, most were above the 75% line for the above chart's RS line. I also changed the inputs to 0 & 20 and the RS line on this chart was down on all on the list. I suggest scanning in S&P 100 or 500 to keep your list manageable. My thanks to Chris Baker.
Code:
# Scan - Price Rank in Range 80-100
# Edited by Markos to prove out scan for Relative Strength - Use is set for 1Yr-1Day Chart
# This Scan Tab study finds stocks whose price is in the given Price Rank (Price Percentile)
# in the given number of bars.
# By Chris Baker <[email protected]> @ChrisBaker97
# Latest version maintained at: https://bitbucket.org/ChrisBaker97/thinkscript/src/
# This thinkScript is designed for use in the Scan tab. Detailed
# instructions may be found at: https://bitbucket.org/ChrisBaker97/thinkscript/
#
# This work is licensed under the Creative Commons Attribution-ShareAlike
# 3.0 Unported License. To view a copy of this license, visit:
# http://creativecommons.org/licenses/by-sa/3.0/deed.en_US

#Start Code
input period = 252;
input prLo = 80;
input prHi = 100;

def hi = highest(high,period);
def lo =  lowest(low,period);
def range = hi - lo;

def priceRank = 100 * (open - lo) / range;

plot inRange = prLo <= priceRank and priceRank <= prHi;
#End Code
Grid chart: https://tos.mx/hfEeqh
Relative Strength (RS) Line
Code:
# Plot the Relative Strength Line in ThinkorSwim
# Written by: @Diamond_Stocks @RayTL_ - TLScripts
# Site:     https://www.traderlion.com/ https://www.traderlion.com/tl-scripts/
# V1

# Declare Lower Places a study on the lower subgraph. This declaration is used when your study uses values that are considerably lower or higher than price history or volume values.
declare lower;

# User Inputs
input show_RSNHBP = yes;
input show_RSNH = yes;

#Relative Strength Type - Candlestick to be added later.
input graphStyle = {default "Line"};

#3 Month, 6 Month, 1 Year RS
input TimeFrame = {default "Three_Months", "Six_Months", "1_Year"};

#Index SymbolRelation
input CorrelationWithSecurity = "SPX";

#Calculation TimeFrame
def aggregationperiod = AggregationPeriod.DAY;

#Chart Normalized Relative Strength Rating on Last Bar
def isLastBar = BarNumber() == HighestAll(if !IsNaN(close) then BarNumber() else Double.NaN);

#Turn on or off Alerts when cycling charts
input Alerts_On = yes;

#Add Chart Bubbble to Graph
input RS_Rating_ChartBubble = yes;

#Establish look back length:
def Length = if TimeFrame == TimeFrame.Three_Months then 63 else if TimeFrame == TimeFrame.Six_Months then 126 else 252;

#Get Index Close/Open/High/Low - Prep for Candlestick RS.
def indexopen = open(CorrelationWithSecurity, aggregationperiod);
def indexhigh = high(CorrelationWithSecurity, aggregationperiod);
def indexlow = low(CorrelationWithSecurity, aggregationperiod);
def indexclose = close(CorrelationWithSecurity, aggregationperiod);

#Get Relative Strength - Prep for Candlestick RS.
def RSopen = open / indexopen;
def RShigh = high / indexhigh;
def RSlow = low / indexlow;
def RSclose = close / indexclose;

def barCount = IF !IsNaN(close) THEN IF IsNaN(barCount[1]) THEN 1 ELSE barCount[1] + 1 ELSE barCount[1];

#Normalize Relative Strength
def newRngMax = 99; #Maximum normalized value
def newRngMin = 1; #Minimum normalized value

def HHDataclose = HighestAll(RSclose);
def LLDataclose = LowestAll(RSclose);
def HHDataopen = HighestAll(RSopen);
def LLDataopen = LowestAll(RSopen);
def HHDatalow = HighestAll(RSlow);
def LLDatalow = LowestAll(RSlow);
def HHDatahigh = HighestAll(RShigh);
def LLDatahigh = LowestAll(RShigh);

def normalizeRSclose = ((( newRngMax - newRngMin ) * ( RSclose - LLDataclose )) / ( HHDataclose - LLDataclose )) + newRngMin;
def normalizeRSopen = ((( newRngMax - newRngMin ) * ( RSopen - LLDataopen )) / ( HHDataopen - LLDataopen )) + newRngMin;
def normalizeRShigh = ((( newRngMax - newRngMin ) * ( RShigh - LLDatahigh )) / ( HHDatahigh - LLDatahigh )) + newRngMin;
def normalizeRSlow = ((( newRngMax - newRngMin ) * ( RSlow - LLDatalow )) / ( HHDatalow - LLDatalow )) + newRngMin;

#Chart RS Line and set appearence:
plot RSLine = RSclose;
RSLine.DefineColor("Positive", Color.UPTICK);
RSLine.DefineColor("Negative", Color.DOWNTICK);
RSLine.SetLineWeight(1);
RSLine.AssignValueColor(if RSLine[0] > RSLine[1] then CreateColor(43, 152, 242) else CreateColor(227, 88, 251));

#Get Highest RS Value
def highestRS = Highest(RSclose, Length);

#RSNHBPCondition
def RSNHBPcondition = if RSclose >= highestRS and close < Highest(close, Length) then highestRS else no;

#Plot RSNHBP Condition
plot RSNHBP = if show_RSNHBP and RSNHBPcondition == highestRS then highestRS else Double.NaN;

#Plot RSNH Condition
plot RSNH = if show_RSNH and RSNHBPcondition == no and RSclose == highestRS and isLastBar then highestRS else Double.NaN;

#Appearance Settings
RSNHBP.SetPaintingStrategy(PaintingStrategy.POINTS);
RSNHBP.SetLineWeight(2);
RSNHBP.SetDefaultColor(CreateColor(196, 94, 225));
RSNHBP.HideBubble();
RSNH.SetPaintingStrategy(PaintingStrategy.POINTS);
RSNH.SetDefaultColor(Color.GREEN);
RSNH.SetLineWeight(2);
RSNH.HideBubble();

#Add Chart Bubble for RS Rating
AddChartBubble(RS_Rating_ChartBubble and isLastBar, RSclose, "RS: " + Round(normalizeRSclose, 0),  Color.WHITE, no);

#Add Label
AddLabel(yes, Concat("Relative Strength: ", Round(normalizeRSclose, 0)), CreateColor(43, 152, 242));

#Alert Capability
Alert( if Alerts_On and RSNHBP then yes else no, "Relative Strength Line New Highs Before Price", Alert.BAR, Sound.Ding);
Alert(if Alerts_On and RSNH then yes else no, "Relative Strength Line New Highs", Alert.BAR, Sound.Chimes);
Attachments
Last edited by a moderator:


