# avg_of_prev_x_peaksvalleys_02
#https://usethinkscript.com/threads/how-to-get-the-offset-value-of-the-first-of-the-last-so-many-times-a-condition-occurred.16392/
#How to get the offset value of the first of the last so many times a condition occurred?
#------------------------------------
def na = double.nan;
def bn = barnumber();
def lastbn = HighestAll(If(IsNaN(close), 0, bn));
def lastbar = if (bn == lastbn) then 1 else 0;
#def lastbar = !isnan(close[0]) and isnan(close[-1]);
#----------------------
input qty_peaks_valleys = 5;
input price_data = { default average , high_low };
input last_bar_can_be_peakvalley = yes;
#----------------------
# data - average
def price = close;
input avg1_len = 12;
#input ma1_type = AverageType.EXPONENTIAL;
input avg1_type = AverageType.simple;
def avg1 = MovingAverage(avg1_type, price, avg1_len);
input show_avg_line = yes;
plot z1 = if show_avg_line then avg1 else na;
z1.setdefaultcolor(color.light_gray);
#z1.setlineweight(1);
z1.hidebubble();
#---------------------------
# choose price levels to analyze, avg, close,...
#def peakdata = avg1;
#def valleydata = avg1;
#def peakdata = high;
#def valleydata = low;
#input price_data = { default average , high_low };
def peakdata;
def valleydata;
def datatype;
if price_data == price_data.average then {
peakdata = avg1;
valleydata = avg1;
datatype = 1;
} else if price_data == price_data.high_low then {
peakdata = high;
valleydata = low;
datatype = 2;
} else {
peakdata = na;
valleydata = na;
datatype = 0;
}
def t = 0;
#---------------------------
# peak data
def peak = (peakdata[1] < peakdata[0] and peakdata[0] > peakdata[-1]);
def peaklast = if !last_bar_can_be_peakvalley then 0
else if lastbar and peakdata > peakdata[1] then 1
else 0;
def peak2 = if lastbar then peaklast else peak;
# count the peaks
def avgpeakcnt = if bn == 1 then 1
else if peak2[t] then avgpeakcnt[1] + 1
else avgpeakcnt[1];
def pkmaxcnt = highestall(avgpeakcnt);
def pkrevcnt = pkmaxcnt - avgpeakcnt + 1;
# define the group of bars that include x peaks
def ispeaks = (peak2[t] and pkrevcnt <= qty_peaks_valleys);
def peakrange = (pkrevcnt <= qty_peaks_valleys);
def pkavgtotal = if bn == 1 then 0
# else if lastbar then avgtotal[1]
else if lastbar and peaklast then pkavgtotal[1] + peakdata
else if ispeaks then round(pkavgtotal[1] + peakdata, 2)
else pkavgtotal[1];
def pkavgavg = round(pkavgtotal / qty_peaks_valleys, 2);
def pkavgavg2 = highestall(if lastbar then pkavgavg else 0);
#-----------------
plot zpk = if peakrange then pkavgavg2 else na;
zpk.setdefaultcolor(color.cyan);
zpk.setlineweight(2);
#zpk.hidebubble();
addlabel(1, " ", color.black);
#addlabel(0, qty_peaks_valleys + " peaks", color.yellow);
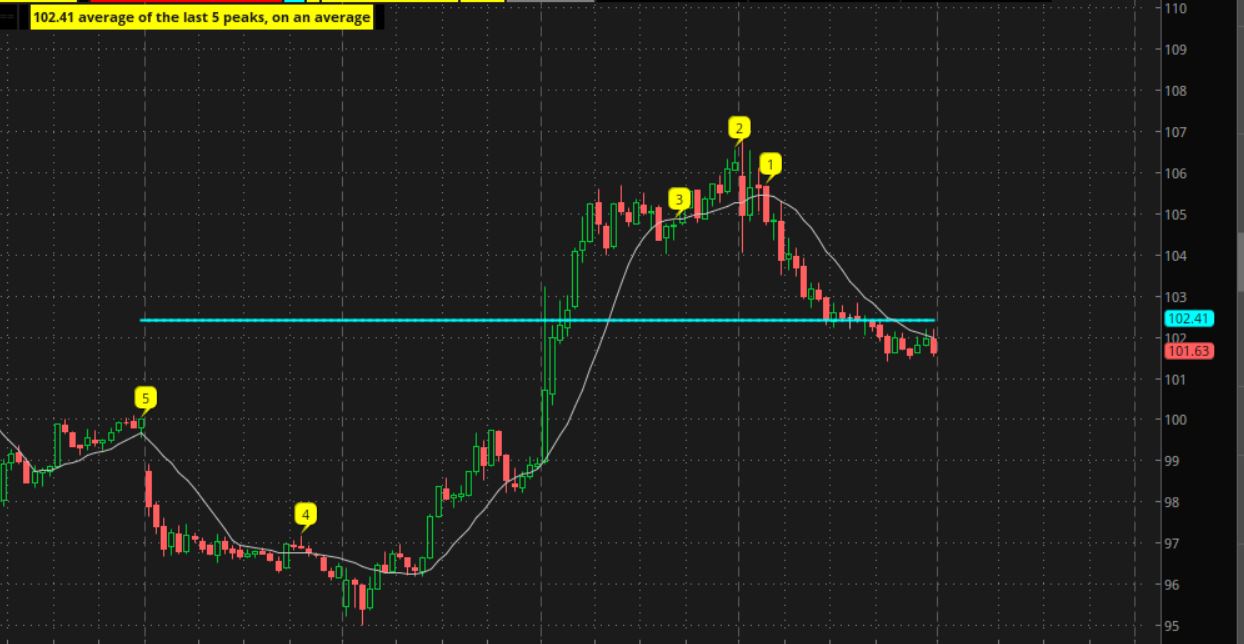
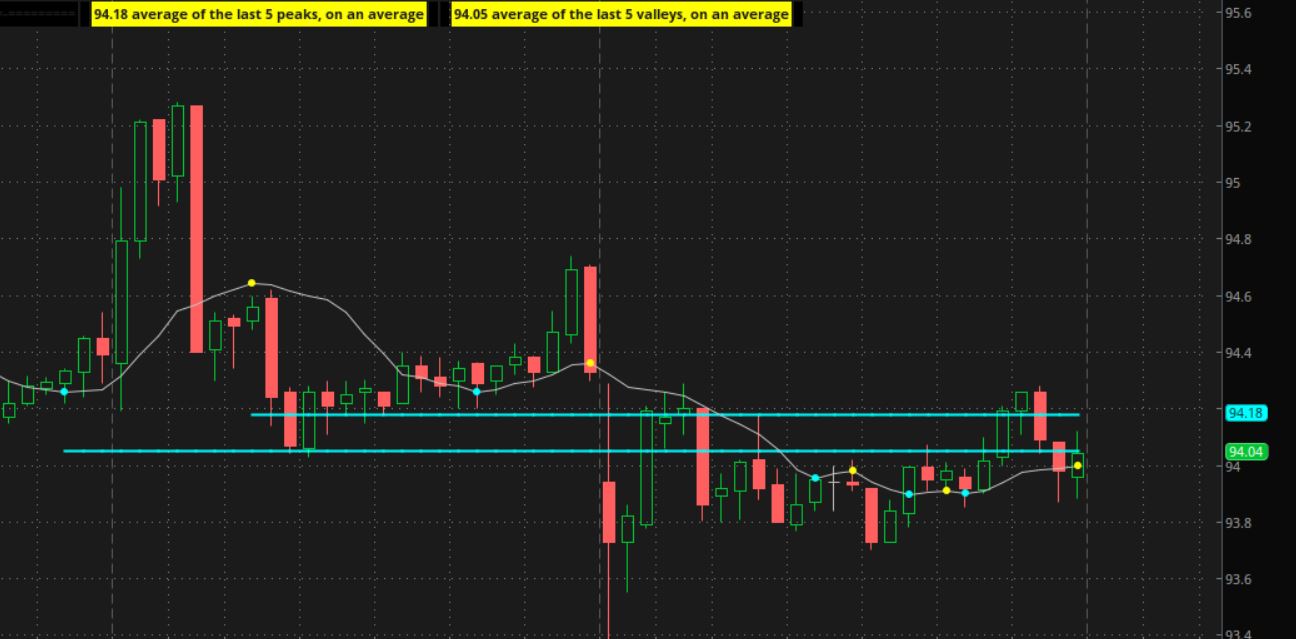
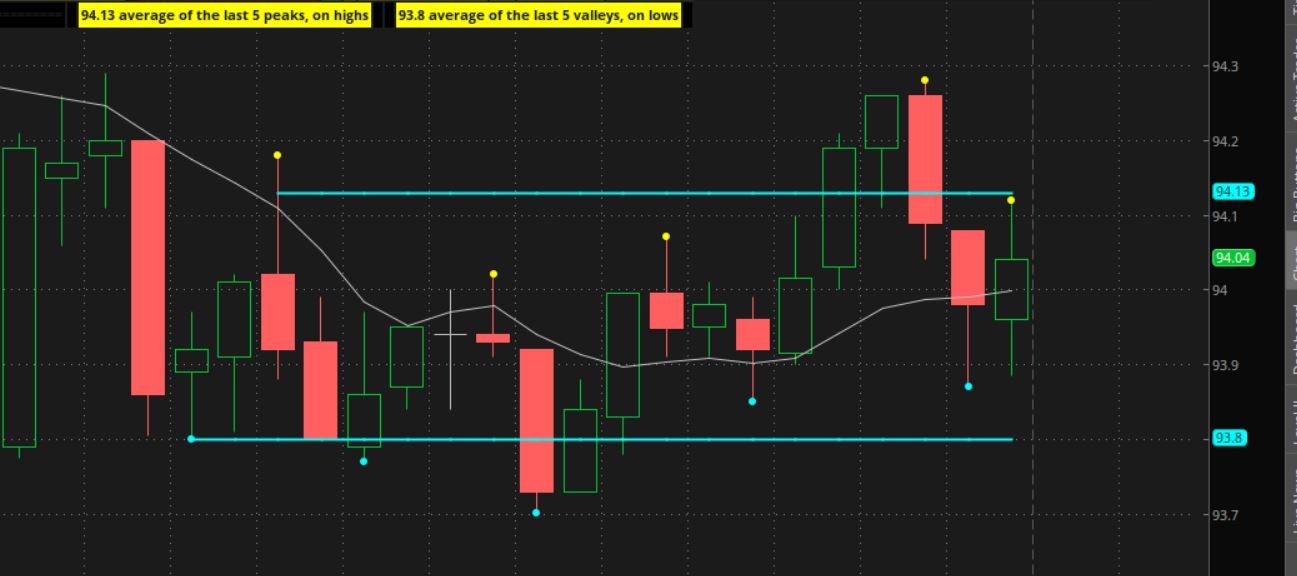
addlabel(1, pkavgavg2 + " average of the last " + qty_peaks_valleys + " peaks, on " + (if datatype == 1 then "an average" else "highs"), color.yellow);
addlabel(1, " ", color.black);
#---------------------------
#---------------------------
# valley data
def valley = (valleydata[1] > valleydata[0] and valleydata[0] < valleydata[-1]);
def valleylast = if !last_bar_can_be_peakvalley then 0
else if lastbar and valleydata < valleydata[1] then 1
else 0;
def valley2 = if lastbar then valleylast else valley;
#def t = 0;
# count the peaks
def avgvalleycnt = if bn == 1 then 1
else if valley2[t] then avgvalleycnt[1] + 1
else avgvalleycnt[1];
def valmaxcnt = highestall(avgvalleycnt);
def valrevcnt = valmaxcnt - avgvalleycnt + 1;
# define the group of bars that include x peaks
def isvalleys = (valley2[t] and valrevcnt <= qty_peaks_valleys);
def valleyrange = (valrevcnt <= qty_peaks_valleys);
def valavgtotal = if bn == 1 then 0
# else if lastbar then avgtotal[1]
else if lastbar and valleylast then valavgtotal[1] + valleydata
else if isvalleys then round(valavgtotal[1] + valleydata, 2)
else valavgtotal[1];
def valavgavg = round(valavgtotal / qty_peaks_valleys, 2);
def valavgavg2 = highestall(if lastbar then valavgavg else 0);
#-----------------
plot zval = if valleyrange then valavgavg2 else na;
zval.setdefaultcolor(color.cyan);
zval.setlineweight(2);
#zval.hidebubble();
addlabel(1, " ", color.black);
#addlabel(0, qty_peaks_valleys + " valleys", color.yellow);
addlabel(1, valavgavg2 + " average of the last " + qty_peaks_valleys + " valleys, on " + (if datatype == 1 then "an average" else "lows"), color.yellow);
addlabel(1, " ", color.black);
#---------------------------
input show_peak_dots = yes;
plot zpd = if peak2[t] and peakrange then peakdata else na;
zpd.SetPaintingStrategy(PaintingStrategy.POINTS);
zpd.SetDefaultColor(Color.yellow);
zpd.setlineweight(3);
zpd.hidebubble();
input show_valley_dots = yes;
plot zvd = if valley2[t] and valleyrange then valleydata else na;
zvd.SetPaintingStrategy(PaintingStrategy.POINTS);
zvd.SetDefaultColor(Color.cyan);
zvd.setlineweight(3);
zvd.hidebubble();
#---------------------------
input test1_peaks = no;
addchartbubble(test1_peaks and peak2[t], peakdata,
pkrevcnt + "\n" +
peakdata
, (if peakrange then color.yellow else color.gray), yes);
input test2_peakdata = no;
#addchartbubble(test2_avg and (revcnt <= peak_qtys), low,
addchartbubble(test2_peakdata, peakdata,
pkrevcnt + "\n" +
qty_peaks_valleys + "\n" +
pkavgavg2 + "\n" +
ispeaks + "\n" +
zpk
, (if ispeaks then color.yellow else color.gray), no);
#, color.yellow, no);
# peak data
input test1_peak_cnts = no;
addchartbubble(test1_peak_cnts and peak2[t], peakdata,
peakdata + "\n" +
peak2[t] + "\n" +
pkavgtotal + "\n" +
pkavgavg + "\n\n" +
avgpeakcnt + "\n" +
pkmaxcnt + "\n" +
pkrevcnt
, (if ispeaks then color.yellow else color.gray), yes);
#---------------------------
#---------------------------
input test1_valleys = no;
addchartbubble(test1_valleys and valley2[t], valleydata,
valrevcnt + "\n" +
valleydata
, (if valleyrange then color.cyan else color.gray), no);
input test2_valleydata = no;
#addchartbubble(test2_avg and (revcnt <= peak_qtys), low,
addchartbubble(test2_valleydata, valleydata,
valrevcnt + "\n" +
qty_peaks_valleys + "\n" +
valavgavg2 + "\n" +
isvalleys + "\n" +
zval + "\n" +
valleydata + "\n" +
valley2[t] + "\n"
, (if isvalleys then color.cyan else color.gray), no);
#, color.yellow, no);
# peak data
input test1_valley_cnts = no;
addchartbubble(test1_valley_cnts and valley2[t], valleydata,
valleydata + "\n" +
valley2[t] + "\n" +
valavgtotal + "\n" +
valavgavg + "\n\n" +
avgvalleycnt + "\n" +
valmaxcnt + "\n" +
valrevcnt
, (if isvalleys then color.cyan else color.gray), yes);
#