Internet Name
Member
I wanted to play with the angle of a moving average line as an indicator since there seems to be a pretty distinct pattern with them. Unfortunately, the answer of "how to calculate the slope of a moving average line" was not as readily available as I would've wished. It took me a couple days to figure out how to code thinkscript to get it to return the angle. I'd like to share the process and the final code. If anyone ends up incorporating this into their thinkscript codes, I'd love to hear about it if you wish to share.
We have the use the trigonometric functions to determine what the slope is. I ended up having to go back and learn basic trigonometry that I know I ignored in High School. When we go to the ThinkScript guide, there are COS, SIN, and TAN functions, but the guide is very brief on what they do or what the number being returned means.
We start with SOH CAH TOA:

In a stock chart, the only side lengths we know are the opposite and adjacent. The hypotenuse is what we are solving for. So the TAN function is the only function we can use.


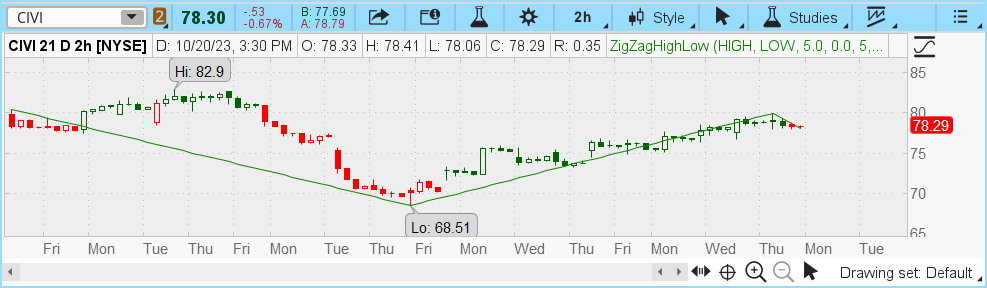
We're going to measure the lower left angle, so the stock price is the opposite side, and the date is the adjacent side. With the adjacent side, we need to make sure that all stocks are on an even playing field by using percentages. For the periods on the adjacent side, I've used a value of 0.5 per period so that a percent increase of 50% will show a 45 degree angle.

A difficult part of the process was figuring out the difference between tangent vs. arc tangent:
So we use the function "ATAN" rather than TAN. If you go into the documentation for this function and look at the example, you'll see a "180 / Double.Pi" inside ATAN and "DoublePi * 180" inside the TAN function. This is the piece we need to bridge between the lengths and the angle.
Once we do the opposite side length / adjacent side length and get the answer, we can then do the following to get the angle:
Final code:
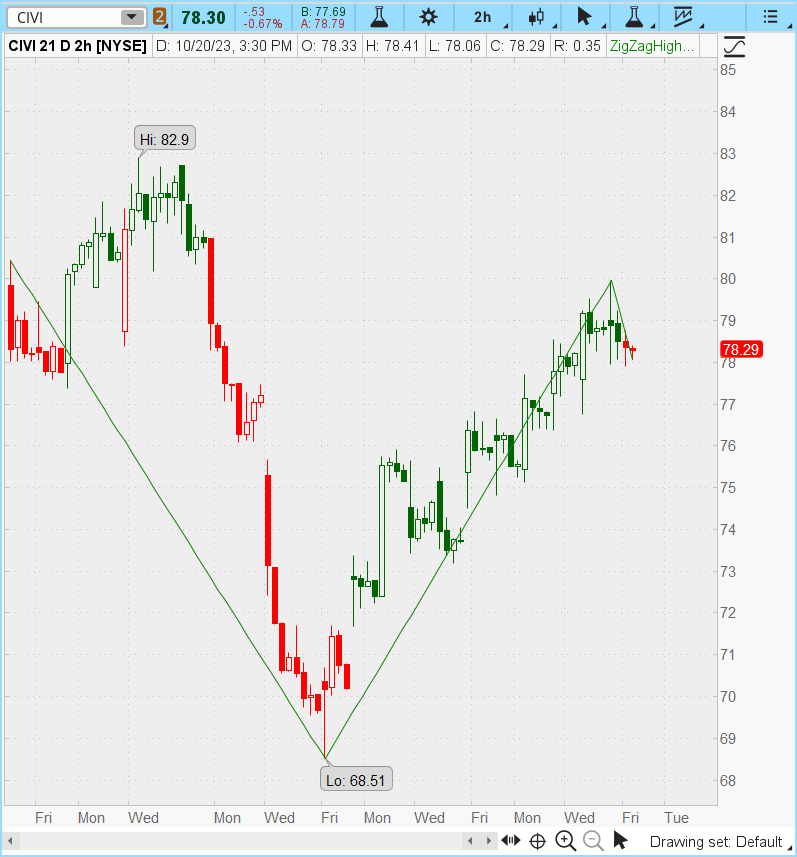
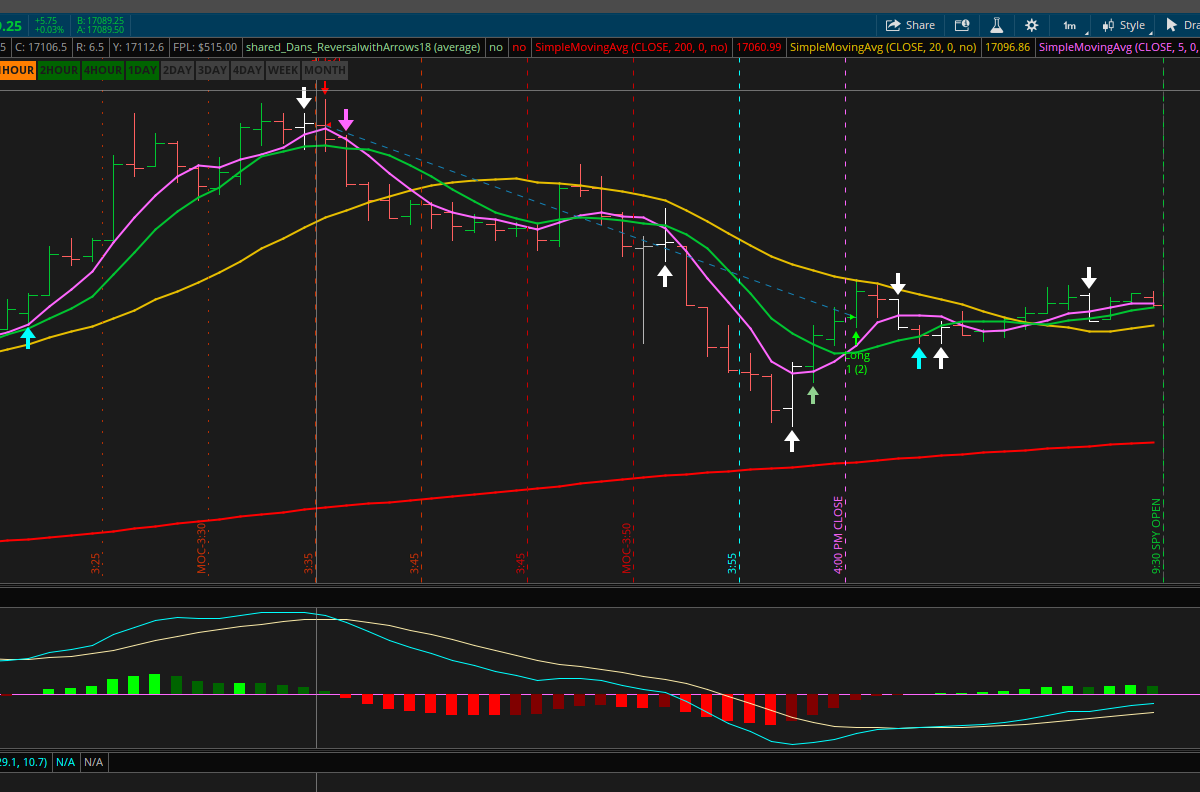
After testing this, I believe this is pretty accurate. When you use it on moving averages, the slopes can look alot steeper than what the degree is returning. But I believe that has to do with perspective. You can zoom in and out and the slope of the line changes, sometimes the charts start at numbers other than zero, so they can look extreme. But using the methods discussed above puts the stocks on an even playing field I believe. If you do want to turn up the sensitivity, reducing the 180 in "180 / Double.Pi" would seem to be the easiest way.
We have the use the trigonometric functions to determine what the slope is. I ended up having to go back and learn basic trigonometry that I know I ignored in High School. When we go to the ThinkScript guide, there are COS, SIN, and TAN functions, but the guide is very brief on what they do or what the number being returned means.
We start with SOH CAH TOA:
In a stock chart, the only side lengths we know are the opposite and adjacent. The hypotenuse is what we are solving for. So the TAN function is the only function we can use.
We're going to measure the lower left angle, so the stock price is the opposite side, and the date is the adjacent side. With the adjacent side, we need to make sure that all stocks are on an even playing field by using percentages. For the periods on the adjacent side, I've used a value of 0.5 per period so that a percent increase of 50% will show a 45 degree angle.
A difficult part of the process was figuring out the difference between tangent vs. arc tangent:
- Tangent = use when you have the degree already and want to find acceptable side lengths.
- Arc Tangent = use when you have the side lengths and want to find the degree of the angle.
So we use the function "ATAN" rather than TAN. If you go into the documentation for this function and look at the example, you'll see a "180 / Double.Pi" inside ATAN and "DoublePi * 180" inside the TAN function. This is the piece we need to bridge between the lengths and the angle.
Once we do the opposite side length / adjacent side length and get the answer, we can then do the following to get the angle:
- On the calculator: find the trigonometry functions, then find and select Tan^-1. This will return the angle.
- In thinkscript: ATAN(opposite/adjacent) * 180 / Double.Pi
Final code:
Code:
Declare lower;
input HowManyPeriodsBackForSlopeMeasure= 1;
input SMALength = 9;
input agg = aggregationPeriod.Day;
input ShowTroubleshootLabels= no;
def SMA = Average(close(period=agg),SMALength);
def opposite = (SMA - SMA[HowManyPeriodsBackForSlopeMeasure])/SMA[HowManyPeriodsBackForSlopeMeasure];
def adjacent = HowManyPeriodsBackForSlopeMeasure * .5;
def tan = opposite / adjacent;

plot angle = ROUND(atan(tan)* 180 / Double.Pi,2);

# ---- Troubleshooting Labels ----
AddLabel(ShowTroubleshootLabels,"Recent SMA: " + SMA,color.yellow);
AddLabel(ShowTroubleshootLabels,"Prev SMA: " + SMA[HowManyPeriodsBackForSlopeMeasure],color.yellow);
AddLabel(showTroubleshootLabels,"Vertical Side: " + opposite,color.white);
AddLabel(showTroubleshootLabels,"Horizontal Side: " + adjacent,color.white);
AddLabel(showTroubleshootLabels,"Vertical/Horizontal: " + tan,color.white);
AddLabel(showTroubleshootLabels,"Angle: " + angle,color.white);
AddChartBubble(SecondsTillTime(1200)==0,if ShowTroubleshootLabels then angle else Double.NaN,angle,color.white);

# ---- Calculator Instructions ----
#With tan entered into the calculator, hit trigonometry, 2nd, and then tan^-1 to get the angle.
After testing this, I believe this is pretty accurate. When you use it on moving averages, the slopes can look alot steeper than what the degree is returning. But I believe that has to do with perspective. You can zoom in and out and the slope of the line changes, sometimes the charts start at numbers other than zero, so they can look extreme. But using the methods discussed above puts the stocks on an even playing field I believe. If you do want to turn up the sensitivity, reducing the 180 in "180 / Double.Pi" would seem to be the easiest way.