thank you, ok i figured out how to set it up, using 377 ticks for the S&P. But how do i read the chart?
@MerryDay thank you for your help. isnt quite intuitive
View attachment 21501
- Tick Chart: A tick chart reflects both volume and price movements. Each candlestick on a tick chart is formed based on a certain number of trades (ticks). For example, if there are not enough trades occurring within a specific period, no candlestick will be plotted. This means that tick charts provide insight into both the momentum (speed of price changes) and volume (number of trades) in the market, in addition to price movements.
- Time Chart: On the other hand, a time chart, such as a 5-minute or 15-minute chart, only reflects price movements over a predefined time period. Each candlestick represents the price action during that specific time interval, regardless of the number of trades that occurred. Time charts provide information solely on price movements and do not incorporate volume or the speed of price changes (momentum).
In summary, tick charts offer traders a more dynamic view of the market by incorporating volume and momentum alongside price movements, whereas time charts provide a more static view focused solely on price changes over predefined time intervals. Depending on your trading strategy and preferences, you may find one type of chart more suitable than the other for analyzing market dynamics and making trading decisions.
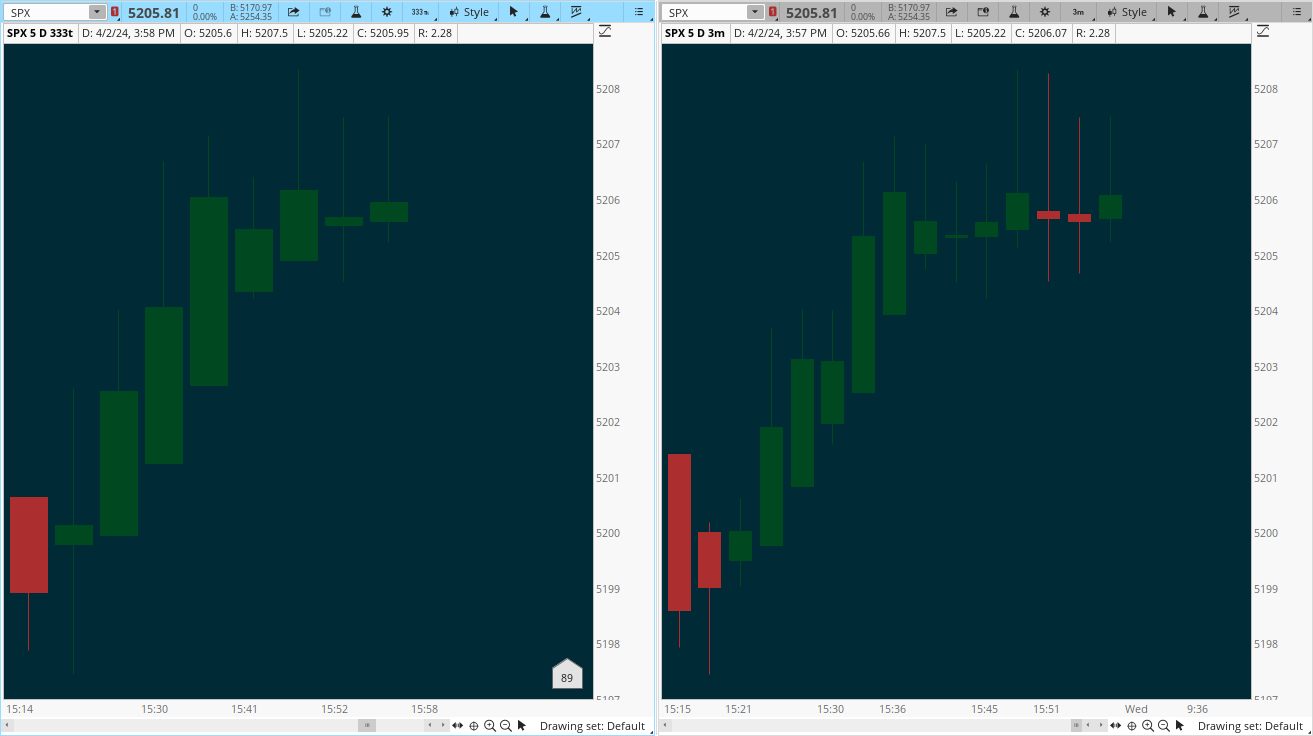
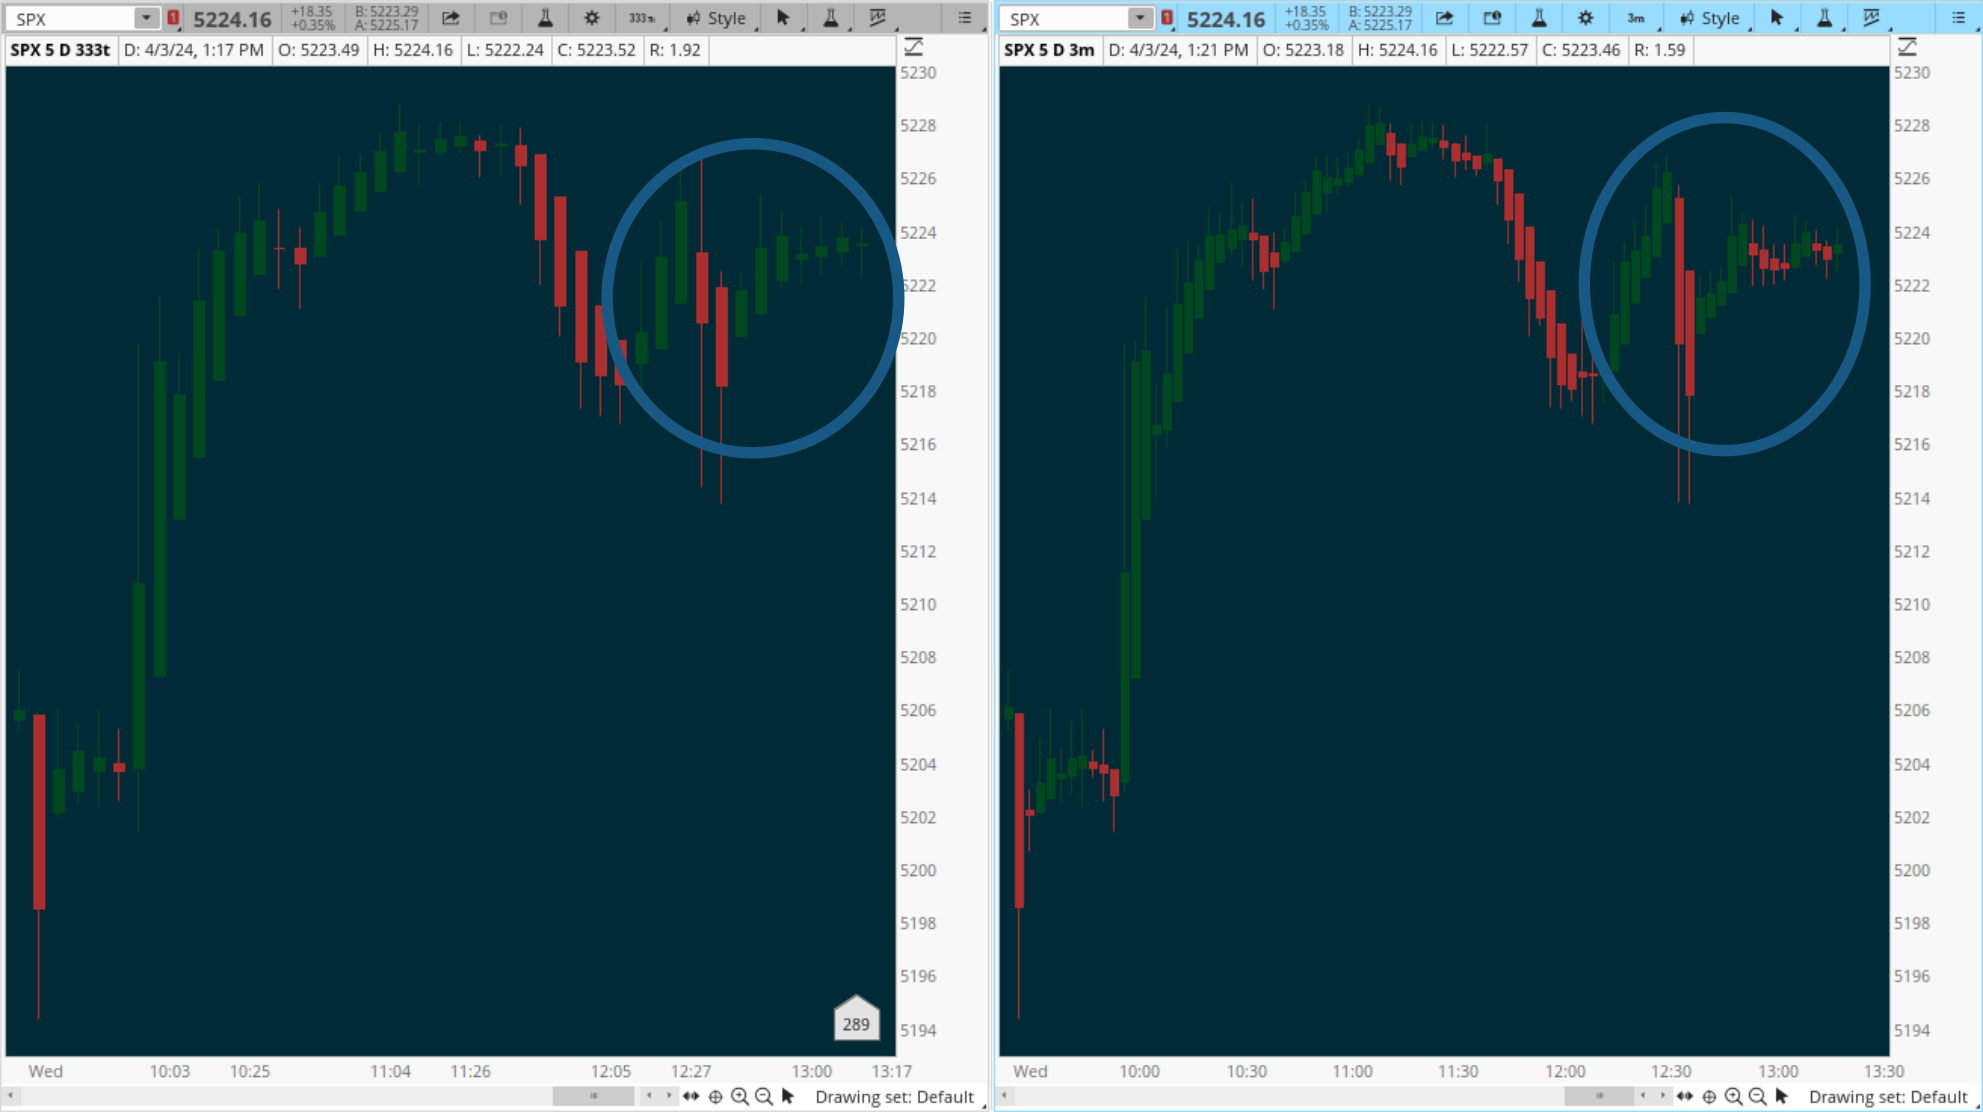
Here is an example of the last 15 minutes of the SPX chart from yesterday.
The tick and time charts are similar, except where they are not.
The tick chart which plots based on volume, momentum and price did not show the bearish candles that you see on the time chart which is a reflection of price alone.
If you are asking how to determine the number of ticks to select for a tick chart.
The answer is: it varies, by instrument, by time of day; the first and last hour of the day have the most volume. A tick chart set too low; will go flying by, without any time to act on trades. Thus, mornings and afternoons may need to be set higher.
Through extrapolation and interpolation, you find the sweet spot to best identify trends.