how to create and use a tick chart

Solution
Last edited:
Solution
thank you, ok i figured out how to set it up, using 377 ticks for the S&P. But how do i read the chart? @MerryDay thank you for your help. isnt quite intuitive
1712117151586.png
 
thank you, ok i figured out how to set it up, using 377 ticks for the S&P. But how do i read the chart? @MerryDay thank you for your help. isnt quite intuitiveView attachment 21501

  1. Tick Chart: A tick chart reflects both volume and price movements. Each candlestick on a tick chart is formed based on a certain number of trades (ticks). For example, if there are not enough trades occurring within a specific period, no candlestick will be plotted. This means that tick charts provide insight into both the momentum (speed of price changes) and volume (number of trades) in the market, in addition to price movements.
  2. Time Chart: On the other hand, a time chart, such as a 5-minute or 15-minute chart, only reflects price movements over a predefined time period. Each candlestick represents the price action during that specific time interval, regardless of the number of trades that occurred. Time charts provide information solely on price movements and do not incorporate volume or the speed of price changes (momentum).
In summary, tick charts offer traders a more dynamic view of the market by incorporating volume and momentum alongside price movements, whereas time charts provide a more static view focused solely on price changes over predefined time intervals. Depending on your trading strategy and preferences, you may find one type of chart more suitable than the other for analyzing market dynamics and making trading decisions.

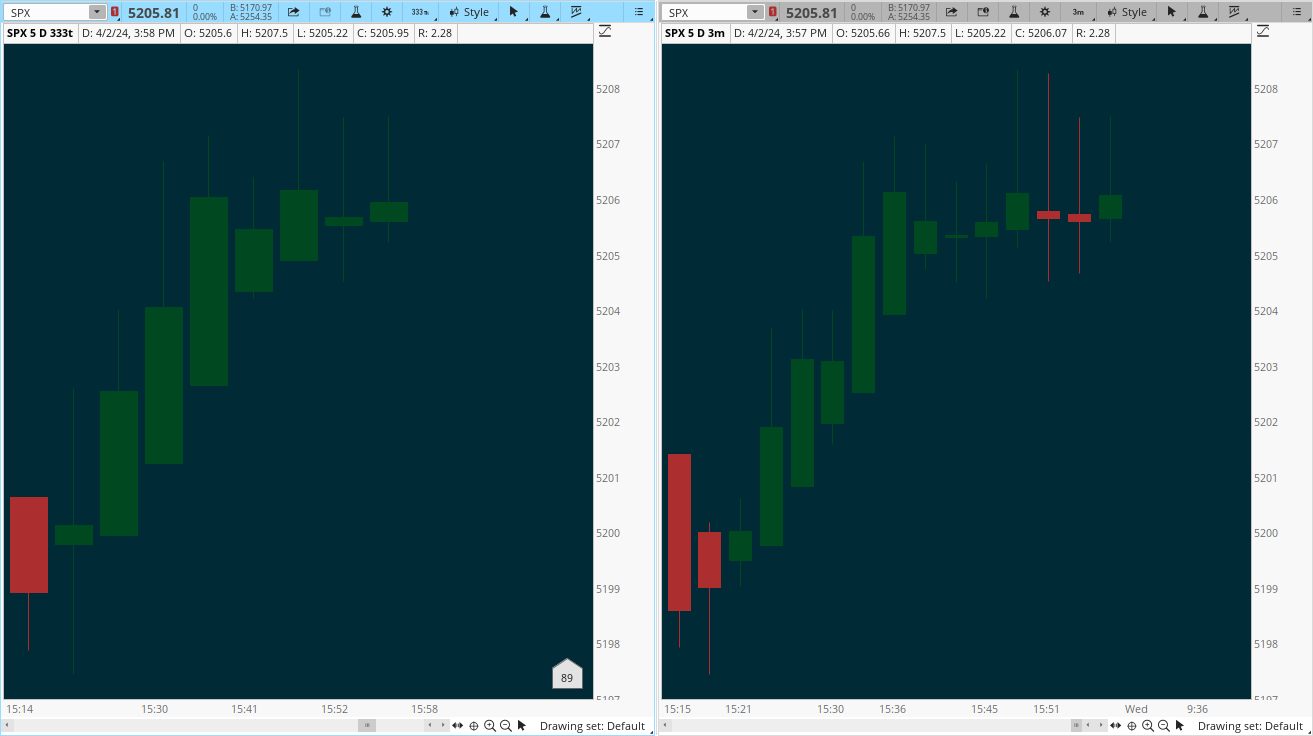
Here is an example of the last 15 minutes of the SPX chart from yesterday.
The tick and time charts are similar, except where they are not.
The tick chart which plots based on volume, momentum and price did not show the bearish candles that you see on the time chart which is a reflection of price alone.
93qRaty.png


If you are asking how to determine the number of ticks to select for a tick chart.
The answer is: it varies, by instrument, by time of day; the first and last hour of the day have the most volume. A tick chart set too low; will go flying by, without any time to act on trades. Thus, mornings and afternoons may need to be set higher.

Through extrapolation and interpolation, you find the sweet spot to best identify trends.
 
Last edited:
thank you, i set it up exactly as you have it but how do i get my tick bars to be like yours . Look at how mine are - I cant really read that , thank you again @MerryDay

View attachment 21502
the charts in my post have no indicators applied.
the idea is to observe the naked chart. read the price action of the candles:
  • the bullish v. bearish,
  • the wicks
  • and the candle patterns
they will tell the story of trend.

the left chart is the 333tick SPX zoomed in to the 3:45-4pm
the right chart is the 3-min SPX zoomed in to the 3:45-4pm
 
Last edited:
ENtpqS9.png


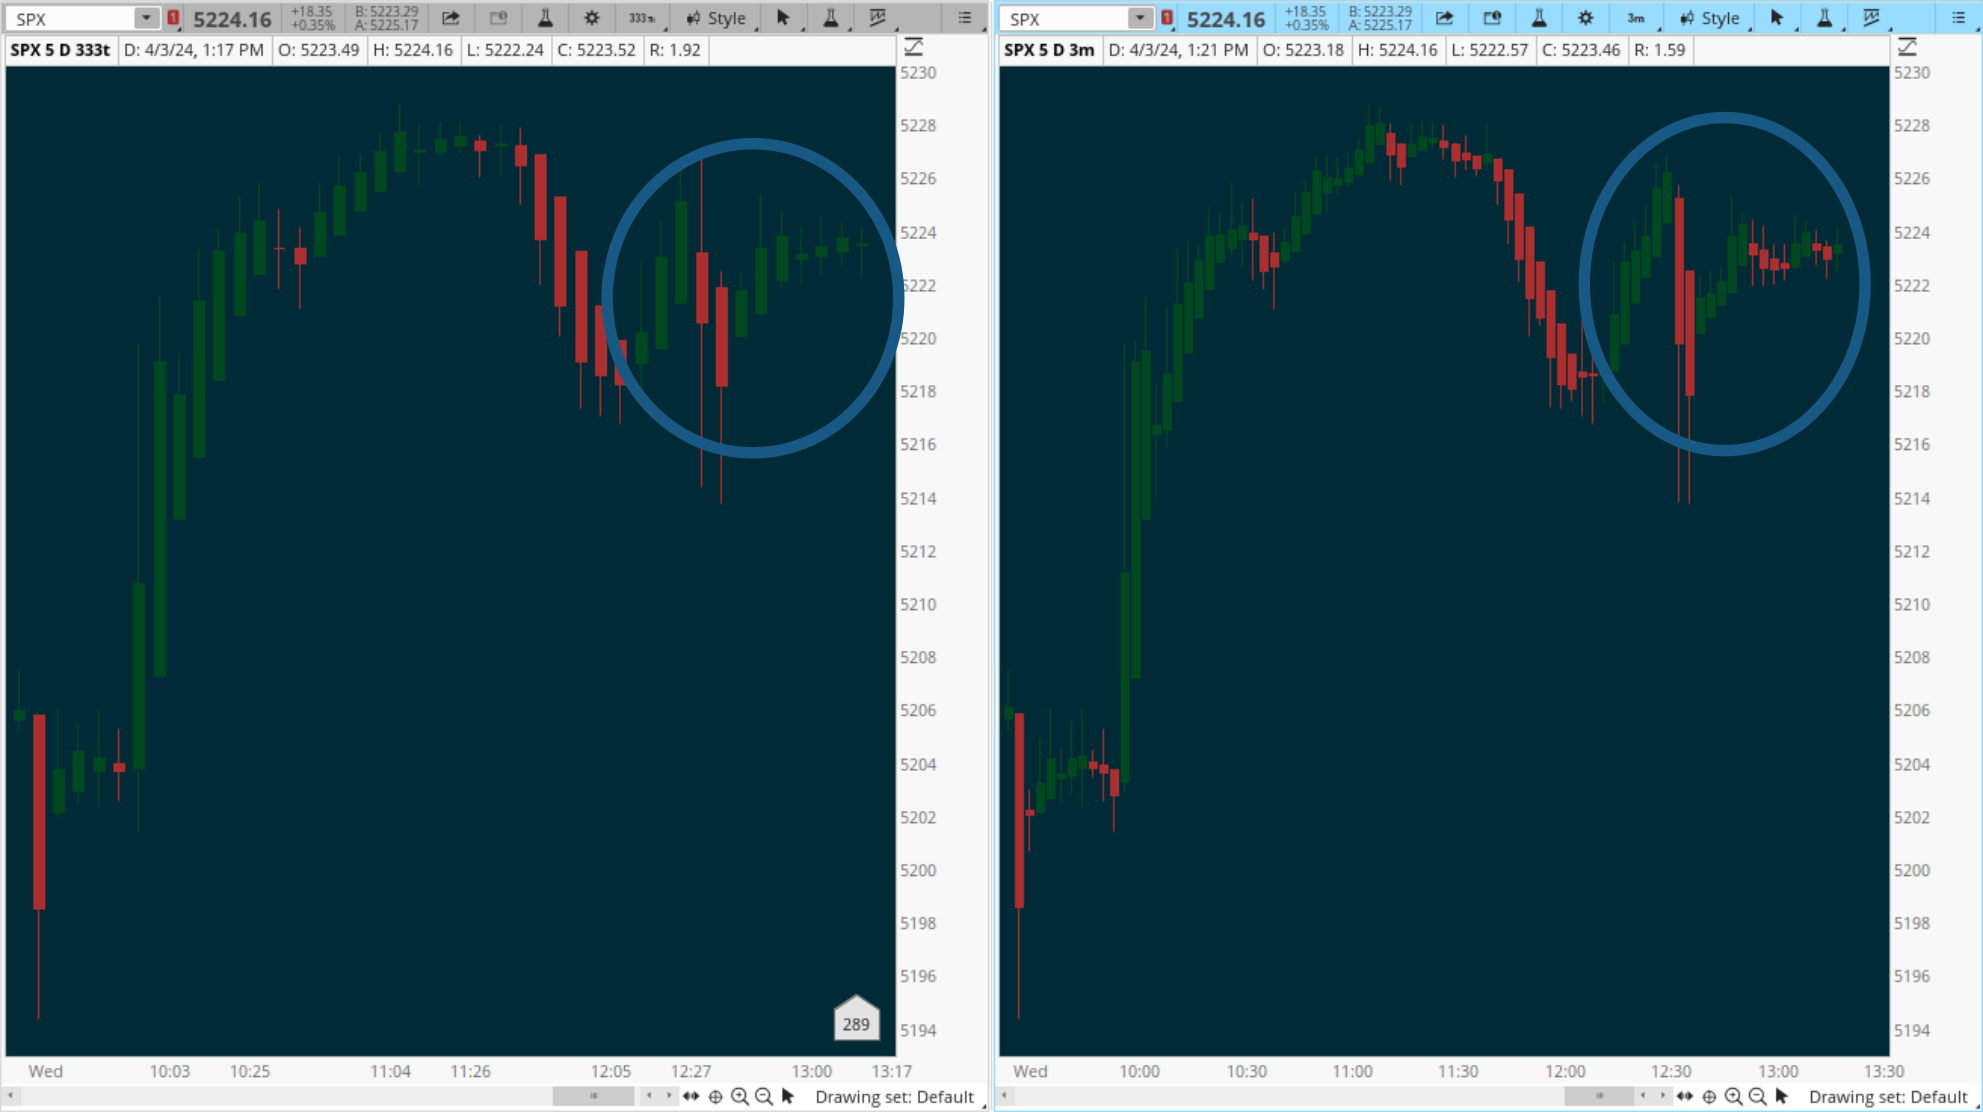
Here is this morning charts
Both the tick chart and the time chart provided a clear indicator of the market's bullish run, and when it was time to leave the party.

If you are having difficulty understanding the tick chart, the time chart conveyed similar information.
The goal is to be able to confirm that the market is trending before making your trades.
This is explained in more detail here:
https://usethinkscript.com/threads/automated-trend-line-drawing.18181/#post-139472

Note the midday candles. There are only 12 bars on the tick chart and 24 on the time chart.
Tick charts are built on volume, less volume == less bars.
Less volume means more volatility, which makes profitable entries and exits more difficult.

So we wait for an uptick in activity. If it is another bullish run at the end of the day, it will nicely augment this morning's trades
1DwTb03.png
 
Last edited:

Join useThinkScript to post your question to a community of 21,000+ developers and traders.

Not the exact question you're looking for?

Start a new thread and receive assistance from our community.

87k+ Posts
356 Online
Create Post

The Market Trading Game Changer

Join 2,500+ subscribers inside the useThinkScript VIP Membership Club
  • Exclusive indicators
  • Proven strategies & setups
  • Private Discord community
  • ‘Buy The Dip’ signal alerts
  • Exclusive members-only content
  • Add-ons and resources
  • 1 full year of unlimited support

Frequently Asked Questions

What is useThinkScript?

useThinkScript is the #1 community of stock market investors using indicators and other tools to power their trading strategies. Traders of all skill levels use our forums to learn about scripting and indicators, help each other, and discover new ways to gain an edge in the markets.

How do I get started?

We get it. Our forum can be intimidating, if not overwhelming. With thousands of topics, tens of thousands of posts, our community has created an incredibly deep knowledge base for stock traders. No one can ever exhaust every resource provided on our site.

If you are new, or just looking for guidance, here are some helpful links to get you started.

What are the benefits of VIP Membership?
VIP members get exclusive access to these proven and tested premium indicators: Buy the Dip, Advanced Market Moves 2.0, Take Profit, and Volatility Trading Range. In addition, VIP members get access to over 50 VIP-only custom indicators, add-ons, and strategies, private VIP-only forums, private Discord channel to discuss trades and strategies in real-time, customer support, trade alerts, and much more. Learn all about VIP membership here.
How can I access the premium indicators?
To access the premium indicators, which are plug and play ready, sign up for VIP membership here.
Back
Top