
modulus
New member
Pretty new to trading and TOS, but managed to read through a few threads and by splicing a some things together was able to create a study that I thought others might find useful.
I start my morning by checcking watcchlists, and then quickly navigate to the ccharts to plot pricec levels on each.
To save time and also have flexibility, what I wanted was a quick way to enter the data and have them charted without adding price levels to each and then copying, moving up and down, etc.
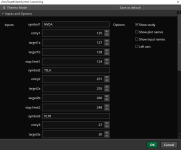
The following code allows you to enter 4 symbols, and then the pertinent data for each, and when you go to those charts the lines will propagate. If you go to charts without those symbols, the lines and text bubbles will be hidden. The data can be edited within the script or through the Options entry.


input Symbol1 = "NVDA";
input Entry1 = 125.38; # Stock Entry Price
input Target1a = 128.50; #Target Price 1
input Target1b = 130.00; #Target Price 2
input StopLimit1 = 124.75; #Stop Limit Price
input Symbol2 = "TSLA";
input Entry2 = 251.00; # Stock Entry Price
input Target2a = 255.00; #Target Price 1
input Target2b = 260.00; #Target Price 2
input StopLimit2 = 248.00; #Stop Limit Price
input Symbol3 = "PLTR";
input Entry3 = 27.00; # Stock Entry Price
input Target3a = 30.00; #Target Price 1
input Target3b = 32.00; #Target Price 2
input StopLimit3 = 25.50; #Stop Limit Price
input Symbol4 = "GME";
input Entry4 = 23.50; # Stock Entry Price
input Target4a = 25.50; #Target Price 1
input Target4b = 26.50; #Target Price 2
input StopLimit4 = 22.50; #Stop Limit Price
#Line Plots and Styles
plot p1;
p1.SetDefaultColor(Color.GREEN);
p1.SetStyle(Curve.MEDIUM_DASH);
plot p2;
p2.SetDefaultColor(CreateColor(255,154,253));
p2.SetStyle(Curve.MEDIUM_DASH);
plot p3;
p3.SetDefaultColor(CreateColor(255,95,248));
p3.SetStyle(Curve.MEDIUM_DASH);
plot p4;
p4.SetDefaultColor(CreateColor(231,235,120));
p4.SetStyle(Curve.MEDIUM_DASH);
def nan = double.NaN;
#If Then Variable Statements
if (GetSymbol() == Symbol1) then {
p1 = Entry1;
P2 = Target1a;
P3 = Target1b;
P4 = StopLimit1;
} else if (GetSymbol() == Symbol2) then {
p1 = Entry2;
p2 = Target2a;
p3 = Target2b;
p4 = StopLimit2;
} else if (GetSymbol() == Symbol3) then {
p1 = Entry3;
p2 = Target3a;
p3 = Target3b;
p4 = StopLimit3;
} else if (GetSymbol() == Symbol4) then {
p1 = Entry4;
p2 = Target4a;
p3 = Target4b;
p4 = StopLimit4;
} else {
p1 = nan;
p2 = nan;
p3 = nan;
p4 = nan;}
#Bubblemover
input bubblemoversideways = +10;
def b = bubblemoversideways;
def b1 = b + 1;
input bubblemoverupdown = 5;
#Bubbles
def Edge1 = !IsNaN(close) and IsNan(close[-1]);
AddChartBubble(
Edge1,
p1,
"Entry=" + AsText(p1),
p1.TakeValueColor()
);
def Edge2 = !IsNaN(close) and IsNaN(close[-1]);
AddChartBubble(
Edge2,
p2,
"SWEET!=" + AsText(p2),
p2.TakeValueColor()
);
def Edge3 = !IsNaN(close) and IsNaN(close[-1]);
AddChartBubble(
Edge3,
p3,
"SMASH!!=" + AsText(p3),
p3.TakeValueColor()
);
def Edge4 = !IsNaN(close) and IsNaN(close[-1]);
AddChartBubble(
Edge4,
p4,
"GET OUT=" + AsText(p4),
p4.TakeValueColor()
);
I start my morning by checcking watcchlists, and then quickly navigate to the ccharts to plot pricec levels on each.
To save time and also have flexibility, what I wanted was a quick way to enter the data and have them charted without adding price levels to each and then copying, moving up and down, etc.
The following code allows you to enter 4 symbols, and then the pertinent data for each, and when you go to those charts the lines will propagate. If you go to charts without those symbols, the lines and text bubbles will be hidden. The data can be edited within the script or through the Options entry.
input Symbol1 = "NVDA";
input Entry1 = 125.38; # Stock Entry Price
input Target1a = 128.50; #Target Price 1
input Target1b = 130.00; #Target Price 2
input StopLimit1 = 124.75; #Stop Limit Price
input Symbol2 = "TSLA";
input Entry2 = 251.00; # Stock Entry Price
input Target2a = 255.00; #Target Price 1
input Target2b = 260.00; #Target Price 2
input StopLimit2 = 248.00; #Stop Limit Price
input Symbol3 = "PLTR";
input Entry3 = 27.00; # Stock Entry Price
input Target3a = 30.00; #Target Price 1
input Target3b = 32.00; #Target Price 2
input StopLimit3 = 25.50; #Stop Limit Price
input Symbol4 = "GME";
input Entry4 = 23.50; # Stock Entry Price
input Target4a = 25.50; #Target Price 1
input Target4b = 26.50; #Target Price 2
input StopLimit4 = 22.50; #Stop Limit Price
#Line Plots and Styles
plot p1;
p1.SetDefaultColor(Color.GREEN);
p1.SetStyle(Curve.MEDIUM_DASH);
plot p2;
p2.SetDefaultColor(CreateColor(255,154,253));
p2.SetStyle(Curve.MEDIUM_DASH);
plot p3;
p3.SetDefaultColor(CreateColor(255,95,248));
p3.SetStyle(Curve.MEDIUM_DASH);
plot p4;
p4.SetDefaultColor(CreateColor(231,235,120));
p4.SetStyle(Curve.MEDIUM_DASH);
def nan = double.NaN;
#If Then Variable Statements
if (GetSymbol() == Symbol1) then {
p1 = Entry1;
P2 = Target1a;
P3 = Target1b;
P4 = StopLimit1;
} else if (GetSymbol() == Symbol2) then {
p1 = Entry2;
p2 = Target2a;
p3 = Target2b;
p4 = StopLimit2;
} else if (GetSymbol() == Symbol3) then {
p1 = Entry3;
p2 = Target3a;
p3 = Target3b;
p4 = StopLimit3;
} else if (GetSymbol() == Symbol4) then {
p1 = Entry4;
p2 = Target4a;
p3 = Target4b;
p4 = StopLimit4;
} else {
p1 = nan;
p2 = nan;
p3 = nan;
p4 = nan;}
#Bubblemover
input bubblemoversideways = +10;
def b = bubblemoversideways;
def b1 = b + 1;
input bubblemoverupdown = 5;
#Bubbles
def Edge1 = !IsNaN(close) and IsNan(close[-1]);
AddChartBubble(
Edge1,
p1,
"Entry=" + AsText(p1),
p1.TakeValueColor()
);
def Edge2 = !IsNaN(close) and IsNaN(close[-1]);
AddChartBubble(
Edge2,
p2,
"SWEET!=" + AsText(p2),
p2.TakeValueColor()
);
def Edge3 = !IsNaN(close) and IsNaN(close[-1]);
AddChartBubble(
Edge3,
p3,
"SMASH!!=" + AsText(p3),
p3.TakeValueColor()
);
def Edge4 = !IsNaN(close) and IsNaN(close[-1]);
AddChartBubble(
Edge4,
p4,
"GET OUT=" + AsText(p4),
p4.TakeValueColor()
);
Attachments
Last edited: