
Added hotzonrRSI & got the trendlinesAdd the HotzoneRSI as well. Draw a trendline and a break would be confirmation.
You are using an out of date browser. It may not display this or other websites correctly.
You should upgrade or use an alternative browser.
You should upgrade or use an alternative browser.
HOT ZONE - RSI with IV Percentile: Buy Stock or Sell Put Options Signal For ThinkOrSwim
- Thread starter chewie76
- Start date
Join useThinkScript to post your question to a community of 21,000+ developers and traders.
Monitor the WEEKLY chart and set alerts in the scan for the weekly timeframe.
@chewie76 : I know we're almost 4 years removed from when you first posted this, but I am very interested in the interaction between the RSI and the IV Percentile...Could you explain how to get the IV Percentile to plot on a weekly chart? Nothing I've tried has worked...
I look forward to your reply when and if you have a chance to so do...Thanks for your time and effort putting this whole thing together...It is much appreciated...
It works for me. Try looking at QQQ. I see it on the weekly.@chewie76 : I know we're almost 4 years removed from when you first posted this, but I am very interested in the interaction between the RSI and the IV Percentile...Could you explain how to get the IV Percentile to plot on a weekly chart? Nothing I've tried has worked...
I look forward to your reply when and if you have a chance to so do...Thanks for your time and effort putting this whole thing together...It is much appreciated...
@chewie76 : Thanks for the swift reply...I appreciate it...
Yeah, I see what you're saying about QQQ...Must be something with the Futures...I'm focused on NQ...I guess I'll use QQQ as a proxy...
Weird thing is I can't get the IV Percentile for GC for the Weekly and the Daily, just the lower timeframes...Looks like I'll have to use GLD as well...
In any event, at least I can proxy via the ETFs...Thanks for the tip...
Good Luck and Good Trading
@FateOwnzYou, @chewie76, thanks so much for hotzone indicators.It's gonna get heated up with the Hot Zone indicator! Hope you like it. It is a combination of RSI with IV percentile. The red colored area where IV is greater than RSI is the Hot Zone. Inside the Hot Zone are some colored circles on the midline. A yellow circle is a caution warning. This means it could be a good buy, but be cautious because it is a weak signal. The red circle is the HOT warning. This means it's time to buy or sell put options.
NOTE: there may be a string of red circles, so the first one that appears may not be the best entry because more could follow. You'll want to see the RSI and IV come back together for extra confirmation. Another confirmation is the ZSCORE upper indicator on this forum. Below are a few examples.
This indicator works great with the BTD indicator. Enjoy heating up your account with the Hot Zone!
This is an example of CWH on a daily chart.
View attachment 8096
This is an example of SPY on 12/24/2019. It showed the EXACT low! Then it ripped higher for the next 4 months.
View attachment 8097
This is an example of TSLA. 3 days this year were HOT buys in the middle of March 2020.
View attachment 8098
There is another version of this indicator that @FateOwnzYou helped make. SHOUT OUT to you fellow scripter! You're awesome! This version is cleaner to the eye and basically subtracts the RSI from IV and makes one single line so the greater the distance between them the further down the Hot Zone goes. I added the yellow and red circles, but you may want to adjust these settings for your trading style. The only negative is you don't actually see the actual RSI indicator, and some people who already use RSI would probably prefer using the other version to keep the RSI. The clear advantage is it gives clear buy and sell areas. Under the green line is a buy area. Over the red line is a sell area shaded in green (collect your cash money!) . (Any area in red could be considered a buy area, but the closer to the green line, the better.)
Lets look at a DAY TRADE in /RTY. Look at both of these Hot Zone indicators. Notice the one on the bottom. Circled areas for buys and sells.
View attachment 8099
Here is an example of QQQ on a daily chart. Notice the HOT circles and buy area on lower indicator and the sell areas.
View attachment 8100
Added ARROWS to the indicator. See below.
View attachment 8101
Below is an example of day trading /RTY using a 2 min chart. Look at the sell signal arrow and the two red hot buy dots that are highlighted, both followed by green buy arrows.
View attachment 8102
Hot Zone-RSI
Code:#HOTZONE-RSI: RSI-IV_percentile indicator #developed by Chewie76 9-30-2020 ### Global Variables ### declare lower; input length = 14; input over_Bought2 = 80; input over_Bought = 70; input over_Sold = 30; input over_Sold2 = 20; input price = close; input averageType = AverageType.WILDERS; input showBreakoutSignals = yes; input alertsOn = yes; input ChartBubblesOn = yes; ### RSI ### def NetChgAvg = MovingAverage(averageType, price - price[1], length); def TotChgAvg = MovingAverage(averageType, AbsValue(price - price[1]), length); def ChgRatio = if TotChgAvg != 0 then NetChgAvg / TotChgAvg else 0; plot RSI = 50 * (ChgRatio + 1); plot MiddleLine = 50; Middleline.SetDefaultColor(Color.YELLOW); RSI.SetLineWeight(2); plot OverSold = over_Sold; plot OverBought = over_Bought; plot UpSignal = if RSI crosses above OverSold then OverSold else Double.NaN; plot DownSignal = if RSI crosses below OverBought then OverBought else Double.NaN; AddCloud(Over_Bought2, OverBought, Color.dark_RED, Color.CURRENT); AddCloud(OverSold, Over_Sold2, Color.dark_GREEN, Color.CURRENT); UpSignal.SetHiding(!showBreakoutSignals); DownSignal.SetHiding(!showBreakoutSignals); RSI.DefineColor("OverBought", color.red); RSI.DefineColor("Normal", GetColor(9)); RSI.DefineColor("OverSold", color.green); RSI.AssignValueColor(if RSI > over_Bought then RSI.Color("OverBought") else if RSI < over_Sold then RSI.Color("OverSold") else RSI.Color("Normal")); OverSold.SetDefaultColor(color.green); OverBought.SetDefaultColor(color.red); UpSignal.SetDefaultColor(Color.UPTICK); UpSignal.SetPaintingStrategy(PaintingStrategy.ARROW_UP); DownSignal.SetDefaultColor(Color.DOWNTICK); DownSignal.SetPaintingStrategy(PaintingStrategy.ARROW_DOWN); AddCloud(RSI, OverBought, Color.RED, Color.CURRENT); AddCloud(OverSold, RSI, Color.GREEN, Color.CURRENT); ### IVPercentile ### def vol = imp_volatility(); input TimePeriod = 252; def data = if !isNaN(vol) then vol else vol[-1]; def hi = highest(data, TimePeriod); def lo = lowest(data, TimePeriod); plot Percentile = (data - lo) / (hi - lo) * 100; def lowend = Percentile < 25; def highend = Percentile > 50; input over_Bought1 = 98; input over_Sold1 = 2; Percentile.DefineColor("OverBought", Color.red); Percentile.DefineColor("Normal", color.magenta); Percentile.DefineColor("OverSold", Color.GREEN); Percentile.AssignValueColor(if Percentile > over_Bought1 then Percentile.color("OverBought") else if Percentile < over_Sold1 then Percentile.color("OverSold") else Percentile.color("Normal")); AddCloud(percentile, rsi, Color.RED, Color.CURRENT); ### Squeeze Relationship (RSI and IV) ### def RSIIV = if percentile - RSI >= 40 and RSI < 32 then 1 else 0; plot HOT = if RSIIV then 50 else Double.nan; HOT.SetPaintingStrategy(PaintingStrategy.POINTS); HOT.SetLineWeight(4); HOT.SetDefaultColor(Color.RED); def RSIIV1 = if (percentile - RSI >= 30 and RSI > 32 and RSI < 40, 1, Double.NaN); plot CAUTION = if RSIIV1 then 50 else Double.nan; CAUTION.SetPaintingStrategy(PaintingStrategy.POINTS); CAUTION.SetLineWeight(4); CAUTION.SetDefaultColor(Color.YELLOW); #Label def bullish = if RSI > MiddleLine then 1 else 0; def bearish = if RSI < MiddleLine then 1 else 0; AddLabel(ChartBubblesOn, if bullish then "BULLISH" else if bearish then "BEARISH" else if RSI > 100 then "hi" else "low", if bullish then color.green else if bearish then color.red else color.black); def condition1 = percentile - RSI >= 40 and RSI < 32; def condition2 = percentile - RSI >= 30 and RSI > 32 and RSI < 40; # Alert Alert(alertsOn and condition1, "HOT", Alert.BAR, Sound.Chimes); Alert(alertsOn and condition2, "CAUTION", Alert.BAR, Sound.bell);
Shareable link: http://tos.mx/9zhE6eE
Hot Zone line
Code:#HOTZONE LINE: RSI-IV_percentile indicator #developed by Chewie76 with help from FateOwnzYou 9-30-2020 ### Global Variables ### declare lower; input length = 14; input price = close; input averageType = AverageType.WILDERS; input showBreakoutSignals = yes; input alertsOn = yes; def NetChgAvg = MovingAverage(averageType, price - price[1], length); def TotChgAvg = MovingAverage(averageType, AbsValue(price - price[1]), length); def ChgRatio = if TotChgAvg != 0 then NetChgAvg / TotChgAvg else 0; def RSI = (50 * (ChgRatio + 1))*-1; plot MiddleLine = 0; plot TakeProfit = 60; plot BUY = -60; TakeProfit.SetLineWeight(1); TakeProfit.SetDefaultColor(Color.RED); BUY.SetLineWeight(1); BUY.SetDefaultColor(Color.GREEN); def vol = imp_volatility(); input TimePeriod = 252; def data = if !isNaN(vol) then vol else vol[-1]; def hi = highest(data, TimePeriod); def lo = lowest(data, TimePeriod); def Percentile = ((data - lo) / (hi - lo) * 100)*-1; def lowend = Percentile < 25; def highend = Percentile > 50; plot HotZone = percentile - rsi; HotZone.SetLineWeight(1); HotZone.SetDefaultColor(Color.MAGENTA); AddCloud(middleline, HotZone, Color.red, Color.CURRENT); AddCloud(takeprofit,HotZone, Color.CURRENT, Color.GREEN); ### Caution Relationship (RSI and IV) ### plot CAUTION = if(HotZone <-45 and HotZone > -60,1,double.nan); #plot CAUTION = if RSIIV1 then 0 else Double.nan; CAUTION.SetPaintingStrategy(PaintingStrategy.POINTS); CAUTION.SetLineWeight(4); CAUTION.SetDefaultColor(Color.YELLOW); ### HOT Relationship (RSI and IV) ### def RSIIV2 = if HotZone <= -60 then 1 else 0; plot HOT = if RSIIV2 then 0 else Double.nan; HOT.SetPaintingStrategy(PaintingStrategy.POINTS); HOT.SetLineWeight(4); HOT.SetDefaultColor(Color.RED); #Arrows# plot UpSignal = if HotZone crosses above BUY then BUY else Double.NaN; plot DownSignal = if HotZone crosses below TakeProfit then TakeProfit else Double.NaN; UpSignal.SetHiding(!showBreakoutSignals); DownSignal.SetHiding(!showBreakoutSignals); UpSignal.SetDefaultColor(Color.GREEN); DownSignal.SetDefaultColor(Color.RED); UpSignal.SetDefaultColor(Color.UPTICK); UpSignal.SetPaintingStrategy(PaintingStrategy.ARROW_UP); DownSignal.SetDefaultColor(Color.DOWNTICK); DownSignal.SetPaintingStrategy(PaintingStrategy.ARROW_DOWN); def condition1 = HotZone <= -60; def condition2 = HotZone < -45 and HotZone > -60; # Alert Alert(alertsOn and condition1, "HOT", Alert.BAR, Sound.Chimes); Alert(alertsOn and condition2, "CAUTION", Alert.BAR, Sound.bell);
Shareable link: http://tos.mx/ZaOhpnv
There are some traders who don't like to use lower indicators. Good news for YOU!!! I created an UPPER indicator that uses BOTH of these into one!!! You can turn on/off the arrows. You can turn on/off the hot and caution dots for the Hotzone and Hotzone line indicators. NOTE: IF you display dots for BOTH indicators, the Hotzone Line dots will plot over the Hotzone indicator dots. If you want to have the opposite, I believe you would just have to move their order within the code.
Below is an example of using the arrows from the HotZone Line indicator with the dots from the HotZone indicator on /ES 15 min chart.
View attachment 8103
Here is the link to the Hotzone UPPER indicator: http://tos.mx/6Co9B16
Do you want to make some serious long term cash?? Monitor the WEEKLY chart and set alerts in the scan for the weekly timeframe. Take a look at the below example of NDX. Hotzone will tell you when to get back into the market after a significant crash!
View attachment 8104
Looking for a watchlist column? Here you go!
HOTZONE RSI Watchlist: http://tos.mx/wjdMkBz
CODE:
#HOTZONE-RSI: WATCHLIST
#developed by Chewie76 9-30-2020
### Global Variables ###
input length = 14;
input over_Bought2 = 80;
input over_Bought = 70;
input over_Sold = 30;
input over_Sold2 = 20;
input price = close;
input averageType = AverageType.WILDERS;
input showBreakoutSignals = yes;
### RSI ###
def NetChgAvg = MovingAverage(averageType, price - price[1], length);
def TotChgAvg = MovingAverage(averageType, AbsValue(price - price[1]), length);
def ChgRatio = if TotChgAvg != 0 then NetChgAvg / TotChgAvg else 0;
DEF RSI = 50 * (ChgRatio + 1);
def MiddleLine = 50;
def OverSold = over_Sold;
def OverBought = over_Bought;
def UpSignal = if RSI crosses above OverSold then 1 else 0;
def DownSignal = if RSI crosses below OverBought then 2 else 0;
### IVPercentile ###
def vol = imp_volatility();
input TimePeriod = 252;
def data = if !isNaN(vol) then vol else vol[-1];
def hi = highest(data, TimePeriod);
def lo = lowest(data, TimePeriod);
def Percentile = (data - lo) / (hi - lo) * 100;
def lowend = Percentile < 25;
def highend = Percentile > 50;
input over_Bought1 = 98;
input over_Sold1 = 2;
### Squeeze Relationship (RSI and IV) ###
def RSIIV = if percentile - RSI >= 40 and RSI < 32 then 1 else 0;
def HOT = if RSIIV then 50 else Double.nan;
def RSIIV1 = if (percentile - RSI >= 30 and RSI > 32 and RSI < 40, 1, Double.NaN);
def CAUTION = if RSIIV1 then 50 else Double.nan;
AssignBackgroundColor(if DownSignal then color.RED else if Upsignal then color.GREEN else color.black);
AddLabel(yes, if Upsignal then "UP" else if Downsignal then "DOWN" else if RSIIV then “HOT” else if RSIIV1 then "CAUTION" else " ", if UPsignal then color.green else if Downsignal then color.red else if RSIIV then color.RED else if RSIIV1 then color.YELLOW else Color.black);
HOTZONE LINE Watchlist: http://tos.mx/lFkTO2b
CODE:
#HOTZONE LINE: WATCHLIST COLUMN
#developed by Chewie76 with help from FateOwnzYou 9-30-2020
### Global Variables ###
input length = 14;
input price = close;
input averageType = AverageType.WILDERS;
def NetChgAvg = MovingAverage(averageType, price - price[1], length);
def TotChgAvg = MovingAverage(averageType, AbsValue(price - price[1]), length);
def ChgRatio = if TotChgAvg != 0 then NetChgAvg / TotChgAvg else 0;
def RSI = (50 * (ChgRatio + 1)) * -1;
def MiddleLine = 0;
def TakeProfit = 60;
def BUY = -60;
def vol = imp_volatility();
input TimePeriod = 252;
def data = if !IsNaN(vol) then vol else vol[-1];
def hi = Highest(data, TimePeriod);
def lo = Lowest(data, TimePeriod);
def Percentile = ((data - lo) / (hi - lo) * 100) * -1;
def lowend = Percentile < 25;
def highend = Percentile > 50;
plot HotZone = Percentile - RSI;
def H = HotZone < -60;
def C = HotZone < -45 and HotZone > -60;
def UpSignal = if HotZone crosses above BUY then 1 else 0;
def DownSignal = if HotZone crosses below TakeProfit then 2 else 0;
AddLabel(yes, if Upsignal then "UP" else if Downsignal then "DOWN" else if H then “HOT” else if C then "CAUTION" else " ", if Upsignal then color.green else if Downsignal then color.red else if H then color.RED else if C then color.YELLOW else Color.BLACK);
AssignBackgroundColor(if H then color.RED else if C then color.YELLOW else color.black);
Adjust the timeframe on it. It will look like the below. It will have a yellow CAUTION for the yellow dot and a red HOT for red dot. The reason there are two columns is because they are set to different timeframes.
View attachment 8105
Looking for a Scan? The below links alert for yellow and red dots along with arrows.
Here is a BUY scan. http://tos.mx/Qh32soR
Here is a SELL scan. http://tos.mx/87AySW1
Let me know what you think!!!!!
Can you please share scanner that we can use on daily and hourly?
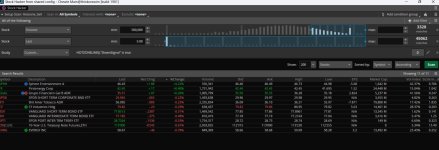
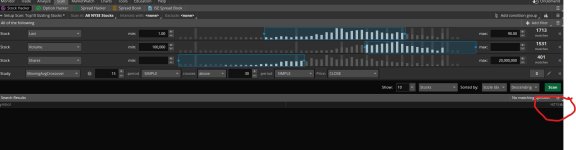
Also I used below scanners and it's not showing hotzone column (attached screenshot)
Here is a BUY scan. http://tos.mx/Qh32soR
Here is a SELL scan. http://tos.mx/87AySW1
I tried to use HZ1 and HZ15 and no records showing. Please see the attached screenshot.
Attachments
UndefinedUo
New member
Can anyone more knowledgeable than me, help with adding a histogram for RSI from the middle line? I have been able to add one it however it comes up from 0 instead of the mid line.

Can anyone more knowledgeable than me, help with adding a histogram for RSI from the middle line? I have been able to add one it however it comes up from 0 instead of the mid line.
View attachment 22672
As a mathematical precept, the baseline for histograms is at zero.
The ToS app does not provide the ability to change that.
Given that RSI and your other plots use 50 as the midline, a workaround would be to subtract 50 from your definitions. Which will allow you to successfully use the histogram paint strategy.
rajanpanchal
New member
How to enable arrows? Sorry new to tosMake sure arrows are enabled in the settings.
The arrows should automatically plot.How to enable arrows? Sorry new to tos
Just saw this today. Looks very interesting, but opening the share links merely loads the links (not the charts) and provides no obvious way to get to the charts. Is there a way to share the links so they automatically open the charts?It's gonna get heated up with the Hot Zone indicator! Hope you like it. It is a combination of RSI with IV percentile. The red colored area where IV is greater than RSI is the Hot Zone. Inside the Hot Zone are some colored circles on the midline. A yellow circle is a caution warning. This means it could be a good buy, but be cautious because it is a weak signal. The red circle is the HOT warning. This means it's time to buy or sell put options.
NOTE: there may be a string of red circles, so the first one that appears may not be the best entry because more could follow. You'll want to see the RSI and IV come back together for extra confirmation. Another confirmation is the ZSCORE upper indicator on this forum. Below are a few examples.
This indicator works great with the BTD indicator. Enjoy heating up your account with the Hot Zone!
This is an example of CWH on a daily chart.
View attachment 8096
This is an example of SPY on 12/24/2019. It showed the EXACT low! Then it ripped higher for the next 4 months.
View attachment 8097
This is an example of TSLA. 3 days this year were HOT buys in the middle of March 2020.
View attachment 8098
There is another version of this indicator that @FateOwnzYou helped make. SHOUT OUT to you fellow scripter! You're awesome! This version is cleaner to the eye and basically subtracts the RSI from IV and makes one single line so the greater the distance between them the further down the Hot Zone goes. I added the yellow and red circles, but you may want to adjust these settings for your trading style. The only negative is you don't actually see the actual RSI indicator, and some people who already use RSI would probably prefer using the other version to keep the RSI. The clear advantage is it gives clear buy and sell areas. Under the green line is a buy area. Over the red line is a sell area shaded in green (collect your cash money!) . (Any area in red could be considered a buy area, but the closer to the green line, the better.)
Lets look at a DAY TRADE in /RTY. Look at both of these Hot Zone indicators. Notice the one on the bottom. Circled areas for buys and sells.
View attachment 8099
Here is an example of QQQ on a daily chart. Notice the HOT circles and buy area on lower indicator and the sell areas.
View attachment 8100
Added ARROWS to the indicator. See below.
View attachment 8101
Below is an example of day trading /RTY using a 2 min chart. Look at the sell signal arrow and the two red hot buy dots that are highlighted, both followed by green buy arrows.
View attachment 8102
Hot Zone-RSI
Code:#HOTZONE-RSI: RSI-IV_percentile indicator #developed by Chewie76 9-30-2020 ### Global Variables ### declare lower; input length = 14; input over_Bought2 = 80; input over_Bought = 70; input over_Sold = 30; input over_Sold2 = 20; input price = close; input averageType = AverageType.WILDERS; input showBreakoutSignals = yes; input alertsOn = yes; input ChartBubblesOn = yes; ### RSI ### def NetChgAvg = MovingAverage(averageType, price - price[1], length); def TotChgAvg = MovingAverage(averageType, AbsValue(price - price[1]), length); def ChgRatio = if TotChgAvg != 0 then NetChgAvg / TotChgAvg else 0; plot RSI = 50 * (ChgRatio + 1); plot MiddleLine = 50; Middleline.SetDefaultColor(Color.YELLOW); RSI.SetLineWeight(2); plot OverSold = over_Sold; plot OverBought = over_Bought; plot UpSignal = if RSI crosses above OverSold then OverSold else Double.NaN; plot DownSignal = if RSI crosses below OverBought then OverBought else Double.NaN; AddCloud(Over_Bought2, OverBought, Color.dark_RED, Color.CURRENT); AddCloud(OverSold, Over_Sold2, Color.dark_GREEN, Color.CURRENT); UpSignal.SetHiding(!showBreakoutSignals); DownSignal.SetHiding(!showBreakoutSignals); RSI.DefineColor("OverBought", color.red); RSI.DefineColor("Normal", GetColor(9)); RSI.DefineColor("OverSold", color.green); RSI.AssignValueColor(if RSI > over_Bought then RSI.Color("OverBought") else if RSI < over_Sold then RSI.Color("OverSold") else RSI.Color("Normal")); OverSold.SetDefaultColor(color.green); OverBought.SetDefaultColor(color.red); UpSignal.SetDefaultColor(Color.UPTICK); UpSignal.SetPaintingStrategy(PaintingStrategy.ARROW_UP); DownSignal.SetDefaultColor(Color.DOWNTICK); DownSignal.SetPaintingStrategy(PaintingStrategy.ARROW_DOWN); AddCloud(RSI, OverBought, Color.RED, Color.CURRENT); AddCloud(OverSold, RSI, Color.GREEN, Color.CURRENT); ### IVPercentile ### def vol = imp_volatility(); input TimePeriod = 252; def data = if !isNaN(vol) then vol else vol[-1]; def hi = highest(data, TimePeriod); def lo = lowest(data, TimePeriod); plot Percentile = (data - lo) / (hi - lo) * 100; def lowend = Percentile < 25; def highend = Percentile > 50; input over_Bought1 = 98; input over_Sold1 = 2; Percentile.DefineColor("OverBought", Color.red); Percentile.DefineColor("Normal", color.magenta); Percentile.DefineColor("OverSold", Color.GREEN); Percentile.AssignValueColor(if Percentile > over_Bought1 then Percentile.color("OverBought") else if Percentile < over_Sold1 then Percentile.color("OverSold") else Percentile.color("Normal")); AddCloud(percentile, rsi, Color.RED, Color.CURRENT); ### Squeeze Relationship (RSI and IV) ### def RSIIV = if percentile - RSI >= 40 and RSI < 32 then 1 else 0; plot HOT = if RSIIV then 50 else Double.nan; HOT.SetPaintingStrategy(PaintingStrategy.POINTS); HOT.SetLineWeight(4); HOT.SetDefaultColor(Color.RED); def RSIIV1 = if (percentile - RSI >= 30 and RSI > 32 and RSI < 40, 1, Double.NaN); plot CAUTION = if RSIIV1 then 50 else Double.nan; CAUTION.SetPaintingStrategy(PaintingStrategy.POINTS); CAUTION.SetLineWeight(4); CAUTION.SetDefaultColor(Color.YELLOW); #Label def bullish = if RSI > MiddleLine then 1 else 0; def bearish = if RSI < MiddleLine then 1 else 0; AddLabel(ChartBubblesOn, if bullish then "BULLISH" else if bearish then "BEARISH" else if RSI > 100 then "hi" else "low", if bullish then color.green else if bearish then color.red else color.black); def condition1 = percentile - RSI >= 40 and RSI < 32; def condition2 = percentile - RSI >= 30 and RSI > 32 and RSI < 40; # Alert Alert(alertsOn and condition1, "HOT", Alert.BAR, Sound.Chimes); Alert(alertsOn and condition2, "CAUTION", Alert.BAR, Sound.bell);
Shareable link: http://tos.mx/9zhE6eE
Hot Zone line
Code:#HOTZONE LINE: RSI-IV_percentile indicator #developed by Chewie76 with help from FateOwnzYou 9-30-2020 ### Global Variables ### declare lower; input length = 14; input price = close; input averageType = AverageType.WILDERS; input showBreakoutSignals = yes; input alertsOn = yes; def NetChgAvg = MovingAverage(averageType, price - price[1], length); def TotChgAvg = MovingAverage(averageType, AbsValue(price - price[1]), length); def ChgRatio = if TotChgAvg != 0 then NetChgAvg / TotChgAvg else 0; def RSI = (50 * (ChgRatio + 1))*-1; plot MiddleLine = 0; plot TakeProfit = 60; plot BUY = -60; TakeProfit.SetLineWeight(1); TakeProfit.SetDefaultColor(Color.RED); BUY.SetLineWeight(1); BUY.SetDefaultColor(Color.GREEN); def vol = imp_volatility(); input TimePeriod = 252; def data = if !isNaN(vol) then vol else vol[-1]; def hi = highest(data, TimePeriod); def lo = lowest(data, TimePeriod); def Percentile = ((data - lo) / (hi - lo) * 100)*-1; def lowend = Percentile < 25; def highend = Percentile > 50; plot HotZone = percentile - rsi; HotZone.SetLineWeight(1); HotZone.SetDefaultColor(Color.MAGENTA); AddCloud(middleline, HotZone, Color.red, Color.CURRENT); AddCloud(takeprofit,HotZone, Color.CURRENT, Color.GREEN); ### Caution Relationship (RSI and IV) ### plot CAUTION = if(HotZone <-45 and HotZone > -60,1,double.nan); #plot CAUTION = if RSIIV1 then 0 else Double.nan; CAUTION.SetPaintingStrategy(PaintingStrategy.POINTS); CAUTION.SetLineWeight(4); CAUTION.SetDefaultColor(Color.YELLOW); ### HOT Relationship (RSI and IV) ### def RSIIV2 = if HotZone <= -60 then 1 else 0; plot HOT = if RSIIV2 then 0 else Double.nan; HOT.SetPaintingStrategy(PaintingStrategy.POINTS); HOT.SetLineWeight(4); HOT.SetDefaultColor(Color.RED); #Arrows# plot UpSignal = if HotZone crosses above BUY then BUY else Double.NaN; plot DownSignal = if HotZone crosses below TakeProfit then TakeProfit else Double.NaN; UpSignal.SetHiding(!showBreakoutSignals); DownSignal.SetHiding(!showBreakoutSignals); UpSignal.SetDefaultColor(Color.GREEN); DownSignal.SetDefaultColor(Color.RED); UpSignal.SetDefaultColor(Color.UPTICK); UpSignal.SetPaintingStrategy(PaintingStrategy.ARROW_UP); DownSignal.SetDefaultColor(Color.DOWNTICK); DownSignal.SetPaintingStrategy(PaintingStrategy.ARROW_DOWN); def condition1 = HotZone <= -60; def condition2 = HotZone < -45 and HotZone > -60; # Alert Alert(alertsOn and condition1, "HOT", Alert.BAR, Sound.Chimes); Alert(alertsOn and condition2, "CAUTION", Alert.BAR, Sound.bell);
Shareable link: http://tos.mx/ZaOhpnv
There are some traders who don't like to use lower indicators. Good news for YOU!!! I created an UPPER indicator that uses BOTH of these into one!!! You can turn on/off the arrows. You can turn on/off the hot and caution dots for the Hotzone and Hotzone line indicators. NOTE: IF you display dots for BOTH indicators, the Hotzone Line dots will plot over the Hotzone indicator dots. If you want to have the opposite, I believe you would just have to move their order within the code.
Below is an example of using the arrows from the HotZone Line indicator with the dots from the HotZone indicator on /ES 15 min chart.
View attachment 8103
Here is the link to the Hotzone UPPER indicator: http://tos.mx/6Co9B16
Do you want to make some serious long term cash?? Monitor the WEEKLY chart and set alerts in the scan for the weekly timeframe. Take a look at the below example of NDX. Hotzone will tell you when to get back into the market after a significant crash!
View attachment 8104
Looking for a watchlist column? Here you go!
HOTZONE RSI Watchlist: http://tos.mx/wjdMkBz
CODE:
#HOTZONE-RSI: WATCHLIST
#developed by Chewie76 9-30-2020
### Global Variables ###
input length = 14;
input over_Bought2 = 80;
input over_Bought = 70;
input over_Sold = 30;
input over_Sold2 = 20;
input price = close;
input averageType = AverageType.WILDERS;
input showBreakoutSignals = yes;
### RSI ###
def NetChgAvg = MovingAverage(averageType, price - price[1], length);
def TotChgAvg = MovingAverage(averageType, AbsValue(price - price[1]), length);
def ChgRatio = if TotChgAvg != 0 then NetChgAvg / TotChgAvg else 0;
DEF RSI = 50 * (ChgRatio + 1);
def MiddleLine = 50;
def OverSold = over_Sold;
def OverBought = over_Bought;
def UpSignal = if RSI crosses above OverSold then 1 else 0;
def DownSignal = if RSI crosses below OverBought then 2 else 0;
### IVPercentile ###
def vol = imp_volatility();
input TimePeriod = 252;
def data = if !isNaN(vol) then vol else vol[-1];
def hi = highest(data, TimePeriod);
def lo = lowest(data, TimePeriod);
def Percentile = (data - lo) / (hi - lo) * 100;
def lowend = Percentile < 25;
def highend = Percentile > 50;
input over_Bought1 = 98;
input over_Sold1 = 2;
### Squeeze Relationship (RSI and IV) ###
def RSIIV = if percentile - RSI >= 40 and RSI < 32 then 1 else 0;
def HOT = if RSIIV then 50 else Double.nan;
def RSIIV1 = if (percentile - RSI >= 30 and RSI > 32 and RSI < 40, 1, Double.NaN);
def CAUTION = if RSIIV1 then 50 else Double.nan;
AssignBackgroundColor(if DownSignal then color.RED else if Upsignal then color.GREEN else color.black);
AddLabel(yes, if Upsignal then "UP" else if Downsignal then "DOWN" else if RSIIV then “HOT” else if RSIIV1 then "CAUTION" else " ", if UPsignal then color.green else if Downsignal then color.red else if RSIIV then color.RED else if RSIIV1 then color.YELLOW else Color.black);
HOTZONE LINE Watchlist: http://tos.mx/lFkTO2b
CODE:
#HOTZONE LINE: WATCHLIST COLUMN
#developed by Chewie76 with help from FateOwnzYou 9-30-2020
### Global Variables ###
input length = 14;
input price = close;
input averageType = AverageType.WILDERS;
def NetChgAvg = MovingAverage(averageType, price - price[1], length);
def TotChgAvg = MovingAverage(averageType, AbsValue(price - price[1]), length);
def ChgRatio = if TotChgAvg != 0 then NetChgAvg / TotChgAvg else 0;
def RSI = (50 * (ChgRatio + 1)) * -1;
def MiddleLine = 0;
def TakeProfit = 60;
def BUY = -60;
def vol = imp_volatility();
input TimePeriod = 252;
def data = if !IsNaN(vol) then vol else vol[-1];
def hi = Highest(data, TimePeriod);
def lo = Lowest(data, TimePeriod);
def Percentile = ((data - lo) / (hi - lo) * 100) * -1;
def lowend = Percentile < 25;
def highend = Percentile > 50;
plot HotZone = Percentile - RSI;
def H = HotZone < -60;
def C = HotZone < -45 and HotZone > -60;
def UpSignal = if HotZone crosses above BUY then 1 else 0;
def DownSignal = if HotZone crosses below TakeProfit then 2 else 0;
AddLabel(yes, if Upsignal then "UP" else if Downsignal then "DOWN" else if H then “HOT” else if C then "CAUTION" else " ", if Upsignal then color.green else if Downsignal then color.red else if H then color.RED else if C then color.YELLOW else Color.BLACK);
AssignBackgroundColor(if H then color.RED else if C then color.YELLOW else color.black);
Adjust the timeframe on it. It will look like the below. It will have a yellow CAUTION for the yellow dot and a red HOT for red dot. The reason there are two columns is because they are set to different timeframes.
View attachment 8105
Looking for a Scan? The below links alert for yellow and red dots along with arrows.
Here is a BUY scan. http://tos.mx/Qh32soR
Here is a SELL scan. http://tos.mx/87AySW1
Let me know what you think!!!!!
Just looked at this thread today, and it looks very interesting. When I used the shared links on the 1st page, I just got messages that they were downloaded but no obvious way to get the charts. Do you have any shared links that will directly open the charts you posted on the 1st page?The arrows should automatically plot.
Last edited by a moderator:
BerryMcCawkiner
New member
chewie ive been using your indicator for years now and its easily my favorite since RSI bounces are my favorite pattern now im not an options guy its just too complicated for my brain is there another indicator that works similar to the volatility part of hotzone that can plot on every chart? because the volatility part doesnt always plotThe arrows should automatically plot.
You will probably like this one. It is close to RSI, but it's on the upper chart. Compare them.chewie ive been using your indicator for years now and its easily my favorite since RSI bounces are my favorite pattern now im not an options guy its just too complicated for my brain is there another indicator that works similar to the volatility part of hotzone that can plot on every chart? because the volatility part doesnt always plot
https://usethinkscript.com/threads/volatility-gaussian-bands-bigbeluga-for-thinkorswim.19823/
Last edited by a moderator:
rajanpanchal
New member
The script uses IV rank or IV percentile?
IV percentile.The script uses IV rank or IV percentile?
BerryMcCawkiner
New member
You will probably like this one. It is close to RSI, but it's on the upper chart. Compare them.
https://usethinkscript.com/threads/volatility-gaussian-bands-bigbeluga-for-thinkorswim.19823/
i dont know what it is about hotzone but it works very well for larger cap stocks that are having an rsi bounces it just doesnt plot with every single ticker
Last edited by a moderator:
Some tickers don't have IV plotted.i dont know what it is about hotzone but it works very well for larger cap stocks that are having an rsi bounces it just doesnt plot with every single ticker
lolreconlol
Active member
Getting some hot signals on the SPY daily.. it's been quite some time since I set those alerts! Let's see how this plays out
Similar threads
-
 Volume Buy Sell Pressure with Hot Percent for ThinkorSwim
- Started by horserider
- Replies: 138
-

-
 Repaints Smooth-Sailing vs Jitter-Zone Indicator for Scalping For ThinkOrSwim
- Started by TraderZen
- Replies: 53
-
Bill Williams Green, Squat, Fade, Fake Bars and Zone Bars for ThinkorSwim
- Started by henry1224
- Replies: 30
-
 Donchian Channel with Fibonacci Zone Indicator for ThinkorSwim
- Started by BenTen
- Replies: 1
Not the exact question you're looking for?
Start a new thread and receive assistance from our community.
87k+
Posts
785
Online
Similar threads
-
Volume Buy Sell Pressure with Hot Percent for ThinkorSwim
- Started by horserider
- Replies: 138
-
-
Repaints Smooth-Sailing vs Jitter-Zone Indicator for Scalping For ThinkOrSwim
- Started by TraderZen
- Replies: 53
-
Bill Williams Green, Squat, Fade, Fake Bars and Zone Bars for ThinkorSwim
- Started by henry1224
- Replies: 30
-
Donchian Channel with Fibonacci Zone Indicator for ThinkorSwim
- Started by BenTen
- Replies: 1
The Market Trading Game Changer
Join 2,500+ subscribers inside the useThinkScript VIP Membership Club
- Exclusive indicators
- Proven strategies & setups
- Private Discord community
- ‘Buy The Dip’ signal alerts
- Exclusive members-only content
- Add-ons and resources
- 1 full year of unlimited support
Frequently Asked Questions
What is useThinkScript?
useThinkScript is the #1 community of stock market investors using indicators and other tools to power their trading strategies. Traders of all skill levels use our forums to learn about scripting and indicators, help each other, and discover new ways to gain an edge in the markets.
How do I get started?
We get it. Our forum can be intimidating, if not overwhelming. With thousands of topics, tens of thousands of posts, our community has created an incredibly deep knowledge base for stock traders. No one can ever exhaust every resource provided on our site.
If you are new, or just looking for guidance, here are some helpful links to get you started.
- The most viewed thread:
https://usethinkscript.com/threads/repainting-trend-reversal-for-thinkorswim.183/ - Our most popular indicator:
https://usethinkscript.com/threads/buy-the-dip-indicator-for-thinkorswim.3553/ - Answers to frequently asked questions:
https://usethinkscript.com/threads/answers-to-commonly-asked-questions.6006/
What are the benefits of VIP Membership?
VIP members get exclusive access to these proven and tested premium indicators: Buy the Dip, Advanced Market Moves 2.0, Take Profit, and Volatility Trading Range. In addition, VIP members get access to over 50 VIP-only custom indicators, add-ons, and strategies, private VIP-only forums, private Discord channel to discuss trades and strategies in real-time, customer support, trade alerts, and much more. Learn all about VIP membership here.
How can I access the premium indicators?
To access the premium indicators, which are plug and play ready, sign up for VIP membership here.