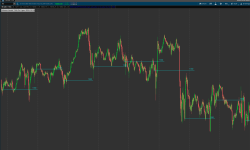
Horizontal Line @ Specific Time

RlyNotUrBroker

New member
Hello. I'm sure this is a basic question but I'm just getting into ThinkScript but I can't figure out for the life of me how to get a horizontal line to plot at the previous day close. what I have is as follows:

def lasttrade = close;
plot test = close;
def aggregation = aggregationPeriod.DAY;

it will plot a line at every close price for the chart timeframe I'm looking at, but I want it to plot only a horizontal line at the previous day close.
Basically I want it to look at only the previous candle and plot a horizontal line across the chart that marks the previous close
I've tried the painting strategy.HORIZONTAL but it gives me a syntax error and I don't know where to go with this anymore. any help is appreciated!
 
Last edited by a moderator:
Basically I want it to look at only the previous candle and plot a horizontal line across the chart that marks the previous close
Try this
Ruby:
input daysback       = 1;
plot close_priordays = HighestAll(if IsNaN(close[-1]) and !IsNaN(close)
                                  then close(period = AggregationPeriod.DAY)[daysback]
                                  else Double.NaN);
 
Last edited by a moderator:
Try this
Ruby:
input daysback       = 1;
plot close_priordays = HighestAll(if IsNaN(close[-1]) and !IsNaN(close)
                                  then close(period = AggregationPeriod.DAY)[daysback]
                                  else Double.NaN);
that did work, thank you very much! where I'm confused really is the isNan operator. in plain English, it looks like you're saying plot the highest of all candles if the close fo the next candle (which isn't technically plotted yet) is not a number, but I don't know what the !isnan(close) is trying to tell me. If you could elaborate, that would be awesome
 
!isnan(close) is a plotted bar and isnan(close[-1]) is saying the next bar has not been plotted yet. This basically defines the last plotted bar of what is defined in the 'then' statement, close(period=aggregationperiod.day)[1]. The ' else double.nan' statement isolates the 'then close(period=aggregationperiod.day)[1] value, and the Highestall plots that value across the whole chart.
 
!isnan(close) is a plotted bar and isnan(close[-1]) is saying the next bar has not been plotted yet. This basically defines the last plotted bar of what is defined in the 'then' statement, close(period=aggregationperiod.day)[1]. The ' else double.nan' statement isolates the 'then close(period=aggregationperiod.day)[1] value, and the Highestall plots that value across the whole chart.
Is there any way to not make it extend left
 
Is there any way to not make it extend left

This will plot from the lookback day's close to the right edge of the chart or optionally only show for the current day if selected.

Capture.jpg
Ruby:
#Previous Lookback Day's Close extended to right edge with option to limit it to show only current day (thisday == 0)

input showtodayonly = no;
input lookback      = 1;

#Defines each Day's Bars with zero for current day and +1 for each subsequent day
def ymd      = GetYYYYMMDD();
def candles  = !IsNaN(close);
def capture  = candles and ymd != ymd[1];
def dayCount = CompoundValue(1, if capture then dayCount[1] + 1 else dayCount[1], 0);
def thisDay  = (HighestAll(dayCount) - dayCount);

#Lookback Day's Close defined and extended to right edge
def closeday = if thisDay == lookback and GetTime() <= RegularTradingEnd(GetYYYYMMDD()) then close else closeday[1];

#Lookback Day's Close plotted from that Close to the right edge unless showtodayonly selected, limiting that plot to current day
plot dataclose = if showtodayonly and thisDay > 0
                 then Double.NaN
                 else closeday;
dataclose.SetPaintingStrategy(PaintingStrategy.HORIZONTAL);
dataclose.SetDefaultColor(Color.MAGENTA);
#
 
This will plot from the lookback day's close to the right edge of the chart or optionally only show for the current day if selected.
Awesome thanks, can we also auto plot the T+2 High and T+2 Low the same way. On SPY I have noticed it really magnets to the end of the prior days vwap 4 pm close can you code that to auto plot as well. trying to auto plot everything I can. I should of taken programming instead of Cisco networking in school. Thanks again here is a SPY 1d1m chart with Sleepys code for the close as well as daily moving averages plotted on the 1m chart for anyone that needs it. you can disregard the pink lines they are where the stops are from a tpo chart. https://tos.mx/rEk1ICp
 
Awesome thanks, can we also auto plot the T+2 High and T+2 Low the same way. On SPY I have noticed it really magnets to the end of the prior days vwap 4 pm close can you code that to auto plot as well. trying to auto plot everything I can. I should of taken programming instead of Cisco networking in school. Thanks again here is a SPY 1d1m chart with Sleepys code for the close as well as daily moving averages plotted on the 1m chart for anyone that needs it. you can disregard the pink lines they are where the stops are from a tpo chart. https://tos.mx/rEk1ICp

Here is a the additional data you requested

Capture.jpg
Ruby:
#Previous Lookback Day's Close extended to right edge with option to limit it to show only current day (thisday == 0)

input showtodayonly = no;
input lookback      = 2;

#Defines each Day's Bars with zero for current day and +1 for each subsequent day
def ymd      = GetYYYYMMDD();
def candles  = !IsNaN(close);
def capture  = candles and ymd != ymd[1];
def dayCount = CompoundValue(1, if capture then dayCount[1] + 1 else dayCount[1], 0);
def thisDay  = (HighestAll(dayCount) - dayCount);

#Lookback Day's Close defined and extended to right edge
def closeday   = if thisDay == lookback and
                    GetTime() <= RegularTradingEnd(GetYYYYMMDD())
                 then close
                 else closeday[1];

#Lookback Day's Close plotted from that Close to the right edge unless showtodayonly selected, limiting that plot to current day
plot dataclose = if showtodayonly and thisDay > 0
                 then Double.NaN
                 else closeday;
dataclose.SetPaintingStrategy(PaintingStrategy.HORIZONTAL);
dataclose.SetDefaultColor(Color.yellow);

#Lookback Day's Close defined and extended to right edge
def highday    = if thisDay == lookback and
                    GetTime() <= RegularTradingEnd(GetYYYYMMDD())
                 then high(period=aggregationPeriod.DAY)
                 else highday[1];

#Lookback Day's High plotted to the right edge unless showtodayonly selected, limiting that plot to current day
plot datahigh  = if showtodayonly and thisDay > 0
                 then Double.NaN
                 else highday;
datahigh.SetPaintingStrategy(PaintingStrategy.HORIZONTAL);
datahigh.SetDefaultColor(Color.green);

#Lookback Day's Low plotted to the right edge unless showtodayonly selected, limiting that plot to current day
def lowday     = if thisDay == lookback and
                    GetTime() <= RegularTradingEnd(GetYYYYMMDD())
                 then low(period=aggregationPeriod.DAY)
                 else lowday[1];
plot datalow   = if showtodayonly and thisDay > 0
                 then Double.NaN
                 else lowday;
datalow.SetPaintingStrategy(PaintingStrategy.HORIZONTAL);
datalow.SetDefaultColor(Color.red);

#Lookback Day's Low plotted to the right edge unless showtodayonly selected, limiting that plot to current day
def vwapday     = if thisDay == lookback and
                    GetTime() <= RegularTradingEnd(GetYYYYMMDD())
                 then reference vwap
                 else vwapday[1];
plot datavwap   = if showtodayonly and thisDay > 0
                 then Double.NaN
                 else vwapday;
datavwap.SetPaintingStrategy(PaintingStrategy.HORIZONTAL);
datavwap.SetDefaultColor(Color.cyan);

#Bubbles
input showbubbles = yes;
input bubblemover = 2;
def bm  = bubblemover;
def bm1 = bm +1;
addchartBubble(showbubbles and isnan(close[bm]) and !isnan(close[bm1]), dataclose[bm], "C"+lookback, dataclose.takeValueColor());
addchartBubble(showbubbles and isnan(close[bm]) and !isnan(close[bm1]), datahigh[bm], "H"+lookback, datahigh.takeValueColor());
addchartBubble(showbubbles and isnan(close[bm]) and !isnan(close[bm1]), datalow[bm], "L"+lookback, datalow.takeValueColor());
addchartBubble(showbubbles and isnan(close[bm]) and !isnan(close[bm1]), datavwap[bm], "VWAP"+lookback, datavwap.takeValueColor());
#
 
  • Like
Reactions: Wes
Wouldn't you know, I'm still a loser when it comes to trying to figure this **** out... what i thought was gonna be an easy little splicing of a few lines of a code turned into a pain in the nuts...only because Im not sure how, why, what, where....who?? I'm just looking for a code that will allow me to plot a horizontal line from the open of a candle at a certain time. EX: the open of the candle at 12 midnight thru 5pm that day. would be cool to be able to apply inputs to be able to toggle from showtodayonly as well as start and end time, but not necessary. I surely appreciate any help on this!
 
@GabrielNY
Ruby:
input date = 20220608;
def starttime = 0000;
def endtime = 1700;
def today = (daysfromdate(date) == 0 and secondstilltime(endtime) > 0) and (daystilldate(date) == 0 and secondsfromtime(starttime) >0);
def dayopen = if secondsFromTime(starttime) == 0 then open else dayopen[1];

plot DayOpenPlot = if today then dayopen else Double.NaN;
 
input date = 20220608; def starttime = 0000; def endtime = 1700; def today = (daysfromdate(date) == 0 and secondstilltime(endtime) > 0) and (daystilldate(date) == 0 and secondsfromtime(starttime) >0); def dayopen = if secondsFromTime(starttime) == 0 then open else dayopen[1]; plot DayOpenPlot = if today then dayopen else Double.NaN;
Well doggone! I appreciate ya! not just for doing that for me, but also giving me a better understanding of how i was off track by studying your code! go ahead and let the boss know you need a little raise, and take the rest of the day off! thanks again... another question just because...do you happen to know what differentiates a code that gets date manually input and one that just automatically shows up every day? Im trying different things out and havent yet stumbled across code that shows one and then the other...good looking out!
 
@GabrielNY It depends on the intended purpose of the code.
The code above was originally written to display a plot from 6 p.m. of the prior day until 6 p.m. of the current day.
I just modified it to fit your needs.
You could leave out the date input, daysfromdate(date), and daystilldate(date) and still get the result you were looking for.
 
Hello. I'm sure this is a basic question but I'm just getting into ThinkScript but I can't figure out for the life of me how to get a horizontal line to plot at the previous day close. what I have is as follows:

def lasttrade = close;
plot test = close;
def aggregation = aggregationPeriod.DAY;

it will plot a line at every close price for the chart timeframe I'm looking at, but I want it to plot only a horizontal line at the previous day close.
Basically I want it to look at only the previous candle and plot a horizontal line across the chart that marks the previous close
I've tried the painting strategy.HORIZONTAL but it gives me a syntax error and I don't know where to go with this anymore. any help is appreciated!
Try this study.
https://usethinkscript.com/threads/horizontal-line-at-specific-time.7327/#post-99790
 
Last edited by a moderator:
Hi, is there any indicator that auto plots a horizontal price line on the chart at specific time of the day? Or if no indicator as of now, can create a new indicator? I want the indicator to plot 4 times during the day, i.e. 9am, 11am, 1pm, 3pm CST. Thank you so much and appreciate.
 
Hi, is there any indicator that auto plots a horizontal price line on the chart at specific time of the day? Or if no indicator as of now, can create a new indicator? I want the indicator to plot 4 times during the day, i.e. 9am, 11am, 1pm, 3pm CST. Thank you so much and appreciate.

This will give you an option to only show the lines during regular trading hours. Since thinkscript only uses ET, the times you requested are converted to ET. When displayed on a chart setting of CT, they will appear as you requested.

Screenshot-2022-12-21-112310.png
Ruby:
#Horizontal_Lines_at_SelectTimes_RTH_limit_option
input price = high;

input time1 = 1000;
input time2 = 1200;
input time3 = 1400;
input time4 = 1600;
input rthr_lines = yes;

def na      = Double.NaN;

script rth {
input tilltime = 1000;
def sec1 = secondsFromTime(1600);
def sec2 = secondsFromTime(tilltime);
def isTime1 = (sec1 >= 0 and sec1[1] < 0) or (sec1 < sec1[1] and sec1 >= 0);
def isTime2 = (sec2 >= 0 and sec2[1] < 0) or (sec2 < sec2[1] and sec2 >= 0);
def Range = compoundValue(1, if isTime1 then 1 else if isTime2 then 0 else Range[1], 0);
plot xa = range;
}

def ln1     = if SecondsFromTime(time1) == 0 then price else ln1[1];
def ln2     = if SecondsFromTime(time2) == 0 then price else ln2[1];
def ln3     = if SecondsFromTime(time3) == 0 then price else ln3[1];
def ln4     = if SecondsFromTime(time4) == 0 then price else ln4[1];

plot line1  = if rthr_lines and rth(time1) then na else ln1;
plot line2  = if rthr_lines and rth(time2) then na else ln2;
plot line3  = if rthr_lines and rth(time3) then na else ln3;
plot line4  = ln4[1];

line1.SetPaintingStrategy(PaintingStrategy.DASHES);
line2.SetPaintingStrategy(PaintingStrategy.DASHES);
line3.SetPaintingStrategy(PaintingStrategy.DASHES);
line4.SetPaintingStrategy(PaintingStrategy.DASHES);
 
Last edited:
@SleepyZ Thank you so much. The indicator plot differently on different timeframe. I want to see all plot lines the same thing on all timeframes, i.e. 3m, 5m, 10m, 15m, 30m, 1h, 4h. Is it possible to plot the lines at exactly the specify time regardless of close/open/high/low? Or if possible, indicator has the option to plot at close/open/high/low base on 5m candle, and all timeframes see the same plot price lines.
 
@SleepyZ Thank you so much. The indicator plot differently on different timeframe. I want to see all plot lines the same thing on all timeframes, i.e. 3m, 5m, 10m, 15m, 30m, 1h, 4h. Is it possible to plot the lines at exactly the specify time regardless of close/open/high/low? Or if possible, indicator has the option to plot at close/open/high/low base on 5m candle, and all timeframes see the same plot price lines.

You can use the agg input to set a standard agg. However, whatever agg you choose, the chart timeframe the study is loaded on has to be less than or equal to the agg timeframe.

The input allows the option to choose whatever price you want to use from the dropdown list.

Here is an image with 3 charts at the same agg, different chart timeframes (ET in this example)
Screenshot-2022-12-21-162434.png
Ruby:
#Horizontal_Lines_at_SelectTimes_RTH_limit_option
input agg   = aggregationPeriod.FifTEEN_MIN;
input price = fundamentalType.HIGH;

input time1 = 1000;
input time2 = 1200;
input time3 = 1400;
input time4 = 1600;
input rthr_lines = yes;

def na      = Double.NaN;

script rth {
    input tilltime = 1000;
    def sec1 = SecondsFromTime(1600);
    def sec2 = SecondsFromTime(tilltime);
    def isTime1 = (sec1 >= 0 and sec1[1] < 0) or (sec1 < sec1[1] and sec1 >= 0);
    def isTime2 = (sec2 >= 0 and sec2[1] < 0) or (sec2 < sec2[1] and sec2 >= 0);
    def Range = CompoundValue(1, if isTime1 then 1 else if isTime2 then 0 else Range[1], 0);
    plot xa = Range;
}

def ln1     = if SecondsFromTime(time1) == 0 then Fundamental(price, period = agg) else ln1[1];
def ln2     = if SecondsFromTime(time2) == 0 then Fundamental(price, period = agg) else ln2[1];
def ln3     = if SecondsFromTime(time3) == 0 then Fundamental(price, period = agg) else ln3[1];
def ln4     = if SecondsFromTime(time4) == 0 then Fundamental(price, period = agg) else ln4[1];

plot line1  = if rthr_lines and rth(time1) then na else ln1;
plot line2  = if rthr_lines and rth(time2) then na else ln2;
plot line3  = if rthr_lines and rth(time3) then na else ln3;
plot line4  = ln4[1];

line1.SetPaintingStrategy(PaintingStrategy.DASHES);
line2.SetPaintingStrategy(PaintingStrategy.DASHES);
line3.SetPaintingStrategy(PaintingStrategy.DASHES);
line4.SetPaintingStrategy(PaintingStrategy.DASHES);
 
Last edited:
This will plot from the lookback day's close to the right edge of the chart or optionally only show for the current day if selected.


Hello @SleepyZ , @samer800
can you guys help me writing a thinkscript that can plot the open price at 1:30 pm and at mid night , I have been noting how price reacts on those hours and seems helpfull, if possible the plots to remain there (Like having an option show all) and the polts have to plot starting from -to specific time like plot 1. from 12:00am to may be 11:30 pm and plot 2. 1:30Pm to nextday 1:30 or may be 1:25 pm,, am looking to see the plots from yesterday or the day before yesterday, here is an example of the 1:30 pm that I draw manually as a reference of what am looking for

I tried to modify the time for existing midnight code I found and I kinda of messed it up and spend too much time trying to figure that out and no way to succeed

Appreciate your time and effort
 

Attachments

  • Screenshot 2024-10-11 at 2.48.02 PM.png
    Screenshot 2024-10-11 at 2.48.02 PM.png
    158.6 KB · Views: 65
This will give you an option to only show the lines during regular trading hours. Since thinkscript only uses ET, the times you requested are converted to ET. When displayed on a chart setting of CT, they will appear as you requested.


@SleepyZ

I tried to use this code by updating the time with my needs but I could not figure out the extension for the 1:30 , I am looking the 1:30 candle to get extended to the next, if u could help me on that.

again Thank you so much
 
Last edited:

Join useThinkScript to post your question to a community of 21,000+ developers and traders.

Similar threads

Not the exact question you're looking for?

Start a new thread and receive assistance from our community.

87k+ Posts
280 Online
Create Post

Similar threads

Similar threads

The Market Trading Game Changer

Join 2,500+ subscribers inside the useThinkScript VIP Membership Club
  • Exclusive indicators
  • Proven strategies & setups
  • Private Discord community
  • ‘Buy The Dip’ signal alerts
  • Exclusive members-only content
  • Add-ons and resources
  • 1 full year of unlimited support

Frequently Asked Questions

What is useThinkScript?

useThinkScript is the #1 community of stock market investors using indicators and other tools to power their trading strategies. Traders of all skill levels use our forums to learn about scripting and indicators, help each other, and discover new ways to gain an edge in the markets.

How do I get started?

We get it. Our forum can be intimidating, if not overwhelming. With thousands of topics, tens of thousands of posts, our community has created an incredibly deep knowledge base for stock traders. No one can ever exhaust every resource provided on our site.

If you are new, or just looking for guidance, here are some helpful links to get you started.

What are the benefits of VIP Membership?
VIP members get exclusive access to these proven and tested premium indicators: Buy the Dip, Advanced Market Moves 2.0, Take Profit, and Volatility Trading Range. In addition, VIP members get access to over 50 VIP-only custom indicators, add-ons, and strategies, private VIP-only forums, private Discord channel to discuss trades and strategies in real-time, customer support, trade alerts, and much more. Learn all about VIP membership here.
How can I access the premium indicators?
To access the premium indicators, which are plug and play ready, sign up for VIP membership here.
Back
Top