(thinkScript, Thinkorswim)
Please advise how to correctly finish the script,
which is almost ready.
In the code below,
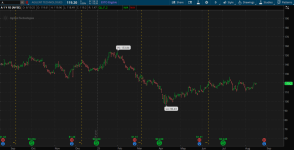
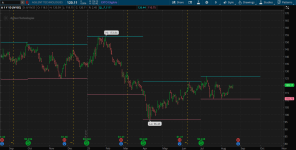
it is necessary to draw horizontal lines (Highest and Lowest of the current quarter)
from mark to mark of drawing of the consecutive
quarter - from yellow to yellow vertical line,
based on my parameters;
in the code,
horizontal lines on the graph, drawing marks - "Kvartal_Bn"?
code:
Thank you in advance for your support in this decision.
Please advise how to correctly finish the script,
which is almost ready.
In the code below,
it is necessary to draw horizontal lines (Highest and Lowest of the current quarter)
from mark to mark of drawing of the consecutive
quarter - from yellow to yellow vertical line,
based on my parameters;
in the code,
horizontal lines on the graph, drawing marks - "Kvartal_Bn"?
code:
Code:
def na  =  Double.NaN;
def bn  =  BarNumber ();

def is_real_Bar = !IsNaN(close) and IsNaN(close[-1]);               #  lastBar
def    real_Bar = if IsNaN(close[-1]) then  bn  else real_Bar [1];  #  lastBar


def  current_Date  =  GetYYYYMMDD ();       #  current  date
def  current_D     =  GetDay ();            #  number  current  day

def current_W  =  GetWeek();    #  number  current  week    in year
def current_M  =  GetMonth();   #  number  current  Month   in year
def current_Y  =  GetYear();    #          current  Year

def current_D_W  = GetDayOfWeek ( current_Date );    #  number  day  of week   ( 1 = Mon  ..  7 = Sun )
def current_D_M  = GetDayOfMonth( current_Date );    #  number  day  of month  ( 1  ..  31 )


def DayWeek = GetDayOfWeek( current_Date );


def secondFridayOffset =         #     ( 1 = Mon  ..  7 = Sun )
    if DayWeek <= 5 then 5 - DayWeek + 7
    else
       if  DayWeek == 6  then
          14      # Sat.
       else
          13  ;   # Sun.


def is_Friday  =  GetDayOfWeek( current_Date ) == 5;


def Kvartal_Date =
 ( current_M == 3  or  current_M == 6  or  current_M == 9  or  current_M == 12 )
     and
 ( current_D_M  ==  secondFridayOffset )
;


def Kvartal_Bn  =    if  Kvartal_Date  then  bn  else Kvartal_Bn[1];


#   x lines :

#    Quartal  High
???

#    Quartal  Low
???


#  vertical Lines befor new Quartal
AddVerticalLine( (real_Bar < 1)  &&  Kvartal_Date , " " + Kvartal_Date , Color.ORANGE, Curve.SHORT_DASH);  #  , curve.MEDIUM_DASH);

#   end
Thank you in advance for your support in this decision.