
I was working on a request from a friend for highlighting a bar a given number of bars back, and then tracking the subsequent highest high and lowest low from that bar.
This ties into some other work I can share later where you can see where the most recent bars are relative to a lookback period like you might use in a SMA or Stochastic, etc.
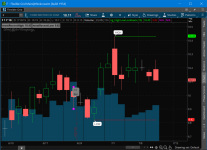
Here is what the study looks like on a Ford (F) 1Y 1D chart.

Some things to notice:
Code for HighLowLookback
Shareable Link to flexgrid and code
https://tos.mx/lNzBi8
This ties into some other work I can share later where you can see where the most recent bars are relative to a lookback period like you might use in a SMA or Stochastic, etc.
Here is what the study looks like on a Ford (F) 1Y 1D chart.
Some things to notice:
- labels
- chart bubble at (high+low)/2 on the lookback bar
- purple squares at high and low on the lookback bar
- purple squares have Bubbles hidden (on the right vertical axis)
- LOW chart bubble
- LOW line
- HIGH chart bubble
- HIGH line
Code for HighLowLookback
Code:
#
# HighLowLookback
#
# Study to show the highest high and lowest low after a given number of bars back.
#
# Author: Kory Gill, @korygill
#
# VERSION HISTORY (sortable date and time (your local time is fine), and your initials
# 20190710-2200-KG    - created
# ...
# ...
#

#
# Inputs
#
input length = 13;

#
# Common Variables that may also reduce calls to server
#
def vClose = close;
def vLow = low;
def vHigh = high;
def nan = double.NaN;

#
# Logic
#
def currentBarNumber = if !IsNaN(vClose) then BarNumber() else nan;
def lastBarNumber = HighestAll(currentBarNumber);
def lookbackBar = lastBarNumber - length + 1;
def doPlot = if currentBarNumber >= lookbackBar then 1 else 0;

def mostRecentHigh = CompoundValue(1, if doPlot && vHigh > mostRecentHigh[1] then vHigh else mostRecentHigh[1],double.NEGATIVE_INFINITY);
def highBarNumber  = CompoundValue(1, if doPlot && vHIgh > mostRecentHigh[1] then currentBarNumber else highBarNumber[1],0);
plot mrh = if currentBarNumber >= HighestAll(highBarNumber) then mostRecentHigh else nan;
mrh.SetDefaultColor(Color.GREEN);

def mostRecentLow = CompoundValue(1, if doPlot && vLow < mostRecentLow[1] then vLow else mostRecentLow[1],double.POSITIVE_INFINITY);
def lowBarNumber  = CompoundValue(1, if doPlot && vLow < mostRecentLow[1] then currentBarNumber else lowBarNumber[1],0);
plot mrl = if currentBarNumber >= HighestAll(lowBarNumber) then mostRecentLow else nan;
mrl.SetDefaultColor(Color.RED);

#
# Visualizations
#
AddChartBubble(
    currentBarNumber == HighestAll(highBarNumber),
    vHigh,
    "HIGH",
    Color.WHITE,
    yes);

AddChartBubble(
    currentBarNumber == HighestAll(lowBarNumber),
    vLow,
    "LOW",
    Color.WHITE,
    no);

AddChartBubble(
    currentBarNumber == lookbackBar,
    (vHigh+vLow)/2,
    length+"\nBar",
    Color.GRAY,
    yes);

plot bbH = if currentBarNumber == lookbackBar then vHigh + TickSize()*1 else nan;
bbH.SetPaintingStrategy(PaintingStrategy.SQUARES);
bbH.SetDefaultColor(Color.MAGENTA);
bbH.SetLineWeight(5);
bbH.HideBubble();

plot bbL = if currentBarNumber == lookbackBar then vLow - TickSize()*1 else nan;
bbL.SetPaintingStrategy(PaintingStrategy.SQUARES);
bbL.SetDefaultColor(Color.MAGENTA);
bbL.SetLineWeight(5);
bbL.HideBubble();

#
# Labels
#
AddLabel(yes,
"mostRecentHigh: " + mostRecentHigh,
Color.Gray);

AddLabel(yes,
"mostRecentLow: " + mostRecentLow,
Color.Gray);
Shareable Link to flexgrid and code
https://tos.mx/lNzBi8
Attachments
Last edited by a moderator:
") Thanks for the foundation
Thanks for the foundation 