Help with creating horizontal line above last (previous) bar only

JL082

New member
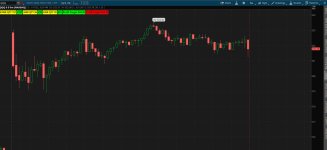
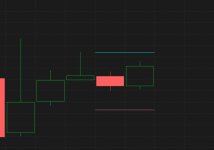
In the code below I've got a Profit Target label for 2x of previous bar to the upside and downside (on the chart its the far right green and red labels) these are based on the doji bar at 3:55 pm.

When I tried adding a painting strategy it kept flattening all bars and would put a line above each bar. Would someone be able to help me just project the horizontal line
for profit target above the current bar?

The whole cold in general calculates risk off previous bar, quantity of shares based on a dollar amount & profit target of minimum 2x risk.

##Calculate the percentage change of previous bar bar
def percentChange = (high[1] - low[1]) / high[1] * 100;
def valueChange = (high[1] - low[1]) * 2;
def negValueChange = (high[1] - low[1]) * 2;
def profitTarget = (valueChange + high[1] - low[1]);
def profitTarget1 = (high[1] + valueChange);
def bearProfitTarget = negValueChange - high[1] - low[1];
def profitTarget2 = (low[1] - negValueChange);
def sharesTraded = Round( 100000 / close[1], 0);
def sharesTraded1 = RoundUp( 50000 / close[1], 0);
def sharesTraded2 = RoundUp( 20000 / close[1], 0);


##Add a label displaying the percentage value on the current bar
AddLabel(yes, "$100K QTY " + sharesTraded, Color.YELLOW);
AddLabel(yes, "$" + Round(percentChange * 1000, 0), Color.GREEN);
AddLabel(yes, "$50K QTY " + sharesTraded1, Color.YELLOW);
AddLabel(yes, "$" + Round(percentChange * 500, 0), Color.GREEN);
AddLabel(yes, "$20K QTY " + sharesTraded2, Color.YELLOW);
AddLabel(yes, "$" + Round(percentChange * 200, 0), Color.GREEN);
AddLabel(yes, "Profit Target " + profitTarget1, Color.GREEN);
AddLabel(yes, "Profit Target " + profitTarget2, Color.RED);

Thank you
 

Attachments

  • photo_2025-01-18_19-11-41.jpg
    photo_2025-01-18_19-11-41.jpg
    78.6 KB · Views: 25
Solution
here is another version
it draws 2 lines, from the 2nd to last bar, to the last bar

the current price, is the close on the last bar,
you are calculating 2 target levels from the 2nd to last bar.
this may have been easier for you to follow if you didn't use offsets in your formulas, but instead calculate values that pertained to the active bar. then for plotting, use offsets as needed to read the desired variable value.

i changed the constant , 2, to be a variable ( factor applied to the difference). set this to 0 to verify it is reading the high and low from the desired bar.

Code:
#target_lines_prevbar
#https://usethinkscript.com/threads/help-with-creating-horizontal-line-above-last-previous-bar-only.20381/
#Help with creating...
something like this may work. I'm just composing code here at uToS, so it may not actually work...
Code:
plot target1 = if isNaN(Close) and !isNaN(CLOSE[1]) then profitTarget1 else double.nan;
plot target2 = if isNaN(Close) and !isNaN(CLOSE[1]) then profitTarget2 else double.nan;
target1.SetPaintingStrategy(PaintingStrategy.HORIZONTAL);
target2.SetPaintingStrategy(PaintingStrategy.HORIZONTAL);
basically, it looks to see if the bar being evaluated has a value for CLOSE -- the current bar never does at least while markets are open. Then, if the last bar has a close and this bar has none we know that the bar being evaluated is the final bar on the chart and we plot the value.
Setting the painting strategy to horizontal is a nice way to get single bar stuff to actually show up. points also work, but generic plots need two points to draw a line between.

If it works, yeah, if not, come on back and we'll try again.

-mashume
 
here is another version
it draws 2 lines, from the 2nd to last bar, to the last bar

the current price, is the close on the last bar,
you are calculating 2 target levels from the 2nd to last bar.
this may have been easier for you to follow if you didn't use offsets in your formulas, but instead calculate values that pertained to the active bar. then for plotting, use offsets as needed to read the desired variable value.

i changed the constant , 2, to be a variable ( factor applied to the difference). set this to 0 to verify it is reading the high and low from the desired bar.

Code:
#target_lines_prevbar
#https://usethinkscript.com/threads/help-with-creating-horizontal-line-above-last-previous-bar-only.20381/
#Help with creating horizontal line above last (previous) bar only

input factor = 2.0;
##Calculate the percentage change of previous bar bar
def percentChange = (high[1] - low[1]) / high[1] * 100;
def valueChange = (high[1] - low[1]) * factor;
def negValueChange = (high[1] - low[1]) * factor;
def profitTarget = (valueChange + high[1] - low[1]);
def profitTarget1 = (high[1] + valueChange);
def bearProfitTarget = negValueChange - high[1] - low[1];
def profitTarget2 = (low[1] - negValueChange);
def sharesTraded = Round( 100000 / close[1], 0);
def sharesTraded1 = RoundUp( 50000 / close[1], 0);
def sharesTraded2 = RoundUp( 20000 / close[1], 0);

##Add a label displaying the percentage value on the current bar
AddLabel(yes, "$100K QTY " + sharesTraded, Color.YELLOW);
AddLabel(yes, "$" + Round(percentChange * 1000, 0), Color.GREEN);
AddLabel(yes, "$50K QTY " + sharesTraded1, Color.YELLOW);
AddLabel(yes, "$" + Round(percentChange * 500, 0), Color.GREEN);
AddLabel(yes, "$20K QTY " + sharesTraded2, Color.YELLOW);
AddLabel(yes, "$" + Round(percentChange * 200, 0), Color.GREEN);
AddLabel(yes, "Profit Target " + profitTarget1, Color.GREEN);
AddLabel(yes, "Profit Target " + profitTarget2, Color.RED);

#------------------------

def na = double.nan;
def bn = barnumber();
def lastbar = (!isNaN(Close[0]) and isNaN(close[-1]));
def secondlastbar = (!isNaN(Close[-1]) and isNaN(close[-2]));

def hi = if secondlastbar then profitTarget1[-1]
 else if lastbar then hi[1]
 else na;

def lo = if secondlastbar then profitTarget2[-1]
 else if lastbar then lo[1]
 else na;

plot target1 = hi;
plot target2 = lo;
target1.SetPaintingStrategy(PaintingStrategy.HORIZONTAL);
target2.SetPaintingStrategy(PaintingStrategy.HORIZONTAL);
#
 

Attachments

  • img1.JPG
    img1.JPG
    35.9 KB · Views: 11
Solution

Join useThinkScript to post your question to a community of 21,000+ developers and traders.

Similar threads

Not the exact question you're looking for?

Start a new thread and receive assistance from our community.

87k+ Posts
205 Online
Create Post

Similar threads

Similar threads

The Market Trading Game Changer

Join 2,500+ subscribers inside the useThinkScript VIP Membership Club
  • Exclusive indicators
  • Proven strategies & setups
  • Private Discord community
  • ‘Buy The Dip’ signal alerts
  • Exclusive members-only content
  • Add-ons and resources
  • 1 full year of unlimited support

Frequently Asked Questions

What is useThinkScript?

useThinkScript is the #1 community of stock market investors using indicators and other tools to power their trading strategies. Traders of all skill levels use our forums to learn about scripting and indicators, help each other, and discover new ways to gain an edge in the markets.

How do I get started?

We get it. Our forum can be intimidating, if not overwhelming. With thousands of topics, tens of thousands of posts, our community has created an incredibly deep knowledge base for stock traders. No one can ever exhaust every resource provided on our site.

If you are new, or just looking for guidance, here are some helpful links to get you started.

What are the benefits of VIP Membership?
VIP members get exclusive access to these proven and tested premium indicators: Buy the Dip, Advanced Market Moves 2.0, Take Profit, and Volatility Trading Range. In addition, VIP members get access to over 50 VIP-only custom indicators, add-ons, and strategies, private VIP-only forums, private Discord channel to discuss trades and strategies in real-time, customer support, trade alerts, and much more. Learn all about VIP membership here.
How can I access the premium indicators?
To access the premium indicators, which are plug and play ready, sign up for VIP membership here.
Back
Top