I have found Pennant/Flag price patterns to be some of the most profitable in my experience trading, yet after scouring this forum, I've yet to find an script that does a great job of characterizing this pattern on charts.
After doing some research, I have the blueprint in my mind for a script that would be a very accurate detector of these patterns, but my Thinkscript coding skills are holding me back. I'm reaching out to the community with hopes that we can make this a thing.
Here are the foundations of the idea:
To start, the ZigZagHighLow indicator is used to identify pivot points in price along trendlines.
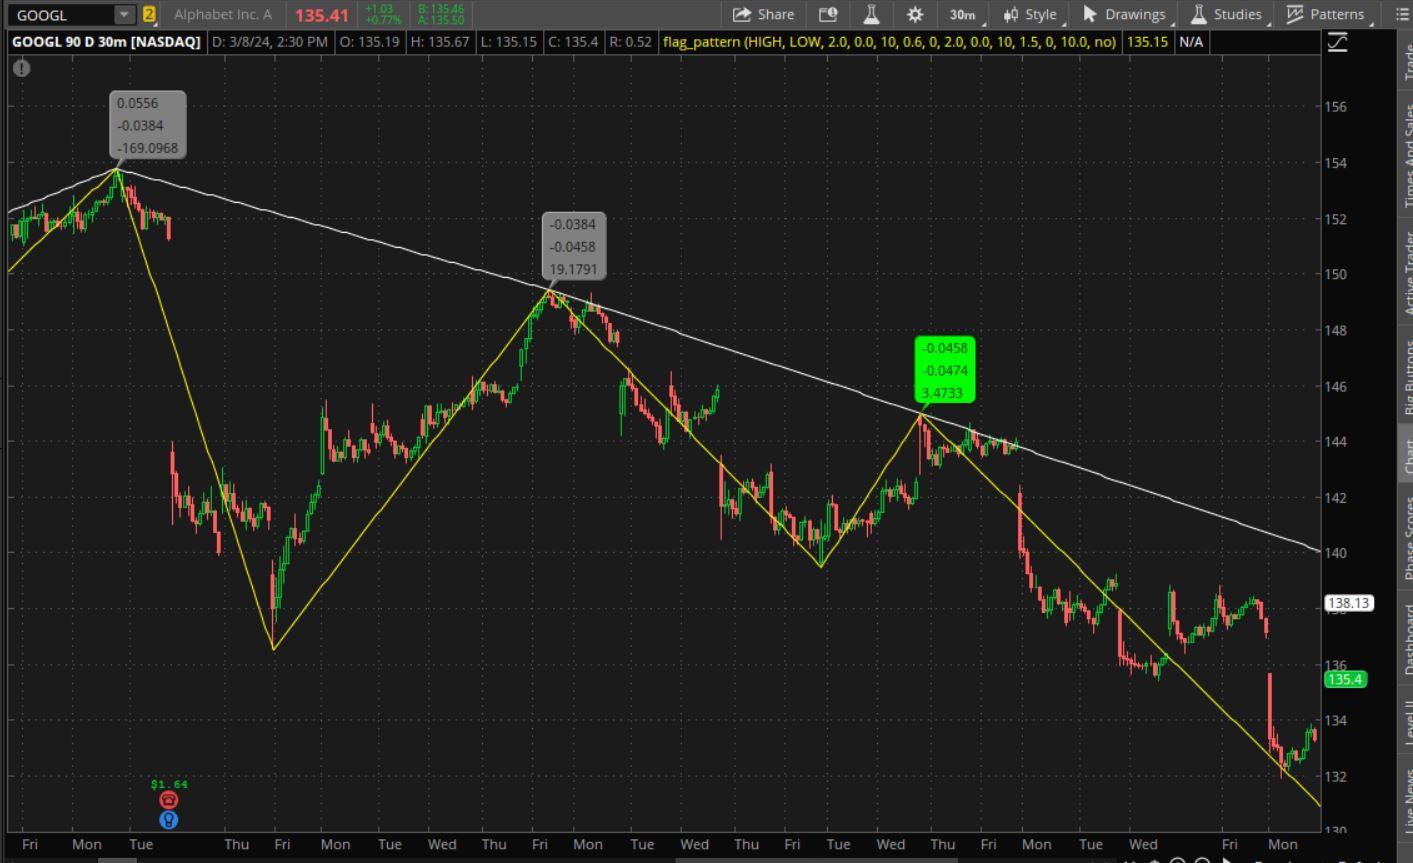
Here's a picture for reference(CRSP stock D chart):

As we can see, the combination of 2 ZigZag indicators at different lengths correctly identify many highs/lows that make up this pennant. This means that if we can find a way to connect the relevant points in this pattern and disregard the others, then we should have a beautiful pennant/trendline indicator.
My plan for doing this is fairly simple, but I'm not sure how to materialize it in code. To start, you would want to make all of the High ZigZag points and Low ZigZag points that occur be price variables. Then, you would need to document how many bars ago that these ZigZag points occurred.
Those two data points of Price and number of Bars since the pivot points are all that would be needed for the final calculation.
Once you have these variables, the last step would be finding a way to align the relevant high lows points that form a trend, my idea for this is to calculate the slope between these points and plot trend lines where 3 or more ZigZag points have a similar slope.
here's a oversimplified outline of what I mean in code for the bottom part of the pennant (I know you can't use [ ] like this but consider it to mean the price [number] zigzag lows ago)
(I know you can't use [ ] like this but consider it to mean the price [number] zigzag lows ago)
This logic obviously isn't functional at all, but it shows a conceptual idea of how this would work. If all three points coexist on the trendline, then the slope between the points should be very similar. All that's missing is sorting through the irrelevant data points and reverse engineering it for the upper trendline. I think I can do both of those thing myself if someone can help figure out how to reference the price of previous ZigZag's as a variable and monitor how many bars ago the high/low occurred.
Thanks to anyone who spent the time reading this, I hope the community can come together and make this work. Similar logic could also be used for finding accurate support/resistance or other chart patterns.
I'm also going to attach the double length ZigZag code:
After doing some research, I have the blueprint in my mind for a script that would be a very accurate detector of these patterns, but my Thinkscript coding skills are holding me back. I'm reaching out to the community with hopes that we can make this a thing.
Here are the foundations of the idea:
To start, the ZigZagHighLow indicator is used to identify pivot points in price along trendlines.
Here's a picture for reference(CRSP stock D chart):
As we can see, the combination of 2 ZigZag indicators at different lengths correctly identify many highs/lows that make up this pennant. This means that if we can find a way to connect the relevant points in this pattern and disregard the others, then we should have a beautiful pennant/trendline indicator.
My plan for doing this is fairly simple, but I'm not sure how to materialize it in code. To start, you would want to make all of the High ZigZag points and Low ZigZag points that occur be price variables. Then, you would need to document how many bars ago that these ZigZag points occurred.
Those two data points of Price and number of Bars since the pivot points are all that would be needed for the final calculation.
Once you have these variables, the last step would be finding a way to align the relevant high lows points that form a trend, my idea for this is to calculate the slope between these points and plot trend lines where 3 or more ZigZag points have a similar slope.
here's a oversimplified outline of what I mean in code for the bottom part of the pennant (I know you can't use [ ] like this but consider it to mean the price [number] zigzag lows ago)
Code:
def ZZLow = x
def ZZLow[1] = y
def ZZlow[2] = z

def BarsSinceZZlow = a
def BarsSinceZZlow[1] = b
def BarsSinceZZlow[2] = c

def ZZSlope1 = (y-z)/(b-c)
def ZZSlope2 = (x-y)/(a-b)

plot bottomtrendline = if ZZSlope1 ≈ ZZSlope2 then trendline else Double.NanThis logic obviously isn't functional at all, but it shows a conceptual idea of how this would work. If all three points coexist on the trendline, then the slope between the points should be very similar. All that's missing is sorting through the irrelevant data points and reverse engineering it for the upper trendline. I think I can do both of those thing myself if someone can help figure out how to reference the price of previous ZigZag's as a variable and monitor how many bars ago the high/low occurred.
Thanks to anyone who spent the time reading this, I hope the community can come together and make this work. Similar logic could also be used for finding accurate support/resistance or other chart patterns.
I'm also going to attach the double length ZigZag code:
Code:
#
# TD Ameritrade IP Company, Inc. (c) 2013-2024
#

input priceH = high;
input priceL = low;
input percentageReversala = 2.0;
input absoluteReversala = 0.0;
input atrLengtha = 10;
input atrReversala = .6;
input tickReversala = 0;

input percentageReversalb = 2.0;
input absoluteReversalb = 0.0;
input atrLengthb = 10;
input atrReversalb = 1.5;
input tickReversalb = 0;

script Zag {

    input priceH = high;
    input priceL = low;
    input percentageReversala = 5.0;
    input absoluteReversalb = 0.0;
    input atrLengthc = 5;
    input atrReversald = 1.5;
    input tickReversale = 0;

    Assert(percentageReversala >= 0, "'percentage reversal' must not be negative: " + percentageReversala);
    Assert(absoluteReversalb >= 0, "'absolute reversal' must not be negative: " + absoluteReversalb);
    Assert(atrReversald >= 0, "'atr reversal' must not be negative: " + atrReversald);
    Assert(tickReversale >= 0, "'ticks' must not be negative: " + tickReversale);
    Assert(percentageReversala != 0 or absoluteReversalb != 0 or atrReversald != 0 or tickReversale != 0, "Either 'percentage reversal' or 'absolute reversal' or 'atr reversal' or 'tick reversal' must not be zero");

    def absReversal;
    if (absoluteReversalb != 0) {
        absReversal = absoluteReversalb;
    } else {
        absReversal =  tickReversale * TickSize();
    }

    def hlPivot;
    if (atrReversald != 0) {
        hlPivot = percentageReversala / 100 + WildersAverage(TrueRange(high, close, low), atrLengthc) / close * atrReversald;
    } else {
        hlPivot = percentageReversala / 100;
    }
    def state = {default init, undefined, uptrend, downtrend};
    def maxPriceH;
    def minPriceL;
    def newMax;
    def newMin;
    def prevMaxH = GetValue(maxPriceH, 1);
    def prevMinL = GetValue(minPriceL, 1);

    if GetValue(state, 1) == GetValue(state.init, 0) {
        maxPriceH = priceH;
        minPriceL = priceL;
        newMax = yes;
        newMin = yes;
        state = state.undefined;
    } else if GetValue(state, 1) == GetValue(state.undefined, 0) {
        if priceH >= prevMaxH {
            state = state.uptrend;
            maxPriceH = priceH;
            minPriceL = prevMinL;
            newMax = yes;
            newMin = no;
        } else if priceL <= prevMinL {
            state = state.downtrend;
            maxPriceH = prevMaxH;
            minPriceL = priceL;
            newMax = no;
            newMin = yes;
        } else {
            state = state.undefined;
            maxPriceH = prevMaxH;
            minPriceL = prevMinL;
            newMax = no;
            newMin = no;
        }
    } else if GetValue(state, 1) == GetValue(state.uptrend, 0) {
        if priceL <= prevMaxH - prevMaxH * hlPivot - absReversal {
            state = state.downtrend;
            maxPriceH = prevMaxH;
            minPriceL = priceL;
            newMax = no;
            newMin = yes;
        } else {
            state = state.uptrend;
            if (priceH >= prevMaxH) {
                maxPriceH = priceH;
                newMax = yes;
            } else {
                maxPriceH = prevMaxH;
                newMax = no;
            }
            minPriceL = prevMinL;
            newMin = no;
        }
    } else {
        if priceH >= prevMinL + prevMinL * hlPivot + absReversal {
            state = state.uptrend;
            maxPriceH = priceH;
            minPriceL = prevMinL;
            newMax = yes;
            newMin = no;
        } else {
            state = state.downtrend;
            maxPriceH = prevMaxH;
            newMax = no;
            if (priceL <= prevMinL) {
                minPriceL = priceL;
                newMin = yes;
            } else {
                minPriceL = prevMinL;
                newMin = no;
            }
        }
    }

    def barNumber = BarNumber();
    def barCount = HighestAll(If(IsNaN(priceH), 0, barNumber));
    def newState = GetValue(state, 0) != GetValue(state, 1);
    def offset = barCount - barNumber + 1;
    def highPoint = state == state.uptrend and priceH == maxPriceH;
    def lowPoint = state == state.downtrend and priceL == minPriceL;

    def lastH;
    if highPoint and offset > 1 {
        lastH = fold iH = 1 to offset with tH = priceH while !IsNaN(tH) and !GetValue(newState, -iH) do if GetValue(newMax, -iH) or iH == offset - 1 and GetValue(priceH, -iH) == tH then Double.NaN else tH;
    } else {
        lastH = Double.NaN;
    }

    def lastL;
    if lowPoint and offset > 1 {
        lastL = fold iL = 1 to offset with tL = priceL while !IsNaN(tL) and !GetValue(newState, -iL) do if GetValue(newMin, -iL) or iL == offset - 1 and GetValue(priceL, -iL) == tL then Double.NaN else tL;
    } else {
        lastL = Double.NaN;
    }

    plot ZZ;
    if barNumber == 1 {
        ZZ = fold iF = 1 to offset with tP = Double.NaN while IsNaN(tP) do if GetValue(state, -iF) == GetValue(state.uptrend, 0) then priceL else if GetValue(state, -iF) == GetValue(state.downtrend, 0) then priceH else Double.NaN;
    } else if barNumber == barCount {
        ZZ = if highPoint or state == state.downtrend and priceL > minPriceL then priceH else if lowPoint or state == state.uptrend and priceH < maxPriceH then priceL else Double.NaN;
    } else {
        ZZ = if !IsNaN(lastH) then lastH else if !IsNaN(lastL) then lastL else Double.Nan;
    }
}


plot Zag = zag(priceH, priceL, percentageReversala, absoluteReversala, atrLengtha, atrReversala, tickReversala);
Zag.SetDefaultColor(GetColor(1));
Zag.EnableApproximation();

plot Zag2 = zag(priceH, priceL, percentageReversalb, absoluteReversalb, atrLengthb, atrReversalb, tickReversalb);
Zag2.SetDefaultColor(GetColor(1));
Zag2.EnableApproximation();
Last edited: