Let me start this post by saying I am completely new to using think or swim.
My Only experience trading was quite literally, trading on physical paper,
I calculated MACD, RSI, Stochastic, Average true range, Keltner bands ETC all on my own with a calculator and went Day by day, week by week.
I did this for many years, I was incarcerated at the time. I am now trying to earn a living as a trader using the skills I learned. But I am finding it difficult
to add the world of technology into it.
I am trying to implement the triple screen system as described in the book "The NEW Trading for a living" by Dr. Alexander Elder.
In essence, I am looking for a scanner that finds me an active uptrend that is still running. I have been unsuccessful at this myself.
Let me first show my ideal set up with screen shots. And then explain further.
On the first attachment.
The main focus point is that
ADX (10 length) has risen above 25
DMI + line is above DMI - Line showing bullish dominance
and MACD lines + histogram confirm this by being angled up
(MACD is standard set up of 12,26,9)

At this point I would be merely interested in a potential strong trend up.
THe next step would be to zoom in to the 10 minute chart ( second attachment)
Wait for the next major down cycle (usually for me I identify this with a bearish cross over of the MACD AND price is currently or just coming
out of oversold on one of two oscillators RSI or Slow Sotchastic, both set to 8 bar period length)
Then, as Histogram begins to rise AND MACD fast line starts to even out.
You can make an entry, so long as the pattern of the uptrend is holding AND price is in value ( defined by elder as at the moving averages).
The pattern holding accoding to my understanding is defined as the bottom the 10 minute is currently making at this point
is a higher bottom then the previous bottom.
If you are unfamiliar with Triple Screen / Elder then this step is basically making sure that
1. The Retrace against the trend direction is almost over
2. Price is at a valuable point being At or below average.

I have been unable to get a Scanner to find me this condition before its too late.
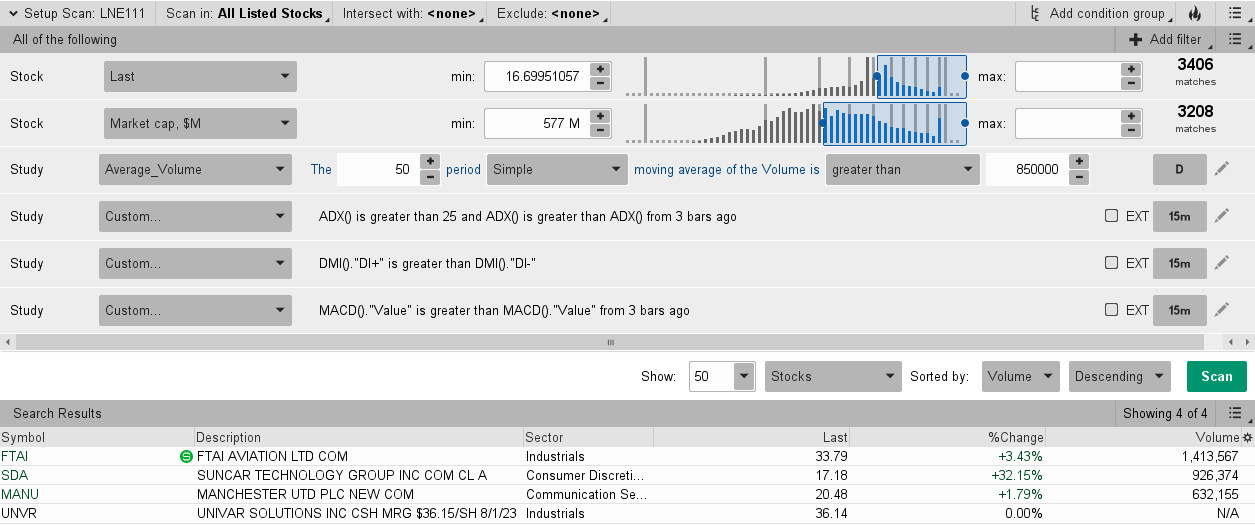
Is there a way to get a Scanner to pick up these conditions
1. ADX is over 25 AND ADX has been rising over the past few bars
2. DMI+ is Greater than DMI -
3. MACD is rising over the past few bars
I can get the Scan to partially work by setting it to look for hard facts like ADX is over 25
But I can't figure out how to get it to recognize that ADX has been rising over the past few bars.
I don't even know if thats a possibility.
So I am looking for someone to help me come up with a script
and preferably instruct me on how to implement that script ( or direct me to a youtube instructional) because
I am not a programmer.
I am also open to new scans that are not based on these metrics, that find me a similar set up.
And interested if anyone else used the Triple screen system successfully and how they find trades.
Thank you so much in advanced for any answers, tips or suggestions.
If you need any clarification of the charts or what I am looking for feel free to ask.
My Only experience trading was quite literally, trading on physical paper,
I calculated MACD, RSI, Stochastic, Average true range, Keltner bands ETC all on my own with a calculator and went Day by day, week by week.
I did this for many years, I was incarcerated at the time. I am now trying to earn a living as a trader using the skills I learned. But I am finding it difficult
to add the world of technology into it.
I am trying to implement the triple screen system as described in the book "The NEW Trading for a living" by Dr. Alexander Elder.
In essence, I am looking for a scanner that finds me an active uptrend that is still running. I have been unsuccessful at this myself.
Let me first show my ideal set up with screen shots. And then explain further.
On the first attachment.
The main focus point is that
ADX (10 length) has risen above 25
DMI + line is above DMI - Line showing bullish dominance
and MACD lines + histogram confirm this by being angled up
(MACD is standard set up of 12,26,9)
At this point I would be merely interested in a potential strong trend up.
THe next step would be to zoom in to the 10 minute chart ( second attachment)
Wait for the next major down cycle (usually for me I identify this with a bearish cross over of the MACD AND price is currently or just coming
out of oversold on one of two oscillators RSI or Slow Sotchastic, both set to 8 bar period length)
Then, as Histogram begins to rise AND MACD fast line starts to even out.
You can make an entry, so long as the pattern of the uptrend is holding AND price is in value ( defined by elder as at the moving averages).
The pattern holding accoding to my understanding is defined as the bottom the 10 minute is currently making at this point
is a higher bottom then the previous bottom.
If you are unfamiliar with Triple Screen / Elder then this step is basically making sure that
1. The Retrace against the trend direction is almost over
2. Price is at a valuable point being At or below average.
I have been unable to get a Scanner to find me this condition before its too late.
Is there a way to get a Scanner to pick up these conditions
1. ADX is over 25 AND ADX has been rising over the past few bars
2. DMI+ is Greater than DMI -
3. MACD is rising over the past few bars
I can get the Scan to partially work by setting it to look for hard facts like ADX is over 25
But I can't figure out how to get it to recognize that ADX has been rising over the past few bars.
I don't even know if thats a possibility.
So I am looking for someone to help me come up with a script
and preferably instruct me on how to implement that script ( or direct me to a youtube instructional) because
I am not a programmer.
I am also open to new scans that are not based on these metrics, that find me a similar set up.
And interested if anyone else used the Triple screen system successfully and how they find trades.
Thank you so much in advanced for any answers, tips or suggestions.
If you need any clarification of the charts or what I am looking for feel free to ask.