Help Needed with Upper and Lower zigzag band

british43

Member
VIP
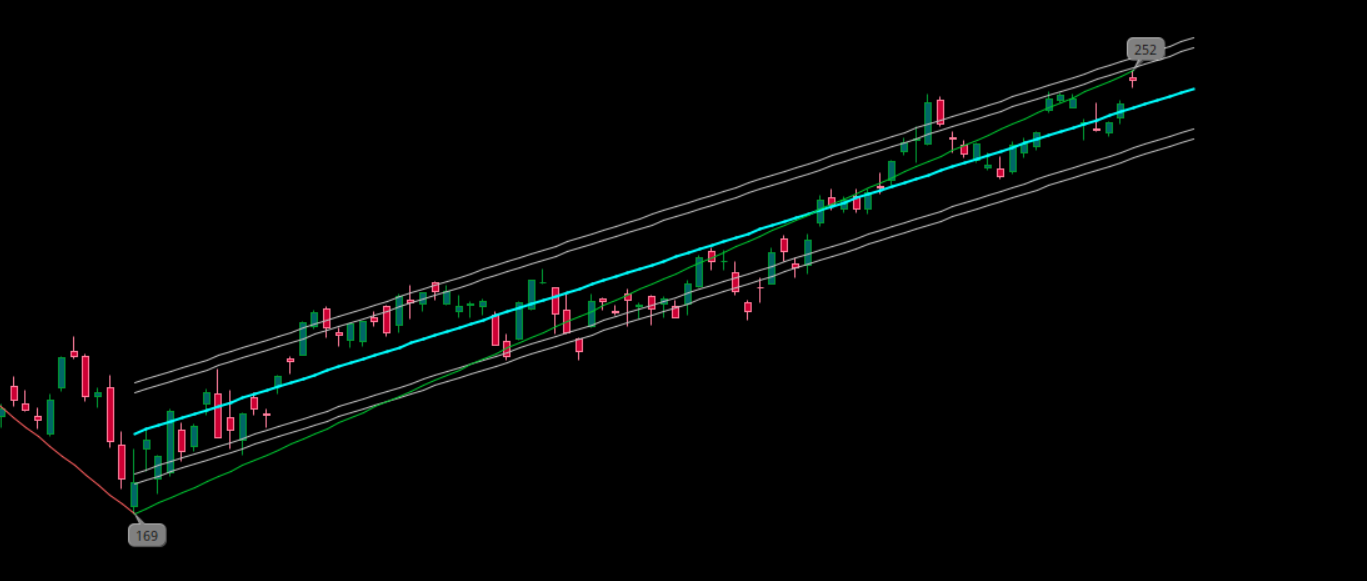
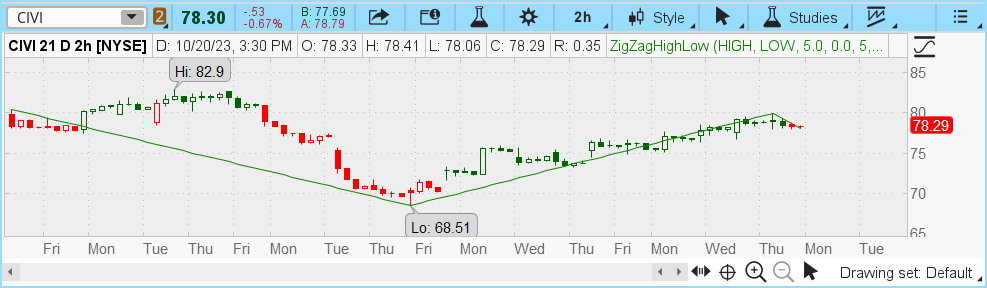
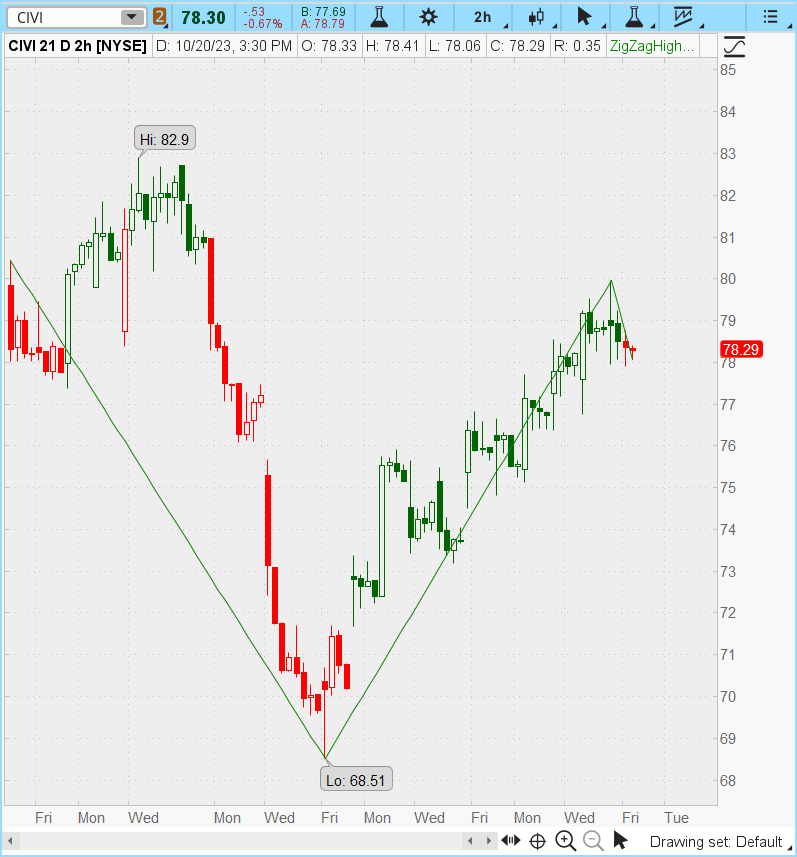
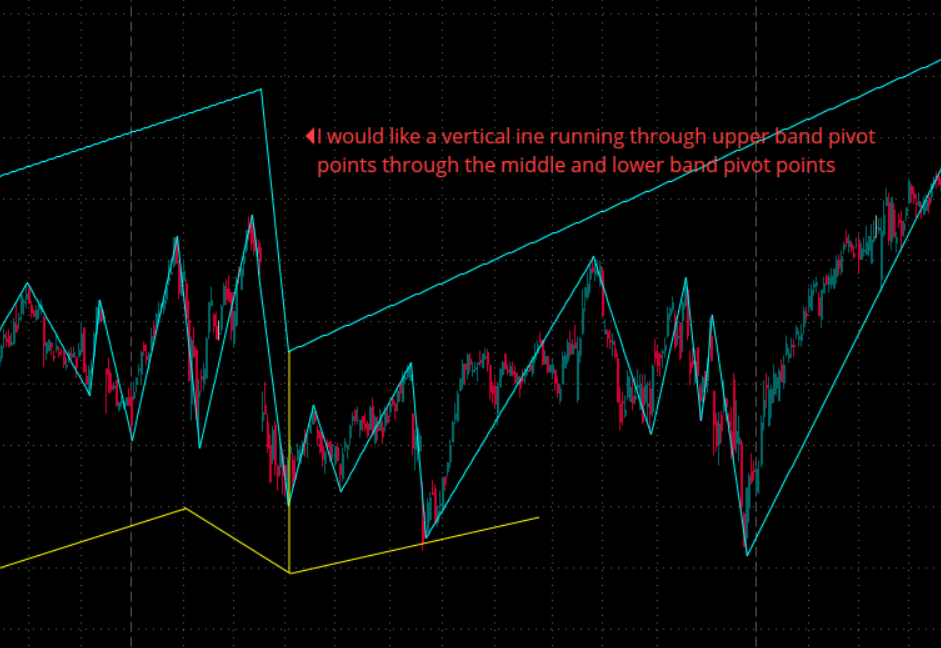
I'm trying to code an upper/lower band on the zigzag indicator based on user input but having some difficulty aligning the pivots. Any assistance would be appreciated.


3XXHqJx.png


Ruby:
def bn = BarNumber();
def na = Double.NaN;

def lastbn = HighestAll(If(IsNaN(close), 0, bn));
def lastbar = if (bn == lastbn) then 1 else 0;

def hibn = HighestAll(bn);
#def lastbar = !isnan(close[0]) and isnan(close[-1]);

def priceH = high;
def priceL = low;
def priceC = close;

def o = open;
def h = high;
def l = low;
def c = close;

input percentageReversal = 3;
input absoluteReversal = 0.0;
input atrLength = 2;
input atrReversal = 2;
input tickReversal = 0;

Assert(percentageReversal >= 0, "'percentage reversal' must not be negative: " + percentageReversal);
Assert(absoluteReversal >= 0, "'absolute reversal' must not be negative: " + absoluteReversal);
Assert(atrReversal >= 0, "'atr reversal' must not be negative: " + atrReversal);
Assert(tickReversal >= 0, "'ticks' must not be negative: " + tickReversal);
Assert(percentageReversal != 0 or absoluteReversal != 0 or atrReversal != 0 or tickReversal != 0, "Either 'percentage reversal' or 'absolute reversal' or 'atr reversal' or 'tick reversal' must not be zero");

def absReversal;
if (absoluteReversal != 0) {
    absReversal = absoluteReversal;
} else {
    absReversal =  tickReversal * TickSize();
}

def hlPivot;
if (atrReversal != 0) {
    hlPivot = percentageReversal / 100 + WildersAverage(TrueRange(high, close, low), atrLength) / close * atrReversal;
} else {
    hlPivot = percentageReversal / 100;
}


def state = {default init, undefined, uptrend, downtrend};
def maxPriceH;
def minPriceL;
def newMax;
def newMin;
def prevMaxH = GetValue(maxPriceH, 1);
def prevMinL = GetValue(minPriceL, 1);

if GetValue(state, 1) == GetValue(state.init, 0) {
    maxPriceH = priceH;
    minPriceL = priceL;
    newMax = yes;
    newMin = yes;
    state = state.undefined;
} else if GetValue(state, 1) == GetValue(state.undefined, 0) {
    if priceH >= prevMaxH {
        state = state.uptrend;
        maxPriceH = priceH;
        minPriceL = prevMinL;
        newMax = yes;
        newMin = no;
    } else if priceL <= prevMinL {
        state = state.downtrend;
        maxPriceH = prevMaxH;
        minPriceL = priceL;
        newMax = no;
        newMin = yes;
    } else {
        state = state.undefined;
        maxPriceH = prevMaxH;
        minPriceL = prevMinL;
        newMax = no;
        newMin = no;
    }
} else if GetValue(state, 1) == GetValue(state.uptrend, 0) {
    if priceL <= prevMaxH - prevMaxH * hlPivot - absReversal {
        state = state.downtrend;
        maxPriceH = prevMaxH;
        minPriceL = priceL;
        newMax = no;
        newMin = yes;
    } else {
        state = state.uptrend;
        if (priceH >= prevMaxH) {
            maxPriceH = priceH;
            newMax = yes;
        } else {
            maxPriceH = prevMaxH;
            newMax = no;
        }
        minPriceL = prevMinL;
        newMin = no;
    }
} else {
    if priceH >= prevMinL + prevMinL * hlPivot + absReversal {
        state = state.uptrend;
        maxPriceH = priceH;
        minPriceL = prevMinL;
        newMax = yes;
        newMin = no;
    } else {
        state = state.downtrend;
        maxPriceH = prevMaxH;
        newMax = no;
        if (priceL <= prevMinL) {
            minPriceL = priceL;
            newMin = yes;
        } else {
            minPriceL = prevMinL;
            newMin = no;
        }
    }
}


def barNumber = BarNumber();
def barCount = HighestAll(If(IsNaN(priceH), 0, barNumber));
def newState = GetValue(state, 0) != GetValue(state, 1);
def offset = barCount - barNumber + 1;
def highPoint = state == state.uptrend and priceH == maxPriceH;
def lowPoint = state == state.downtrend and priceL == minPriceL;

def lastH;
if highPoint and offset > 1 {
    lastH = fold iH = 1 to offset with tH = priceH while !IsNaN(tH) and !GetValue(newState, -iH) do if GetValue(newMax, -iH) or iH == offset - 1 and GetValue(priceH, -iH) == tH then Double.NaN else tH;
} else {
    lastH = Double.NaN;
}


def lastL;
if lowPoint and offset > 1 {
    lastL = fold iL = 1 to offset with tL = priceL while !IsNaN(tL) and !GetValue(newState, -iL) do if GetValue(newMin, -iL) or iL == offset - 1 and GetValue(priceL, -iL) == tL then Double.NaN else tL;
} else {
    lastL = Double.NaN;
}


plot ZZ;
if barNumber == 1 {
    ZZ = fold iF = 1 to offset with tP = Double.NaN while IsNaN(tP) do if GetValue(state, -iF) == GetValue(state.uptrend, 0) then priceL else if GetValue(state, -iF) == GetValue(state.downtrend, 0) then priceH else Double.NaN;
} else if barNumber == barCount {
    ZZ = if highPoint or state == state.downtrend and priceL > minPriceL then priceH else if lowPoint or state == state.uptrend and priceH < maxPriceH then priceL else Double.NaN;
} else {
    ZZ = if !IsNaN(lastH) then lastH else if !IsNaN(lastL) then lastL else Double.NaN;
}
ZZ.SetDefaultColor(GetColor(1));
ZZ.EnableApproximation();


input toggle = yes;
input reversalamount = 8.0;


def chg = close - GetValue(zz, 1);
def isUp = chg >= 0;
def isdn = chg <= 0;
def isConf = AbsValue(chg) >= reversalamount or (IsNaN(GetValue(ZZ, 1)) and GetValue(isConf, 1));


ZZ.DefineColor("Up Trend", Color.UPTICK);
ZZ.DefineColor("Down Trend", Color.DOWNTICK);
ZZ.DefineColor("Undefined", Color.DARK_ORANGE);
ZZ.AssignValueColor(if !isConf then ZZ.Color("Undefined") else if isUp then ZZ.Color("Up Trend") else ZZ.Color("Down Trend"));
DefineGlobalColor("Unconfirmed", Color.DARK_ORANGE);
DefineGlobalColor("Up", Color.UPTICK);
DefineGlobalColor("Down", Color.DOWNTICK);


#Upper Band
input WMA = 5;
def wma_wma_c  = close  + wma;
def wma_bn = BarNumber();
def wma_na = Double.NaN;

def wma_o = open + wma;
def wma_h = high+ wma;
def wma_l = low + wma ;
def wma_c = close + wma;

def wma_lastbn = HighestAll(If(IsNaN(wma_c ), 0, wma_bn));
def wma_lastbar = if (wma_bn == wma_lastbn) then 1 else 0;

def wma_hibn = HighestAll(wma_bn);
#def wma_lastbar = !isnan(wma_wma_c [0]) and isnan(wma_wma_c [-1]);

def wma_priceH = high + wma;
def wma_priceL = low  + wma;
def wma_priceC = close  + wma;


input wma_percentageReversal= 3;
input wma_absoluteReversal = 0.0;
input wma_atrLength  = 2;
input wma_atrReversal  = 2;
input wma_tickReversal  = 0;

Assert(wma_percentageReversal>= 0, "'percentage reversal' must not be negative: " + wma_percentageReversal);
Assert(wma_absoluteReversal >= 0, "'absolute reversal' must not be negative: " + wma_absoluteReversal);
Assert(wma_atrReversal  >= 0, "'atr reversal' must not be negative: " + wma_atrReversal );
Assert(wma_tickReversal  >= 0, "'ticks' must not be negative: " + wma_tickReversal );
Assert(wma_percentageReversal!= 0 or wma_absoluteReversal != 0 or wma_atrReversal  != 0 or wma_tickReversal  != 0, "Either 'percentage reversal' or 'absolute reversal' or 'atr reversal' or 'tick reversal' must not be zero");

def wma_absReversal ;
if (wma_absoluteReversal != 0) {
    wma_absReversal  = absoluteReversal;
} else {
    wma_absReversal  =  wma_tickReversal  * TickSize();
}

def wma_hlPivot  ;
if (wma_atrReversal  != 0) {
    wma_hlPivot   = wma_percentageReversal/ 100 + WildersAverage(TrueRange(wma_h , wma_c , wma_l ), wma_atrLength ) / wma_c  * wma_atrReversal ;
} else {
    wma_hlPivot   = wma_percentageReversal/ 100;
}


def wma_state = {default init, undefined, uptrend, downtrend};
def wma_maxPriceH;
def wma_minPriceL;
def wma_newMax;
def wma_newMin;
def wma_prevMaxH = GetValue(wma_maxPriceH, 1);
def wma_prevMinL  = GetValue(wma_minPriceL, 1);

if GetValue(wma_state, 1) == GetValue(wma_state.init, 0) {
    wma_maxPriceH = wma_priceH;
    wma_minPriceL = wma_priceL;
    wma_newMax = yes;
    wma_newMin = yes;
    wma_state = wma_state.undefined;
} else if GetValue(wma_state, 1) == GetValue(wma_state.undefined, 0) {
    if wma_priceH >= wma_prevMaxH {
        wma_state = wma_state.uptrend;
        wma_maxPriceH = wma_priceH;
        wma_minPriceL = wma_prevMinL ;
        wma_newMax = yes;
        wma_newMin = no;
    } else if wma_priceL <= wma_prevMinL  {
        wma_state = wma_state.downtrend;
        wma_maxPriceH = prevMaxH;
        wma_minPriceL = wma_priceL;
        wma_newMax = no;
        wma_newMin = yes;
    } else {
        wma_state = wma_state.undefined;
        wma_maxPriceH = prevMaxH;
        wma_minPriceL = wma_prevMinL ;
        wma_newMax = no;
        wma_newMin = no;
    }
} else if GetValue(wma_state, 1) == GetValue(wma_state.uptrend, 0) {
    if wma_priceL <= wma_prevMaxH - wma_prevMaxH * wma_hlPivot   - wma_absReversal  {
        wma_state = wma_state.downtrend;
        wma_maxPriceH = prevMaxH;
        wma_minPriceL = wma_priceL;
        wma_newMax = no;
        wma_newMin = yes;
    } else {
        wma_state = wma_state.uptrend;
        if (wma_priceH >= prevMaxH) {
            wma_maxPriceH = wma_priceH;
            wma_newMax = yes;
        } else {
            wma_maxPriceH = prevMaxH;
            wma_newMax = no;
        }
        wma_minPriceL = wma_prevMinL ;
        wma_newMin = no;
    }
} else {
    if wma_priceH >= wma_prevMinL  + wma_prevMinL  * wma_hlPivot   + wma_absReversal  {
        wma_state = wma_state.uptrend;
        wma_maxPriceH = wma_priceH;
        wma_minPriceL = wma_prevMinL ;
        wma_newMax = yes;
        wma_newMin = no;
    } else {
        wma_state = wma_state.downtrend;
        wma_maxPriceH = prevMaxH;
        wma_newMax = no;
        if (wma_priceL <= wma_prevMinL ) {
            wma_minPriceL = wma_priceL;
            wma_newMin = yes;
        } else {
            wma_minPriceL = wma_prevMinL ;
            wma_newMin = no;
        }
    }
}


def wma_barNumber  = BarNumber();
def wma_barCount  = HighestAll(If(IsNaN(wma_priceH), 0, wma_barNumber ));
def wma_newState  = GetValue(wma_state, 0) != GetValue(wma_state, 1);
def wma_offset  = wma_barCount  - wma_barNumber  + 1;
def wma_highPoint = wma_state == wma_state.uptrend and wma_priceH == wma_maxPriceH;
def wma_lowPoint = wma_state == wma_state.downtrend and wma_priceL == wma_minPriceL;

def wma_lastH ;
if wma_highPoint and wma_offset  > 1 {
    wma_lastH  = fold aH = 1 to wma_offset  with kH = wma_priceH while !IsNaN(kH) and !GetValue(wma_newState , -aH) do if GetValue(wma_newMax, -aH) or aH == wma_offset  - 1 and GetValue(wma_priceH, -aH) == kH then Double.NaN else kH;
} else {
    wma_lastH  = Double.NaN;
}


def wma_lastL ;
if wma_lowPoint and wma_offset  > 1 {
    wma_lastL  = fold xL = 1 to wma_offset  with gL = wma_priceL while !IsNaN(gL) and !GetValue(wma_newState , -xL) do if GetValue(wma_newMin, -xL) or xL == wma_offset  - 1 and GetValue(wma_priceL, -xL) == gL then Double.NaN else gL;
} else {
    wma_lastL  = Double.NaN;
}


plot wma_ZZ;
if barNumber == 1 {
    wma_ZZ = fold dF = 1 to wma_offset with fP = Double.NaN while IsNaN(fP) do if GetValue(state, -dF) == GetValue(wma_state.uptrend, 0) then wma_priceL else if GetValue(wma_state, -dF) == GetValue(wma_state.downtrend, 0) then wma_priceH else Double.NaN;
} else if barNumber == wma_barCount {
    wma_ZZ = if wma_highPoint or wma_state == wma_state.downtrend and wma_priceL > wma_minPriceL then wma_priceH else if wma_lowPoint or wma_state == wma_state.uptrend and wma_priceH < wma_maxPriceH then wma_priceL else Double.NaN;
} else {
    wma_ZZ = if !IsNaN(wma_lastH) then wma_lastH else if !IsNaN(wma_lastL) then wma_lastL else Double.NaN;
}
wma_ZZ.SetDefaultColor(GetColor(1));
wma_ZZ.EnableApproximation();
 
Last edited:

Join useThinkScript to post your question to a community of 21,000+ developers and traders.

@halcyonguy @MerryDay @SleepyZ This is great! Is there a way to change the center line to match the zigzag line and upper and lower linear regression lines on both side without using a moving average. Just the default parameter below. I saw that the anchored zigzag "LastHigh" and LastLow" is different than below. I would like to change the anchored zigzag with these parameters but don't know with specify parameters to change. This what it looks like. Let me know if I'm asking a stupid question!

6FWrzvR.png


Code:
def bn = BarNumber();
def na = Double.NaN;

def lastbn = HighestAll(If(IsNaN(close), 0, bn));
def lastbar = if (bn == lastbn) then 1 else 0;

def hibn = HighestAll(bn);
#def lastbar = !isnan(close[0]) and isnan(close[-1]);

def priceH = high;
def priceL = low;
def priceC = close;

def o = open;
def h = high;
def l = low;
def c = close;

input percentageReversal = 3;
input absoluteReversal = 0.0;
input atrLength = 2;
input atrReversal = 2;
input tickReversal = 0;

Assert(percentageReversal >= 0, "'percentage reversal' must not be negative: " + percentageReversal);
Assert(absoluteReversal >= 0, "'absolute reversal' must not be negative: " + absoluteReversal);
Assert(atrReversal >= 0, "'atr reversal' must not be negative: " + atrReversal);
Assert(tickReversal >= 0, "'ticks' must not be negative: " + tickReversal);
Assert(percentageReversal != 0 or absoluteReversal != 0 or atrReversal != 0 or tickReversal != 0, "Either 'percentage reversal' or 'absolute reversal' or 'atr reversal' or 'tick reversal' must not be zero");

def absReversal;
if (absoluteReversal != 0) {
    absReversal = absoluteReversal;
} else {
    absReversal =  tickReversal * TickSize();
}

def hlPivot;
if (atrReversal != 0) {
    hlPivot = percentageReversal / 100 + WildersAverage(TrueRange(high, close, low), atrLength) / close * atrReversal;
} else {
    hlPivot = percentageReversal / 100;
}


def state = {default init, undefined, uptrend, downtrend};
def maxPriceH;
def minPriceL;
def newMax;
def newMin;
def prevMaxH = GetValue(maxPriceH, 1);
def prevMinL = GetValue(minPriceL, 1);

if GetValue(state, 1) == GetValue(state.init, 0) {
    maxPriceH = priceH;
    minPriceL = priceL;
    newMax = yes;
    newMin = yes;
    state = state.undefined;
} else if GetValue(state, 1) == GetValue(state.undefined, 0) {
    if priceH >= prevMaxH {
        state = state.uptrend;
        maxPriceH = priceH;
        minPriceL = prevMinL;
        newMax = yes;
        newMin = no;
    } else if priceL <= prevMinL {
        state = state.downtrend;
        maxPriceH = prevMaxH;
        minPriceL = priceL;
        newMax = no;
        newMin = yes;
    } else {
        state = state.undefined;
        maxPriceH = prevMaxH;
        minPriceL = prevMinL;
        newMax = no;
        newMin = no;
    }
} else if GetValue(state, 1) == GetValue(state.uptrend, 0) {
    if priceL <= prevMaxH - prevMaxH * hlPivot - absReversal {
        state = state.downtrend;
        maxPriceH = prevMaxH;
        minPriceL = priceL;
        newMax = no;
        newMin = yes;
    } else {
        state = state.uptrend;
        if (priceH >= prevMaxH) {
            maxPriceH = priceH;
            newMax = yes;
        } else {
            maxPriceH = prevMaxH;
            newMax = no;
        }
        minPriceL = prevMinL;
        newMin = no;
    }
} else {
    if priceH >= prevMinL + prevMinL * hlPivot + absReversal {
        state = state.uptrend;
        maxPriceH = priceH;
        minPriceL = prevMinL;
        newMax = yes;
        newMin = no;
    } else {
        state = state.downtrend;
        maxPriceH = prevMaxH;
        newMax = no;
        if (priceL <= prevMinL) {
            minPriceL = priceL;
            newMin = yes;
        } else {
            minPriceL = prevMinL;
            newMin = no;
        }
    }
}


def barNumber = BarNumber();
def barCount = HighestAll(If(IsNaN(priceH), 0, barNumber));
def newState = GetValue(state, 0) != GetValue(state, 1);
def offset = barCount - barNumber + 1;
def highPoint = state == state.uptrend and priceH == maxPriceH;
def lowPoint = state == state.downtrend and priceL == minPriceL;

def lastH;
if highPoint and offset > 1 {
    lastH = fold iH = 1 to offset with tH = priceH while !IsNaN(tH) and !GetValue(newState, -iH) do if GetValue(newMax, -iH) or iH == offset - 1 and GetValue(priceH, -iH) == tH then Double.NaN else tH;
} else {
    lastH = Double.NaN;
}


def lastL;
if lowPoint and offset > 1 {
    lastL = fold iL = 1 to offset with tL = priceL while !IsNaN(tL) and !GetValue(newState, -iL) do if GetValue(newMin, -iL) or iL == offset - 1 and GetValue(priceL, -iL) == tL then Double.NaN else tL;
} else {
    lastL = Double.NaN;
}


plot ZZ;
if barNumber == 1 {
    ZZ = fold iF = 1 to offset with tP = Double.NaN while IsNaN(tP) do if GetValue(state, -iF) == GetValue(state.uptrend, 0) then priceL else if GetValue(state, -iF) == GetValue(state.downtrend, 0) then priceH else Double.NaN;
} else if barNumber == barCount {
    ZZ = if highPoint or state == state.downtrend and priceL > minPriceL then priceH else if lowPoint or state == state.uptrend and priceH < maxPriceH then priceL else Double.NaN;
} else {
    ZZ = if !IsNaN(lastH) then lastH else if !IsNaN(lastL) then lastL else Double.NaN;
}
ZZ.SetDefaultColor(GetColor(1));
ZZ.EnableApproximation();
 
Last edited:
@Chemmy I was trying to do the same thing as you did here:
https://usethinkscript.com/threads/how-to-connect-peaks-and-breaks-on-zigzag.14596/#post-120515

Below is what I came up with, but the upper and lower bands do not plot to the current ZZ. I couldn't figure out how to fix it.

Ruby:
def bn = BarNumber();
def na = Double.NaN;

def lastbn = HighestAll(If(IsNaN(close), 0, bn));
def lastbar = if (bn == lastbn) then 1 else 0;

def hibn = HighestAll(bn);
#def lastbar = !isnan(close[0]) and isnan(close[-1]);

def priceH = high;
def priceL = low;
def priceC = close;

def o = open;
def h = high;
def l = low;
def c = close;

input percentageReversal = 3;
input absoluteReversal = 0.0;
input atrLength = 2;
input atrReversal = 2;
input tickReversal = 0;

Assert(percentageReversal >= 0, "'percentage reversal' must not be negative: " + percentageReversal);
Assert(absoluteReversal >= 0, "'absolute reversal' must not be negative: " + absoluteReversal);
Assert(atrReversal >= 0, "'atr reversal' must not be negative: " + atrReversal);
Assert(tickReversal >= 0, "'ticks' must not be negative: " + tickReversal);
Assert(percentageReversal != 0 or absoluteReversal != 0 or atrReversal != 0 or tickReversal != 0, "Either 'percentage reversal' or 'absolute reversal' or 'atr reversal' or 'tick reversal' must not be zero");

def absReversal;
if (absoluteReversal != 0) {
    absReversal = absoluteReversal;
} else {
    absReversal =  tickReversal * TickSize();
}

def hlPivot;
if (atrReversal != 0) {
    hlPivot = percentageReversal / 100 + WildersAverage(TrueRange(high, close, low), atrLength) / close * atrReversal;
} else {
    hlPivot = percentageReversal / 100;
}

def state = {default init, undefined, uptrend, downtrend};
def maxPriceH;
def minPriceL;
def newMax;
def newMin;
def prevMaxH = GetValue(maxPriceH, 1);
def prevMinL = GetValue(minPriceL, 1);

if GetValue(state, 1) == GetValue(state.init, 0) {
    maxPriceH = priceH;
    minPriceL = priceL;
    newMax = yes;
    newMin = yes;
    state = state.undefined;
} else if GetValue(state, 1) == GetValue(state.undefined, 0) {
    if priceH >= prevMaxH {
        state = state.uptrend;
        maxPriceH = priceH;
        minPriceL = prevMinL;
        newMax = yes;
        newMin = no;
    } else if priceL <= prevMinL {
        state = state.downtrend;
        maxPriceH = prevMaxH;
        minPriceL = priceL;
        newMax = no;
        newMin = yes;
    } else {
        state = state.undefined;
        maxPriceH = prevMaxH;
        minPriceL = prevMinL;
        newMax = no;
        newMin = no;
    }
} else if GetValue(state, 1) == GetValue(state.uptrend, 0) {
    if priceL <= prevMaxH - prevMaxH * hlPivot - absReversal {
        state = state.downtrend;
        maxPriceH = prevMaxH;
        minPriceL = priceL;
        newMax = no;
        newMin = yes;
    } else {
        state = state.uptrend;
        if (priceH >= prevMaxH) {
            maxPriceH = priceH;
            newMax = yes;
        } else {
            maxPriceH = prevMaxH;
            newMax = no;
        }
        minPriceL = prevMinL;
        newMin = no;
    }
} else {
    if priceH >= prevMinL + prevMinL * hlPivot + absReversal {
        state = state.uptrend;
        maxPriceH = priceH;
        minPriceL = prevMinL;
        newMax = yes;
        newMin = no;
    } else {
        state = state.downtrend;
        maxPriceH = prevMaxH;
        newMax = no;
        if (priceL <= prevMinL) {
            minPriceL = priceL;
            newMin = yes;
        } else {
            minPriceL = prevMinL;
            newMin = no;
        }
    }
}

def barNumber = BarNumber();
def barCount = HighestAll(If(IsNaN(priceH), 0, barNumber));
def newState = GetValue(state, 0) != GetValue(state, 1);
def offset = barCount - barNumber + 1;
def highPoint = state == state.uptrend and priceH == maxPriceH;
def lowPoint = state == state.downtrend and priceL == minPriceL;

def lastH;
if highPoint and offset > 1 {
    lastH = fold iH = 1 to offset with tH = priceH while !IsNaN(tH) and !GetValue(newState, -iH) do if GetValue(newMax, -iH) or iH == offset - 1 and GetValue(priceH, -iH) == tH then Double.NaN else tH;
} else {
    lastH = Double.NaN;
}

def lastL;
if lowPoint and offset > 1 {
    lastL = fold iL = 1 to offset with tL = priceL while !IsNaN(tL) and !GetValue(newState, -iL) do if GetValue(newMin, -iL) or iL == offset - 1 and GetValue(priceL, -iL) == tL then Double.NaN else tL;
} else {
    lastL = Double.NaN;
}

plot UpperBand = if !IsNaN(lastH) then lastH else Double.NaN;
plot MiddleBand = if !IsNaN(lastL) then lastL else Double.NaN;
plot LowerBand = if !IsNaN(lastH) then lastH else if !IsNaN(lastL) then lastL else Double.NaN;

UpperBand.SetDefaultColor(GetColor(1));
MiddleBand.SetDefaultColor(GetColor(2));
LowerBand.SetDefaultColor(GetColor(3));

UpperBand.EnableApproximation();
MiddleBand.EnableApproximation();
LowerBand.EnableApproximation();
 
Last edited:
@SleepyZ I'm trying to add a cloud between upperband and lowerband using AddCloud(upperband, lowerband, color.white, color.white); but it is not showing the cloud. Is there a better way. Thanks!
 
Last edited:
@SleepyZ I'm trying to add a cloud between upperband and lowerband using AddCloud(upperband, lowerband, color.white, color.white); but it is not showing the cloud. Is there a better way. Thanks!

i just posted this, so replying,

those plots in your study use
UpperBand.EnableApproximation().
that means there are only some bars with valid numbers. the other bars are nan, so there aren't numbers to use.

you will have to create new formulas to generate the line data. something like this, which calcs a slope between peaks and valleys and creates valid price numbers for the lines.
https://usethinkscript.com/threads/need-help-eliminating-nan-values-in-indicator.15848/#post-128490
@halcyonguy These are the two plots. I'm happy that you mentioned this. If I want the cloud to change color if close > close[1] as a signal.

AddCloud(if close > close[1]
then Z1 else double.NaN,
Z2,
Color.green, Color.green);

I try using the script https://usethinkscript.com/threads/need-help-eliminating-nan-values-in-indicator.15848/#post-128490 but getting invalid statement for the if statement.

Invalid statement: if at 123:1
Invalid statement: } at 135:1
Invalid statement: } at 139:1
 
Last edited:
Ok. I've been using this code below to display the angle of each wave regardless of chart setup but seem to me that it is not accurate. If this makes sense.


Ruby:
#hidePricePlot();

def priceH = high;
def priceL = low;
def priceC = close;


def o = open;
def h = high;
def l = low;
def c = close;

input percentageReversal = 3;
input absoluteReversal = 0.0;
input atrLength = 2;
input atrReversal = 2;
input tickReversal = 0;

Assert(percentageReversal >= 0, "'percentage reversal' must not be negative: " + percentageReversal);
Assert(absoluteReversal >= 0, "'absolute reversal' must not be negative: " + absoluteReversal);
Assert(atrReversal >= 0, "'atr reversal' must not be negative: " + atrReversal);
Assert(tickReversal >= 0, "'ticks' must not be negative: " + tickReversal);
Assert(percentageReversal != 0 or absoluteReversal != 0 or atrReversal != 0 or tickReversal != 0, "Either 'percentage reversal' or 'absolute reversal' or 'atr reversal' or 'tick reversal' must not be zero");

def absReversal;
if (absoluteReversal != 0) {
    absReversal = absoluteReversal;
} else {
    absReversal =  tickReversal * TickSize();
}

def hlPivot;
if (atrReversal != 0) {
    hlPivot = percentageReversal / 100 + WildersAverage(TrueRange(high, close, low), atrLength) / close * atrReversal;
} else {
    hlPivot = percentageReversal / 100;
}


def state = {default init, undefined, uptrend, downtrend};
def maxPriceH;
def minPriceL;
def newMax;
def newMin;
def prevMaxH = GetValue(maxPriceH, 1);
def prevMinL = GetValue(minPriceL, 1);

if GetValue(state, 1) == GetValue(state.init, 0) {
    maxPriceH = priceH;
    minPriceL = priceL;
    newMax = yes;
    newMin = yes;
    state = state.undefined;
} else if GetValue(state, 1) == GetValue(state.undefined, 0) {
    if priceH >= prevMaxH {
        state = state.uptrend;
        maxPriceH = priceH;
        minPriceL = prevMinL;
        newMax = yes;
        newMin = no;
    } else if priceL <= prevMinL {
        state = state.downtrend;
        maxPriceH = prevMaxH;
        minPriceL = priceL;
        newMax = no;
        newMin = yes;
    } else {
        state = state.undefined;
        maxPriceH = prevMaxH;
        minPriceL = prevMinL;
        newMax = no;
        newMin = no;
    }
} else if GetValue(state, 1) == GetValue(state.uptrend, 0) {
    if priceL <= prevMaxH - prevMaxH * hlPivot - absReversal {
        state = state.downtrend;
        maxPriceH = prevMaxH;
        minPriceL = priceL;
        newMax = no;
        newMin = yes;
    } else {
        state = state.uptrend;
        if (priceH >= prevMaxH) {
            maxPriceH = priceH;
            newMax = yes;
        } else {
            maxPriceH = prevMaxH;
            newMax = no;
        }
        minPriceL = prevMinL;
        newMin = no;
    }
} else {
    if priceH >= prevMinL + prevMinL * hlPivot + absReversal {
        state = state.uptrend;
        maxPriceH = priceH;
        minPriceL = prevMinL;
        newMax = yes;
        newMin = no;
    } else {
        state = state.downtrend;
        maxPriceH = prevMaxH;
        newMax = no;
        if (priceL <= prevMinL) {
            minPriceL = priceL;
            newMin = yes;
        } else {
            minPriceL = prevMinL;
            newMin = no;
        }
    }
}


def barNumber = BarNumber();
def barCount = HighestAll(If(IsNaN(priceH), 0, barNumber));
def newState = GetValue(state, 0) != GetValue(state, 1);
def offset = barCount - barNumber + 1;
def highPoint = state == state.uptrend and priceH == maxPriceH;
def lowPoint = state == state.downtrend and priceL == minPriceL;

def lastH;
if highPoint and offset > 1 {
    lastH = fold iH = 1 to offset with tH = priceH while !IsNaN(tH) and !GetValue(newState, -iH) do if GetValue(newMax, -iH) or iH == offset - 1 and GetValue(priceH, -iH) == tH then Double.NaN else tH;
} else {
    lastH = Double.NaN;
}


def lastL;
if lowPoint and offset > 1 {
    lastL = fold iL = 1 to offset with tL = priceL while !IsNaN(tL) and !GetValue(newState, -iL) do if GetValue(newMin, -iL) or iL == offset - 1 and GetValue(priceL, -iL) == tL then Double.NaN else tL;
} else {
    lastL = Double.NaN;
}


plot ZZ;
if barNumber == 1 {
    ZZ = fold iF = 1 to offset with tP = Double.NaN while IsNaN(tP) do if GetValue(state, -iF) == GetValue(state.uptrend, 0) then priceL else if GetValue(state, -iF) == GetValue(state.downtrend, 0) then priceH else Double.NaN;
} else if barNumber == barCount {
    ZZ = if highPoint or state == state.downtrend and priceL > minPriceL then priceH else if lowPoint or state == state.uptrend and priceH < maxPriceH then priceL else Double.NaN;
} else {
    ZZ = if !IsNaN(lastH) then lastH else if !IsNaN(lastL) then lastL else Double.NaN;
}
ZZ.SetDefaultColor(GetColor(1));
ZZ.EnableApproximation();


input toggle = no;
input reversalamount = 8.0;

def ATRSave = if  !IsNaN(ZZ) then BarNumber() else GetValue(ATRSave, 1);
AddLabel (toggle, "ATRSave:" + " " + Round(ATRSave, 2));

def ATRSave1 = if ATRSave != ATRSave[1] then ATRSave[1] else GetValue(ATRSave1, 1);
AddLabel (toggle, "ATRSave1:" + " " + Round(ATRSave1, 2), Color.CYAN);

def ATRSave2 = if ATRSave != ATRSave then ATRSave else GetValue(ATRSave1, 1);
AddLabel (toggle, "ATRSave2:" + " " + Round(ATRSave2, 2), Color.YELLOW);

def ATRchg1 = Round(close - GetValue(ATRSave1, 1));
def ATRchg2 = Round(close - GetValue(ATRSave2, 1));
plot ATRisUp = ATRchg1 >= 0;
ATRisUp.Hide();
plot ATRisDown = ATRchg1 <= 0;
ATRisDown.Hide();
def isConf1 = AbsValue(ATRchg1) >= reversalamount or (IsNaN(GetValue(ZZ, 1)) and GetValue(isConf1, 1));

##########################################################################################


def start_bn = if !IsNaN(ZZ) then barnumber() else start_bn[1];
addlabel(1, start_bn);
def end_bn = if start_bn!=start_bn[1] then start_bn[1] else end_bn[1];
addlabel(1, end_bn);

 input y = close; # y axis variable to project forward
    def x1 = start_bn; # starting bar of slope calculation
    def x2 = end_bn; # ending bar of slop calculation
    def bar = BarNumber();
    def y1_r = if bar == x1 then y else y1_r[1];
                #addchartbubble(1, bLine, "y1_r\n" + y1_r, color.white, no);
    def y2_r = if bar == x2 then y else y2_r[1];
                #addchartbubble(1, bLine, "y2_r\n" + y2_r, color.white, no);
    def HA_y2 = highestall(y2_r);
                #addchartbubble(1, bLine, "HA_y2\n" + HA_y2, color.white, no);
    def GV_y2 = if bar >= x1 and bar <= x2 then getvalue(close, bar - x2) else double.nan;
                #addchartbubble(1, bLine, "GV_y2\n" + GV_y2, color.white, no);
    def x1_r = if bar == x1 then bar else x1_r[1];
                #addchartbubble(1, bLine, "x1_r\n" + x1_r, color.LIGHT_GRAY, no);
    def x2_r = if bar == x2 then bar else x2_r[1];
                #addchartbubble(1, bLine, "x2_r\n" + x2_r, color.LIGHT_GRAY, no);
    def HA_x2 = Highestall(x2_r);
                #addchartbubble(1, bLine, "HA_x2\n" + HA_x2, color.LIGHT_GRAY, no);
    def GV_x2 = if bar >= x1 and bar <= x2 then getvalue(bar, bar - x2) else double.nan;
                #addchartbubble(1, bLine, "GV_x2\n" + GV_x2, color.LIGHT_GRAY, no);   
    def m = if bar == x1 then (y1_r - HA_y2) / (x1_r - HA_x2) else m[1];
                #addchartbubble(1, bLine, "m\n" + m, color.cyan, no);
    def m2 = if bar == x1 then (y1_r - GV_y2) / (x1_r - GV_x2) else m2[1];
                #addchartbubble(1, bLine, "m2\n" + m2, color.cyan, no);
    def x = bar - x1_r;
                #addchartbubble(1, bLine, "x\n" + x, color.cyan, no);

    def b = y1_r;


#################################################################################

def x1p =  ATRSave; # starting bar of slope calculation
def x2p =  ATRSave1; # ending bar of slop calculation
def y1_rp = if bar == x1p then y else y1_rp[1];
def y2_rp = if bar == x2p then l else y2_rp[1];

def "y-axisp" = y1_rp - y2_rp;
def "x-axisp" = (x1p - (x2p));
def mxp = "y-axisp" / "x-axisp";
def angle = ATAN(m) * 180 / Double.Pi;

AddLabel(1, "A3 to A2 Angle:" + " " + angle + "°", Color.WHITE);

def ATRSavea = if  !IsNaN(ZZ) then angle else GetValue(ATRSavea, 1);
def ATRSavea1 = if ATRSavea != ATRSavea[1] then ATRSavea[1] else GetValue(ATRSavea1, 1);
def ATRSavea2 = if ATRSavea1 != ATRSavea1[1] then ATRSavea1[1] else GetValue(ATRSavea2, 1);
def ATRSavea3 = if ATRSavea2 != ATRSavea2[1] then ATRSavea2[1] else GetValue(ATRSavea3, 1);

def ATRSavec = if  !IsNaN(ZZ) then ZZ else GetValue(ATRSavec, 1);
def chg = close - GetValue(ATRSavec, 1);
def isUp = chg >= 0;


AddChartBubble(1 and !IsNaN(ZZ) and barNumber != 1, ZZ, "Angle: " + angle +"°", if (ATRSavea - ATRSavea1) - (ATRSavea2 - ATRSavea3) > 0 then Color.GREEN else Color.RED, isUp);
 
Ok. I've been using this code below to display the angle of each wave regardless of chart setup but seem to me that it is not accurate. If this makes sense.


Ruby:
#hidePricePlot();

def priceH = high;
def priceL = low;
def priceC = close;


def o = open;
def h = high;
def l = low;
def c = close;

input percentageReversal = 3;
input absoluteReversal = 0.0;
input atrLength = 2;
input atrReversal = 2;
input tickReversal = 0;

Assert(percentageReversal >= 0, "'percentage reversal' must not be negative: " + percentageReversal);
Assert(absoluteReversal >= 0, "'absolute reversal' must not be negative: " + absoluteReversal);
Assert(atrReversal >= 0, "'atr reversal' must not be negative: " + atrReversal);
Assert(tickReversal >= 0, "'ticks' must not be negative: " + tickReversal);
Assert(percentageReversal != 0 or absoluteReversal != 0 or atrReversal != 0 or tickReversal != 0, "Either 'percentage reversal' or 'absolute reversal' or 'atr reversal' or 'tick reversal' must not be zero");

def absReversal;
if (absoluteReversal != 0) {
    absReversal = absoluteReversal;
} else {
    absReversal =  tickReversal * TickSize();
}

def hlPivot;
if (atrReversal != 0) {
    hlPivot = percentageReversal / 100 + WildersAverage(TrueRange(high, close, low), atrLength) / close * atrReversal;
} else {
    hlPivot = percentageReversal / 100;
}


def state = {default init, undefined, uptrend, downtrend};
def maxPriceH;
def minPriceL;
def newMax;
def newMin;
def prevMaxH = GetValue(maxPriceH, 1);
def prevMinL = GetValue(minPriceL, 1);

if GetValue(state, 1) == GetValue(state.init, 0) {
    maxPriceH = priceH;
    minPriceL = priceL;
    newMax = yes;
    newMin = yes;
    state = state.undefined;
} else if GetValue(state, 1) == GetValue(state.undefined, 0) {
    if priceH >= prevMaxH {
        state = state.uptrend;
        maxPriceH = priceH;
        minPriceL = prevMinL;
        newMax = yes;
        newMin = no;
    } else if priceL <= prevMinL {
        state = state.downtrend;
        maxPriceH = prevMaxH;
        minPriceL = priceL;
        newMax = no;
        newMin = yes;
    } else {
        state = state.undefined;
        maxPriceH = prevMaxH;
        minPriceL = prevMinL;
        newMax = no;
        newMin = no;
    }
} else if GetValue(state, 1) == GetValue(state.uptrend, 0) {
    if priceL <= prevMaxH - prevMaxH * hlPivot - absReversal {
        state = state.downtrend;
        maxPriceH = prevMaxH;
        minPriceL = priceL;
        newMax = no;
        newMin = yes;
    } else {
        state = state.uptrend;
        if (priceH >= prevMaxH) {
            maxPriceH = priceH;
            newMax = yes;
        } else {
            maxPriceH = prevMaxH;
            newMax = no;
        }
        minPriceL = prevMinL;
        newMin = no;
    }
} else {
    if priceH >= prevMinL + prevMinL * hlPivot + absReversal {
        state = state.uptrend;
        maxPriceH = priceH;
        minPriceL = prevMinL;
        newMax = yes;
        newMin = no;
    } else {
        state = state.downtrend;
        maxPriceH = prevMaxH;
        newMax = no;
        if (priceL <= prevMinL) {
            minPriceL = priceL;
            newMin = yes;
        } else {
            minPriceL = prevMinL;
            newMin = no;
        }
    }
}


def barNumber = BarNumber();
def barCount = HighestAll(If(IsNaN(priceH), 0, barNumber));
def newState = GetValue(state, 0) != GetValue(state, 1);
def offset = barCount - barNumber + 1;
def highPoint = state == state.uptrend and priceH == maxPriceH;
def lowPoint = state == state.downtrend and priceL == minPriceL;

def lastH;
if highPoint and offset > 1 {
    lastH = fold iH = 1 to offset with tH = priceH while !IsNaN(tH) and !GetValue(newState, -iH) do if GetValue(newMax, -iH) or iH == offset - 1 and GetValue(priceH, -iH) == tH then Double.NaN else tH;
} else {
    lastH = Double.NaN;
}


def lastL;
if lowPoint and offset > 1 {
    lastL = fold iL = 1 to offset with tL = priceL while !IsNaN(tL) and !GetValue(newState, -iL) do if GetValue(newMin, -iL) or iL == offset - 1 and GetValue(priceL, -iL) == tL then Double.NaN else tL;
} else {
    lastL = Double.NaN;
}


plot ZZ;
if barNumber == 1 {
    ZZ = fold iF = 1 to offset with tP = Double.NaN while IsNaN(tP) do if GetValue(state, -iF) == GetValue(state.uptrend, 0) then priceL else if GetValue(state, -iF) == GetValue(state.downtrend, 0) then priceH else Double.NaN;
} else if barNumber == barCount {
    ZZ = if highPoint or state == state.downtrend and priceL > minPriceL then priceH else if lowPoint or state == state.uptrend and priceH < maxPriceH then priceL else Double.NaN;
} else {
    ZZ = if !IsNaN(lastH) then lastH else if !IsNaN(lastL) then lastL else Double.NaN;
}
ZZ.SetDefaultColor(GetColor(1));
ZZ.EnableApproximation();


input toggle = no;
input reversalamount = 8.0;

def ATRSave = if  !IsNaN(ZZ) then BarNumber() else GetValue(ATRSave, 1);
AddLabel (toggle, "ATRSave:" + " " + Round(ATRSave, 2));

def ATRSave1 = if ATRSave != ATRSave[1] then ATRSave[1] else GetValue(ATRSave1, 1);
AddLabel (toggle, "ATRSave1:" + " " + Round(ATRSave1, 2), Color.CYAN);

def ATRSave2 = if ATRSave != ATRSave then ATRSave else GetValue(ATRSave1, 1);
AddLabel (toggle, "ATRSave2:" + " " + Round(ATRSave2, 2), Color.YELLOW);

def ATRchg1 = Round(close - GetValue(ATRSave1, 1));
def ATRchg2 = Round(close - GetValue(ATRSave2, 1));
plot ATRisUp = ATRchg1 >= 0;
ATRisUp.Hide();
plot ATRisDown = ATRchg1 <= 0;
ATRisDown.Hide();
def isConf1 = AbsValue(ATRchg1) >= reversalamount or (IsNaN(GetValue(ZZ, 1)) and GetValue(isConf1, 1));

##########################################################################################


def start_bn = if !IsNaN(ZZ) then barnumber() else start_bn[1];
addlabel(1, start_bn);
def end_bn = if start_bn!=start_bn[1] then start_bn[1] else end_bn[1];
addlabel(1, end_bn);

 input y = close; # y axis variable to project forward
    def x1 = start_bn; # starting bar of slope calculation
    def x2 = end_bn; # ending bar of slop calculation
    def bar = BarNumber();
    def y1_r = if bar == x1 then y else y1_r[1];
                #addchartbubble(1, bLine, "y1_r\n" + y1_r, color.white, no);
    def y2_r = if bar == x2 then y else y2_r[1];
                #addchartbubble(1, bLine, "y2_r\n" + y2_r, color.white, no);
    def HA_y2 = highestall(y2_r);
                #addchartbubble(1, bLine, "HA_y2\n" + HA_y2, color.white, no);
    def GV_y2 = if bar >= x1 and bar <= x2 then getvalue(close, bar - x2) else double.nan;
                #addchartbubble(1, bLine, "GV_y2\n" + GV_y2, color.white, no);
    def x1_r = if bar == x1 then bar else x1_r[1];
                #addchartbubble(1, bLine, "x1_r\n" + x1_r, color.LIGHT_GRAY, no);
    def x2_r = if bar == x2 then bar else x2_r[1];
                #addchartbubble(1, bLine, "x2_r\n" + x2_r, color.LIGHT_GRAY, no);
    def HA_x2 = Highestall(x2_r);
                #addchartbubble(1, bLine, "HA_x2\n" + HA_x2, color.LIGHT_GRAY, no);
    def GV_x2 = if bar >= x1 and bar <= x2 then getvalue(bar, bar - x2) else double.nan;
                #addchartbubble(1, bLine, "GV_x2\n" + GV_x2, color.LIGHT_GRAY, no);  
    def m = if bar == x1 then (y1_r - HA_y2) / (x1_r - HA_x2) else m[1];
                #addchartbubble(1, bLine, "m\n" + m, color.cyan, no);
    def m2 = if bar == x1 then (y1_r - GV_y2) / (x1_r - GV_x2) else m2[1];
                #addchartbubble(1, bLine, "m2\n" + m2, color.cyan, no);
    def x = bar - x1_r;
                #addchartbubble(1, bLine, "x\n" + x, color.cyan, no);

    def b = y1_r;


#################################################################################

def x1p =  ATRSave; # starting bar of slope calculation
def x2p =  ATRSave1; # ending bar of slop calculation
def y1_rp = if bar == x1p then y else y1_rp[1];
def y2_rp = if bar == x2p then l else y2_rp[1];

def "y-axisp" = y1_rp - y2_rp;
def "x-axisp" = (x1p - (x2p));
def mxp = "y-axisp" / "x-axisp";
def angle = ATAN(m) * 180 / Double.Pi;

AddLabel(1, "A3 to A2 Angle:" + " " + angle + "°", Color.WHITE);

def ATRSavea = if  !IsNaN(ZZ) then angle else GetValue(ATRSavea, 1);
def ATRSavea1 = if ATRSavea != ATRSavea[1] then ATRSavea[1] else GetValue(ATRSavea1, 1);
def ATRSavea2 = if ATRSavea1 != ATRSavea1[1] then ATRSavea1[1] else GetValue(ATRSavea2, 1);
def ATRSavea3 = if ATRSavea2 != ATRSavea2[1] then ATRSavea2[1] else GetValue(ATRSavea3, 1);

def ATRSavec = if  !IsNaN(ZZ) then ZZ else GetValue(ATRSavec, 1);
def chg = close - GetValue(ATRSavec, 1);
def isUp = chg >= 0;


AddChartBubble(1 and !IsNaN(ZZ) and barNumber != 1, ZZ, "Angle: " + angle +"°", if (ATRSavea - ATRSavea1) - (ATRSavea2 - ATRSavea3) > 0 then Color.GREEN else Color.RED, isUp);
reread post#28 from merryday
back in geometry class, the x and y axis were the same units.
on a chart, they are different units, time and price. so calculating an 'angle' is meaningless.
calc the slope, rise over run, a price change over x bars

why do you want an angle?
 
reread post#28 from merryday
back in geometry class, the x and y axis were the same units.
on a chart, they are different units, time and price. so calculating an 'angle' is meaningless.
calc the slope, rise over run, a price change over x bars

why do you want an angle?
I'm trying to assess the sharpness of the angle for rally and reactions.
 
I'm trying to assess the sharpness of the angle for rally and reactions.
Angle is NOT a fix variable that can be calculated on Stock Charts!
Remember back in geometry class, the x and y axis were the same units!
On a chart, they are different units: Time and Price. so calculating an 'angle' is totally meaningless.

The "angle" is not a set, finite value.
The angle will be different depending on how your chart is displayed.

Here is a visual example
Below you will see two copies of the exact same chart, note the difference in the appearance of the "angle"
cC4By84.png

dpr976P.png


Generally when members start discussing 'angle' what they are actually looking for is called MOMENTUM.

Momentum calculation is price change over x bars
The textbook syntax ==
def momo = (Close / Close[5]) *100 ;
read more:
https://stockcharts.com/articles/dancing/2018/10/momentum--rate-of-change.html#:~:text=Here is the formula for,have Momentum less than 100.
 
Last edited:

Similar threads

Not the exact question you're looking for?

Start a new thread and receive assistance from our community.

87k+ Posts
209 Online
Create Post

Similar threads

Similar threads

The Market Trading Game Changer

Join 2,500+ subscribers inside the useThinkScript VIP Membership Club
  • Exclusive indicators
  • Proven strategies & setups
  • Private Discord community
  • ‘Buy The Dip’ signal alerts
  • Exclusive members-only content
  • Add-ons and resources
  • 1 full year of unlimited support

Frequently Asked Questions

What is useThinkScript?

useThinkScript is the #1 community of stock market investors using indicators and other tools to power their trading strategies. Traders of all skill levels use our forums to learn about scripting and indicators, help each other, and discover new ways to gain an edge in the markets.

How do I get started?

We get it. Our forum can be intimidating, if not overwhelming. With thousands of topics, tens of thousands of posts, our community has created an incredibly deep knowledge base for stock traders. No one can ever exhaust every resource provided on our site.

If you are new, or just looking for guidance, here are some helpful links to get you started.

What are the benefits of VIP Membership?
VIP members get exclusive access to these proven and tested premium indicators: Buy the Dip, Advanced Market Moves 2.0, Take Profit, and Volatility Trading Range. In addition, VIP members get access to over 50 VIP-only custom indicators, add-ons, and strategies, private VIP-only forums, private Discord channel to discuss trades and strategies in real-time, customer support, trade alerts, and much more. Learn all about VIP membership here.
How can I access the premium indicators?
To access the premium indicators, which are plug and play ready, sign up for VIP membership here.
Back
Top