#breakout_resis_line_3mo
#https://usethinkscript.com/threads/help-needed-creating-breakout-resistance-line.20128/
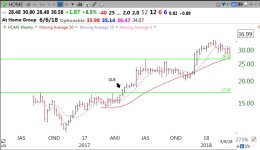
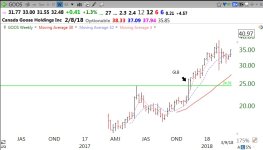
#Help needed creating breakout resistance line
input agg = aggregationperiod.week;
input weeks_back = 12;
def weekhi = highest(high(period=agg)[-(weeks_back-1)],weeks_back);
#def w2 = weeks_back*5;
# this includes current bar in rng
#def weekhi = highest(high[-(w2-1)], (w2+0));
#plot z = weekhi;
addlabel(1, "weeks " + weeks_back , color.yellow);
#===============================
#https://usethinkscript.com/threads/zigzag-high-low-with-supply-demand-zones-for-thinkorswim.172/#post-7048
#post10
# Robert Payne
# define peaks / valleys
def na = double.nan;
def bn = BarNumber();
def lastbn = HighestAll(if IsNaN(close) then 0 else bn);
def lastbar = bn == lastbn;
def highx = high;
def lowx = low;
input peak_length = 7;
def offset = Min(peak_length - 1, lastbn - bn);
def peak = highx > Highest(highx[1], peak_length - 1) and highx == GetValue(Highest(highx, peak_length), -offset);
def valley = lowx < Lowest(lowx[1], peak_length - 1) and lowx == GetValue(Lowest(lowx, peak_length), -offset);
input show_arrows = no;
plot zhi = if show_arrows and peak then high*1.001 else na;
plot zlo = if show_arrows and valley then low*0.999 else na;
zlo.SetPaintingStrategy(PaintingStrategy.ARROW_UP);
zlo.SetDefaultColor(Color.red);
zlo.setlineweight(1);
zlo.hidebubble();
zhi.SetPaintingStrategy(PaintingStrategy.ARROW_DOWN);
zhi.SetDefaultColor(Color.green);
zhi.setlineweight(1);
zhi.hidebubble();
#===============================
def not_retested = if isnan(close) then na
else if lastbar then not_retested[1]
else if isnan(weekhi) then not_retested[1]
else if !peak then not_retested[1]
else if weekhi == high then high
else not_retested[1];
plot z = if not_retested > 0 then not_retested else na;
#------------------------
addchartbubble(0, low*0.99,
bn + "\n" +
high + "\n" +
weekhi + "\n" +
not_retested
, color.yellow, no);
#