I’m looking for help creating a simple Thinkorswim script that draws a breakout resistance line. Here is the exact criteria:
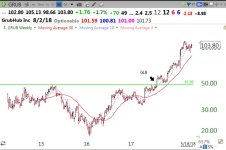
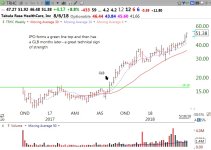
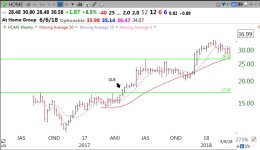
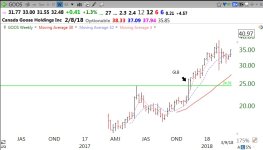
A line should mark the highest price reached of a stock that has not been retested (i.e., the price has not closed at or above this level) for at least 3 months.
I've attached some pictures to help show how the script should display on charts.
Thank you!
A line should mark the highest price reached of a stock that has not been retested (i.e., the price has not closed at or above this level) for at least 3 months.
I've attached some pictures to help show how the script should display on charts.
Thank you!


