I am trying to do this scipt of some one can help me to add line at high
Sma80>sma40
Close > sma 80
To draw line at high of this candle extended for 20 candles
Similar to down side
Sma 80< sma 40
Close < sma 80
I want to draw line at low of this candle extended maybe 20 candles
@halcyonguy I think 1 line from first one has condition true for 20 candles from the first bar that has condition true
Then it should happens again after 20 bars if the condition is true again
I am just using 20 bars as example i can increase it later as much 50 or 60 later if you have better suggestions would be great
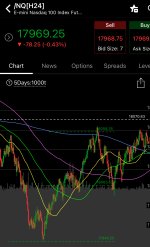
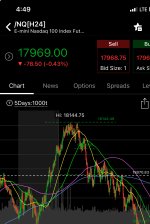
I attached a couples of pic to give you idea what i am looking at i usually enter trade after second retest in general nq is moving so fast no way i will get the fill exactly i usually wait the price to retract back to moving avrage or the price at line
This line I consider it as mean if you can put profit taking at equal distance from lowest last 50 bar to that line but to upside or vice vesra
My trade today...
I am trying to do this scipt of some one can help me to add line at high
Sma80>sma40
Close > sma 80
To draw line at high of this candle extended for 20 candles
Similar to down side
Sma 80< sma 40
Close < sma 80
I want to draw line at low of this candle extended maybe 20 candles
you say, 'this candle' but those conditions will be true for many candles.
do you want diagonal lines connecting all the bars with true conditions?
or lines from just the first one in a series?
from which bar do you want lines extended 20 bars? from the first of many that have true conditions?
from the last bar in a series that is true?
@halcyonguy I think 1 line from first one has condition true for 20 candles from the first bar that has condition true
Then it should happens again after 20 bars if the condition is true again
I am just using 20 bars as example i can increase it later as much 50 or 60 later if you have better suggestions would be great
I attached a couples of pic to give you idea what i am looking at i usually enter trade after second retest in general nq is moving so fast no way i will get the fill exactly i usually wait the price to retract back to moving avrage or the price at line
This line I consider it as mean if you can put profit taking at equal distance from lowest last 50 bar to that line but to upside or vice vesra
My trade today i entered short around 18120
I exite after i did my calculation at 18072
The second example i entered at 17793 and i take profit at 18058
These is 2 successful trade i had failure as well it tells me i am in wrong direction of trend
I am not really sure if it can be written as script
if you can even simplify one singal until opposite signal is true instead 20 bars
Its high return if you trading in right direction
For me this to work i need 5 moving avrages
40>80>160>320
And the opposite is true
Thanks again
sorry, i still don't understand what you are asking for.
your post 3 has many words, but most of them don't help to describe what you want.
after the first 3 sentences, nothing makes sense, nothing is of any use for guessing at what you want.
i have no idea what i am supposed to learn from looking at those pictures.
i make posts like this , not to be mean, but to try to give people feedback on their poor communication. to hopefully get them to rethink logically how to describe their issue.
think about,
where do you want to see something,
what do you want to see,
when do you want to see it,
where do you want to see something,
. chart
what do you want to see,
. horizontal lines, from high and low of a candle, extending for 20 bars
when do you want to see it,
. starting on first bar that this is true , sma80 > sma40 and Close > sma 80.
. same for opposite conditions
---------------------
i went ahead and guessed at something, based on post 1 conditions.
on the first bar that this is true,
.. sma80 > sma40 and Close > sma 80 (and for the opposite conditions)
it starts drawing a line from the high and low.
it draws 2 lines for 20 bars.
if a line is being drawn, another line will not start during it.
Code:
#lines_at_avgaboveavg

#https://usethinkscript.com/threads/help-drawing-line.18048/
#Help drawing line
#Drmoh1800  2/23

#I am trying to do this scipt of some one can help me to add line at high
#Sma80>sma40
#Close > sma 80
#To draw line at high of this candle extended for 20 candles
#Similar to down side
#Sma 80< sma 40
#Close < sma 80
#I want to draw line at low of this candle extended maybe 20 candles


def na = double.nan;
def bn = barnumber();
def data = close;

input length = 20;

#input avg1_type = AverageType.exponential;
input avg1_type = AverageType.Simple;
input avg1_length = 40;
def avg1 = MovingAverage(avg1_type, data, avg1_length );

input avg2_type = AverageType.Simple;
input avg2_length = 80;
def avg2 = MovingAverage(avg2_type, data, avg2_length );

input avg3_type = AverageType.Simple;
input avg3_length = 160;
def avg3 = MovingAverage(avg3_type, data, avg3_length );

input avg4_type = AverageType.Simple;
input avg4_length = 320;
def avg4 = MovingAverage(avg4_type, data, avg4_length );


input show_average_lines = yes;
plot zavg1 = if show_average_lines then avg1 else na;
plot zavg2 = if show_average_lines then avg2 else na;
#plot zavg3 = if show_average_lines then avg3 else na;
#plot zavg4 = if show_average_lines then avg4 else na;

zavg1.SetDefaultColor(getcolor(2));
zavg1.setlineweight(1);
zavg1.hidebubble();
zavg2.SetDefaultColor(getcolor(3));
zavg2.setlineweight(1);
zavg2.hidebubble();

#-------
def up1 = avg2 > avg1;
def up2 = close > avg2;
def up = up1 and up2;
def upfirst = !up[1] and up;

def upcnt = if bn == 1 then 0
 else if upcnt[1] > 0 then upcnt[1] - 1
 else if upfirst then length
 else 0;

def upsignal = upcnt == length;

#-------
def uplinetop = if bn == 1  then na
 else if upsignal then high
 else if upcnt > 0 then uplinetop[1]
 else na;

plot zuphi = uplinetop;
zuphi.setdefaultcolor(color.cyan);

def uplinebot = if bn == 1  then na
 else if upsignal then low
 else if upcnt > 0 then uplinebot[1]
 else na;

plot zuplo = uplinebot;
zuplo.setdefaultcolor(color.cyan);

#===================

def dwn1 = avg2 < avg1;
def dwn2 = close < avg2;
def dwn = dwn1 and dwn2;
def dwnfirst = !dwn[1] and dwn;

def dwncnt = if bn == 1 then 0
 else if dwncnt[1] > 0 then dwncnt[1] - 1
 else if dwnfirst then length
 else 0;

def dwnsignal = dwncnt == length;

#-------
def dwnlinetop = if bn == 1  then na
 else if dwnsignal then high
 else if dwncnt > 0 then dwnlinetop[1]
 else na;

plot zdwnhi = dwnlinetop;
zdwnhi.setdefaultcolor(color.yellow);

def dwnlinebot = if bn == 1  then na
 else if dwnsignal then low
 else if dwncnt > 0 then dwnlinebot[1]
 else na;

plot zdwnlo = dwnlinebot;
zdwnlo.setdefaultcolor(color.yellow);

#------------------

def test_bub = no;
addchartbubble(test_bub,low,
upcnt
, (if upcnt > 0 then color.cyan else color.gray), no);

addchartbubble(test_bub,low,
dwncnt
, (if dwncnt > 0 then color.yellow else color.gray), no);


def test_lines = 0;
#addverticalline( test_lines and up1 or up2, "-");
addverticalline( test_lines and upfirst, "-", color.cyan);
addverticalline( test_lines and upsignal, "-", color.green);
#addverticalline( dwnfirst, "-", color.red);
#
Thank you very much
I really appreciate taking the time to do this work
You are totally right forgive my english is very bad. It took me 1 hr to right these few words . Sometimes is very difficult to explain to my self .this script great visual aid while trading
I really recommend to try if you trade futures .
useThinkScript is the #1 community of stock market investors using indicators and other tools to power their trading strategies. Traders of all skill levels use our forums to learn about scripting and indicators, help each other, and discover new ways to gain an edge in the markets.
How do I get started?
We get it. Our forum can be intimidating, if not overwhelming. With thousands of topics, tens of thousands of posts, our community has created an incredibly deep knowledge base for stock traders. No one can ever exhaust every resource provided on our site.
If you are new, or just looking for guidance, here are some helpful links to get you started.
VIP members get exclusive access to these proven and tested premium indicators: Buy the Dip, Advanced Market Moves 2.0, Take Profit, and Volatility Trading Range. In addition, VIP members get access to over 50 VIP-only custom indicators, add-ons, and strategies, private VIP-only forums, private Discord channel to discuss trades and strategies in real-time, customer support, trade alerts, and much more. Learn all about VIP membership here.
How can I access the premium indicators?
To access the premium indicators, which are plug and play ready, sign up for VIP membership here.