#atr_zones_ema_macd_lines_lower
#https://usethinkscript.com/threads/help-atr-zones-ema-cloud-macd-and-structure-lines.20920/
#Help: ATR Zones, EMA Cloud, MACD, and Structure Lines
#EMAhunter May 3, 2025
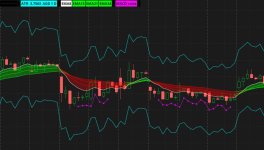
#I'm trying to create a ThinkorSwim study that replicates the setup shown in the attached chart. I'm looking for help with scripting the following:
#1. ATR Levels Display
#Show dynamic ±1 ATR levels based on Daily ATR
#Color-coded zone with labels (as shown: 541.96, 533.26, etc.)
#2. EMA Ribbon
#EMA Ribbon with gradients (I believe it uses 8, 13, 21, 34 or similar EMAs)
#Colors changing from red to green based on trend direction
#3. MACD Filter
#Only highlight trade zones when MACD histogram is red and both MACD/Signal lines are below zero
#4. Optional (if possible):
#Detect small wedge/triangle pattern forming at the bottom (marked with yellow lines)
#Can someone help create a ThinkorSwim study/script that replicates everything shown in this chart?
#Chart features I need in the script:
#EMA cloud (multi-EMA ribbon)
#ATR levels with call/put targets
#PML / PMH lines
#MACD panel with histogram and cross arrows
#Optional: RSI and volume bars
#Dynamic label showing ATR % and range
#declare lower;
def na = double.nan;
def bn = barnumber();
#---------------------
# 1 ATR
# Show dynamic ±1 ATR levels based on Daily ATR
# if agg set to 1 min , then it will use chart agg
input atr_agg = AggregationPeriod.DAY;
#hint atr_agg: "ATR agg , choose 1 minute to use the chart time"
def atr_agg2;
if atr_agg == AggregationPeriod.min then {
atr_agg2 = getaggregationperiod();
} else {
atr_agg2 = atr_agg;
}
def atr_agg2min = atr_agg2/60000;
input atr_length = 14;
#input averageType = AverageType.WILDERS;
def ATR1 = MovingAverage(AverageType.WILDERS, TrueRange(high(period = atr_Agg2), close(period = atr_Agg2), low(period = atr_Agg2)), atr_length);
input atr_factor = 1.0;
plot z1 = close + (atr1 * atr_factor);
z1.SetDefaultColor(color.cyan);
plot z2 = close - (atr1 * atr_factor);
z2.SetDefaultColor(color.cyan);
addlabel(1, " " , color.black);
#def agg2 = GetAggregationPeriod();
def aggmin = atr_agg2 / 60000;
AddLabel(1, "ATR " + atr1 + " AGG " + (if aggmin < 60 then (aggmin + " m")
else if aggmin < 1440 then ((aggmin / 60) + " H")
else if aggmin < 10080 then (aggmin / (60 * 24) + " D")
else if atr_agg2 == AggregationPeriod.WEEK then "W"
else if atr_agg2 == AggregationPeriod.MONTH then "M"
else "")
, Color.CYAN);
addlabel(1, " " , color.black);
#---------------------
# 2 EMA ribbon
# EMA Ribbon with gradients (I believe it uses 8, 13, 21, 34 or similar EMAs)
# Colors changing from red to green based on trend direction
def data = close;
input avg1_type = AverageType.exponential;
input avg1_length = 8;
def avg1 = MovingAverage(avg1_type, data, avg1_length );
input avg2_type = AverageType.exponential;
input avg2_length = 13;
def avg2 = MovingAverage(avg2_type, data, avg2_length );
input avg3_type = AverageType.exponential;
input avg3_length = 21;
def avg3 = MovingAverage(avg3_type, data, avg3_length );
input avg4_type = AverageType.exponential;
input avg4_length = 34;
def avg4 = MovingAverage(avg4_type, data, avg4_length );
def xup = avg1 crosses above avg2;
def xdwn = avg1 crosses below avg2;
def dir = if bn == 1 then 0
else if xup then 1
else if xdwn then -1
else dir[1];
input show_avg_lines = yes;
plot zavg1 = if show_avg_lines then avg1 else na;
plot zavg2 = if show_avg_lines then avg2 else na;
plot zavg3 = if show_avg_lines then avg3 else na;
plot zavg4 = if show_avg_lines then avg4 else na;
zavg1.SetDefaultColor(Color.white);
#zavg1.SetStyle(Curve.MEDIUM_DASH);
#zavg1.setlineweight(1);
zavg1.hidebubble();
zavg2.AssignValueColor(if dir == 1 then color.green else if dir == -1 then color.red else color.gray);
#zavg2.SetDefaultColor(Color.gray);
#zavg2.setlineweight(1);
zavg2.hidebubble();
zavg3.AssignValueColor(if dir == 1 then color.green else if dir == -1 then color.red else color.gray);
#zavg3.SetDefaultColor(Color.gray);
#zavg3.setlineweight(1);
zavg3.hidebubble();
zavg4.AssignValueColor(if dir == 1 then color.green else if dir == -1 then color.red else color.gray);
#zavg4.SetDefaultColor(Color.gray);
#zavg4.setlineweight(1);
zavg4.hidebubble();
input show_avg_labels = yes;
addlabel(show_avg_labels,
(if avg1_type == AverageType.Simple then "SMA"
else if avg1_type == AverageType.exponential then "EMA"
else if avg1_type == AverageType.hull then "HULL"
else if avg1_type == AverageType.weighted then "WT"
else if avg1_type == AverageType.wilders then "WILD"
else "---") + avg1_length
, color.white);
addlabel(show_avg_labels,
(if avg2_type == AverageType.Simple then "SMA"
else if avg2_type == AverageType.exponential then "EMA"
else if avg2_type == AverageType.hull then "HULL"
else if avg2_type == AverageType.weighted then "WT"
else if avg2_type == AverageType.wilders then "WILD"
else "---") + avg2_length
, (if dir == 1 then color.green else if dir == -1 then color.red else color.gray));
#, color.gray);
addlabel(show_avg_labels,
(if avg3_type == AverageType.Simple then "SMA"
else if avg3_type == AverageType.exponential then "EMA"
else if avg3_type == AverageType.hull then "HULL"
else if avg3_type == AverageType.weighted then "WT"
else if avg3_type == AverageType.wilders then "WILD"
else "---") + avg3_length
, (if dir == 1 then color.green else if dir == -1 then color.red else color.gray));
#, color.gray);
addlabel(show_avg_labels,
(if avg4_type == AverageType.Simple then "SMA"
else if avg4_type == AverageType.exponential then "EMA"
else if avg4_type == AverageType.hull then "HULL"
else if avg4_type == AverageType.weighted then "WT"
else if avg4_type == AverageType.wilders then "WILD"
else "---") + avg4_length
, (if dir == 1 then color.green else if dir == -1 then color.red else color.gray));
#, color.gray);
addlabel(1, " " , color.black);
input show_avg_clouds = yes;
def cld1a = if show_avg_clouds then avg1 else na;
def cld1b = if show_avg_clouds then avg2 else na;
def cld2a = if show_avg_clouds then avg2 else na;
def cld2b = if show_avg_clouds then avg3 else na;
def cld3a = if show_avg_clouds then avg3 else na;
def cld3b = if show_avg_clouds then avg4 else na;
addcloud(cld1a,cld1b, color.green, color.red);
addcloud(cld2a,cld2b, color.green, color.red);
addcloud(cld3a,cld3b, color.green, color.red);
#---------------------
#3. MACD Filter
# highlight trade zones when MACD histogram is red and both MACD/Signal lines are below zero
# zone = diff < 0 and value < 0 and avg < 0
# zone = purple line with triangles
input macd_fastLength = 12;
input macd_slowLength = 26;
input MACD_Length = 9;
input macd_averageType = AverageType.EXPONENTIAL;
#input showBreakoutSignals = no;
def Value = MovingAverage(macd_averageType, close, macd_fastLength) - MovingAverage(macd_averageType, close, macd_slowLength);
def Avg = MovingAverage(macd_averageType, Value, MACD_Length);
def Diff = Value - Avg;
def ZeroLine = 0;
def UpSignal = if Diff crosses above ZeroLine then ZeroLine else Double.NaN;
def DownSignal = if Diff crosses below ZeroLine then ZeroLine else Double.NaN;
def macd_zone = diff < 0 and value < 0 and avg < 0;
input show_macd_zone = yes;
plot zm = if show_macd_zone and macd_zone then low*0.995 else na;
zm.SetPaintingStrategy(PaintingStrategy.LINE_VS_TRIANGLES);
zm.SetDefaultColor(Color.magenta);
#zm.setlineweight(1);
zm.hidebubble();
addlabel(1, "MACD zone", color.magenta);
addlabel(1, " " , color.black);
#---------------------
# 4. Optional
# Detect small wedge/triangle pattern forming at the bottom (marked with yellow lines)
#