
Author Message:
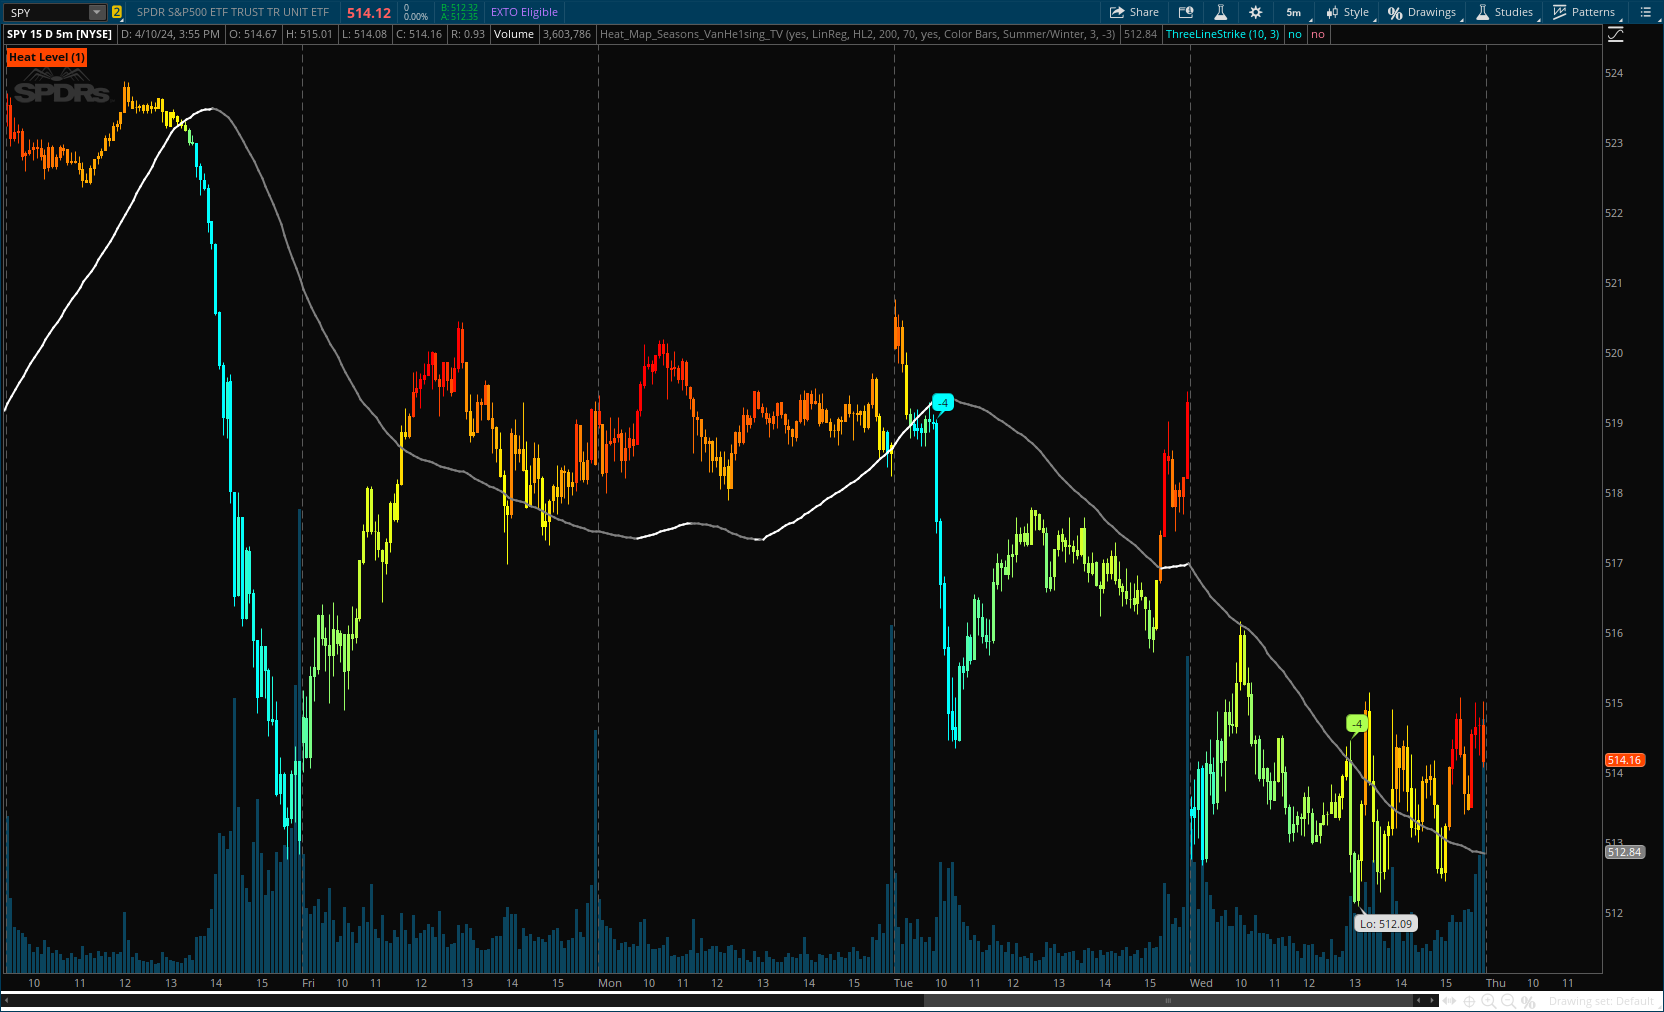
Indicator offers traders a unique perspective on market dynamics by visualizing seasonal trends and deviations from typical price behavior. By blending Mov Avg analysis with a color-coded heat map, this indicator highlights periods of heightened volatility and helps identify potential shifts in market sentiment.
More Details : https://www.tradingview.com/v/zuS134uh/
Code:
CSS:
#// This is a ToS indicator
#// © VanHe1sing
#indicator("Heat Map Seasons", shorttitle = "HeatMapS", overlay =  true)
# Converted and mod by Sam4Cok@Samer800    - 04/2024

input showHeatLevelLabel = yes;
input MovAvgType = {default LinReg, SMA, EMA, WMA, TMA, VAR, WWMA, ZLEMA, TSF}; # 'Moving Average Type'
input src = hl2;
input Length         = 200; #, "Length")
input HeatSensitivity = 70; #, "Heat Sensitivity", step = 10)
input show_line      = yes; # "Show Regression Line?")
input Colors = {Default "Color Bars", "Color Line", "Color Bars & Lines", "Don't Color"};
input signals = {"Summer", "Winter",Default "Summer/Winter", "Don't Show"};
input SummerTemperature = 3;
input WinterTemperature = -3;

def summer = Min(14, Max(SummerTemperature, 0));
def winter = Max(-14, Min(WinterTemperature,0));

def sigUp = signals == signals."Summer" or signals == signals."Summer/Winter";
def sigDn = signals == signals."Winter" or signals == signals."Summer/Winter";

def na = Double.NaN;
def bar; def line;
Switch (Colors) {
Case "Color Line" :
    bar = no;
    line = yes;
Case "Color Bars & Lines" :
    bar = yes;
    line = yes;
Case "Don't Color" :
    bar = no;
    line = no;
Default :
    bar = yes;
    line = no;
}
#// ————— Normalization Function
Script normalization {
input src = close;
input mean = close;
    def norm = (src - mean) / stdev(src, 200);
    def nor = if norm > 5 then 5 else if norm < -5 then -5 else norm;
    plot out = nor;
}
#// ————— Rescale Function (when range is known).
Script rescale {
input _src = close;
input _oldMin = -100;
input _oldMax = 100;
input _newMin = -1;
input _newMax = 1;
    def neg = Double.NEGATIVE_INFINITY;
    def mmax = max(_oldMax - _oldMin, neg);
    def rescale = _newMin + (_newMax - _newMin) * (_src - _oldMin) / mmax;
    plot out = rescale;
}
#pine_linreg(src, len, offset=0) =>
script linreg {
    input src = close;
    input len = 100;
    input offset = 0;
    def na = Double.NaN;
    def bar_index = IsNaN(close);
    def x_sum = if bar_index then na else
                fold i = 0 to len with p do
                 p + i;
    def xx_sum = if bar_index then na else
                fold ii = 0 to len with pp do
                 pp + ii * ii;
    def y_sum = Sum(src, len);
    def xy_sum = fold j = 0 to len with q do
                  q  + j * GetValue(src, len - j - 1);
    def slope = (len * xy_sum - x_sum * y_sum) / (len * xx_sum - x_sum * x_sum);
    def intercept = (y_sum - slope * x_sum) / len;
    def linreg = intercept + slope * (len - offset - 1);
    plot out = linreg;
}
script f_var {
    input data = close;
    input length = 20;
    def change = AbsValue(data - data[1]);
    def a = Average(data, length);
    def b = AbsValue(data - data[9]);
    def c = Sum(change, 9);
    def d = if c != 0 then b / c else 0;
    def e = 2 / (length + 1);
    def r = if length == 1 then a else
            CompoundValue(1, if !r[1] then a else d * e * (data - r[1]) + r[1], a);
    plot out = r;
}
#Wwma_Func(src, length) =>
script Wwma_Func {
    input src = close;
    input length = 2;
    def wwalpha = 1 / length;
    def WWMA = CompoundValue(1, wwalpha * src + (1 - wwalpha) * WWMA[1], src);
    plot return = WWMA;
}
#Zlema_Func(src, length) =>
script Zlema_Func {
    input src = close;
    input length = 2;
    def zxLag = if length / 2 == Round(length / 2, 0) then length / 2 else (length - 1) / 2;
    def zxEMAData = src + src - src[zxLag];
    def ZLEMA = ExpAverage(zxEMAData, length);
    plot return = ZLEMA;
}
#Tsf_Func(src, length) =>
script Tsf_Func {
    input src = close;
    input length = 2;
    def lrc = Inertia(src, length);
    def lrc1 = linreg(src, length, 1);
    def lrs = lrc - lrc1;
    def TSF = Inertia(src, length) + lrs;
    plot retur = TSF;
}
#ma(src, length, type) =>
script ma {
    input src = close;
    input length = 80;
    input type   = "SMA";
    def ma =
     if type == "SMA"   then Average(src, length) else
     if type == "EMA"   then ExpAverage(src, length) else
     if type == "WMA"   then WMA(src, length) else
     if type == "DEMA"  then DEMA(src, length) else
     if type == "TMA"   then MovAvgTriangular(src, length) else
     if type == "VAR"   then f_var(src, length) else
     if type == "WWMA"  then WWMA_Func(src, length) else
     if type == "ZLEMA" then Zlema_Func(src, length) else
     if type == "TSF"   then Tsf_Func(src, length) else
     if type == "HULL"  then HullMovingAvg(src, length) else Inertia(src, length);
    plot result = ma;
}
def Regression_Line = ma(src, Length, MovAvgType);

#// ————— Heat Map Color Bars
def color_level = normalization(close - Regression_Line, 0);
def lvlHi = highest(color_level, HeatSensitivity);
def lvlLo = lowest(color_level, HeatSensitivity);
def scaleHi = if color_level > 0 then rescale(color_level, 0, lvlHi, 0, 100) else 0;
def scaleLo = if color_level > 0 then 0 else rescale(color_level, lvlLo, 0, 0, 100);
def colHi = if isNaN(scaleHi) then 0 else if scaleHi > 100 then 100 else if scaleHi < 0 then 0 else scaleHi *2.55;
def colLo = if isNaN(scaleLo) then 0 else if scaleLo > 100 then 100 else if scaleLo < 0 then 0 else scaleLo *2.55;

#// Plot of Regression_Line
plot RegLine = if show_line then Regression_Line else na;
RegLine.AssignValueColor(if !line then if Regression_Line>Regression_Line[1] then Color.WHITE else Color.GRAY else
                         if color_level > 0 then CreateColor(255,255- colHi, 0) else
                                         CreateColor(colLo, 255 ,255- colLo));
RegLine.SetLineWeight(2);

AssignPriceColor(if !bar then Color.CURRENT else
                 if color_level > 0 then CreateColor(255,255- colHi, 0) else
                                         CreateColor(colLo, 255 ,255- colLo));

#// Gauge point
def Gauge = rescale(color_level, -4, 5, 0, 30);
def g_p = Round(if Gauge < 0 then 0 else Gauge, 0) - 15;
def conHi = g_p[1] == summer - 1 and (g_p Crosses Above summer);
def conLo = g_p[1] == winter + 1 and (g_p Crosses Below Winter);

AddChartBubble(SigUp and conHi, low, g_p, CreateColor(255,255- colHi, 0), no);
AddChartBubble(SigDn and conLo, high, g_p, CreateColor(colLo, 255 ,255- colLo));

AddLabel(showHeatLevelLabel,"Heat Level (" + g_p + ")", if color_level > 0 then CreateColor(255,255- colHi, 0) else
                                                               CreateColor(colLo, 255 ,255- colLo));


#-- END of CODE
Last edited by a moderator:
