Generating Pivots

DTM5459

New member
VIP
I calculate the following support and resistance every morning
R3: R1 + (High-Low)
R2: Pivot + (High- Low)
R1: 2 * Pivot - Low
Pivot: (High + Low + Close)/3
S1: 2 * Pivot -High
S2: Pivot - (High - Low)
S3: S1 - (High - Low)
This is based on 24 hour period, starting at 4:30 pm EST and ending the following day at 4:15 pm EST. I do this in excel and then plot the lines on my chart. Is there anyway this can be automated? I use these as stations and trade station to station. Hitting R3 and S3 is a rare occurrence

Thanks so much
 
Solution
DTM, this takes the prior trading day (5pm-5pm) as the basis for your pivot, support and resistance levels.

Code:
input aggPeriod = AggregationPeriod.DAY;
input displace = -1;             # This displaces the data by 1 AggregationPeriod. (-1 will displace the range by one day in the past.

def PIV = hlc3(period = aggPeriod)[-displace];

def R1 = 2 * PIV - low(period = aggPeriod)[-displace];
def R2 = PIV + high(period = aggPeriod)[-displace] - low(period = aggPeriod)[-displace];
def R3 = R1 + high(period = aggPeriod)[-displace] - low(period = aggPeriod)[-displace];

def S1 = 2 * PIV - high(period=aggPeriod)[-displace];
def S2 = PIV - high(period = aggPeriod)[-displace] + low(period = aggPeriod)[-displace];
def S3 = S1 - high(period =...
I calculate the following support and resistance every morning
R3: R1 + (High-Low)
R2: Pivot + (High- Low)
R1: 2 * Pivot - Low
Pivot: (High + Low + Close)/3
S1: 2 * Pivot -High
S2: Pivot - (High - Low)
S3: S1 - (High - Low)
This is based on 24 hour period, starting at 4:30 pm EST and ending the following day at 4:15 pm EST. I do this in excel and then plot the lines on my chart. Is there anyway this can be automated? I use these as stations and trade station to station. Hitting R3 and S3 is a rare occurrence

Thanks so much
DTM, this takes the prior trading day (5pm-5pm) as the basis for your pivot, support and resistance levels.

Code:
input aggPeriod = AggregationPeriod.DAY;
input displace = -1;             # This displaces the data by 1 AggregationPeriod. (-1 will displace the range by one day in the past.

def PIV = hlc3(period = aggPeriod)[-displace];

def R1 = 2 * PIV - low(period = aggPeriod)[-displace];
def R2 = PIV + high(period = aggPeriod)[-displace] - low(period = aggPeriod)[-displace];
def R3 = R1 + high(period = aggPeriod)[-displace] - low(period = aggPeriod)[-displace];

def S1 = 2 * PIV - high(period=aggPeriod)[-displace];
def S2 = PIV - high(period = aggPeriod)[-displace] + low(period = aggPeriod)[-displace];
def S3 = S1 - high(period = aggPeriod)[-displace] + low(period = aggPeriod)[-displace];

plot Pivot = PIV;
plot Res1 = R1;
plot Res2 = R2;
plot Res3 = R3;
plot Sup1 = S1;
plot Sup2 = S2;
plot Sup3 = S3;
SupRes.jpg
 
DTM, this takes the prior trading day (5pm-5pm) as the basis for your pivot, support and resistance levels.

Code:
input aggPeriod = AggregationPeriod.DAY;
input displace = -1;             # This displaces the data by 1 AggregationPeriod. (-1 will displace the range by one day in the past.

def PIV = hlc3(period = aggPeriod)[-displace];

def R1 = 2 * PIV - low(period = aggPeriod)[-displace];
def R2 = PIV + high(period = aggPeriod)[-displace] - low(period = aggPeriod)[-displace];
def R3 = R1 + high(period = aggPeriod)[-displace] - low(period = aggPeriod)[-displace];

def S1 = 2 * PIV - high(period=aggPeriod)[-displace];
def S2 = PIV - high(period = aggPeriod)[-displace] + low(period = aggPeriod)[-displace];
def S3 = S1 - high(period = aggPeriod)[-displace] + low(period = aggPeriod)[-displace];

plot Pivot = PIV;
plot Res1 = R1;
plot Res2 = R2;
plot Res3 = R3;
plot Sup1 = S1;
plot Sup2 = S2;
plot Sup3 = S3;

please test codes before posting

aggregation of DAY , reads data from normal trading hours , 9:30 to 4pm.
it does not read data from premarket.
it does not read 5pm to 5pm

here is a code to find the highest and lowest , using day. it ignores premarket data

Code:
input agg = AggregationPeriod.DAY;

plot zhi = high(period = agg);
zhi.SetPaintingStrategy(PaintingStrategy.HORIZONTAL);
zhi.SetDefaultColor(Color.cyan);
zhi.hidebubble();

plot zlo = low(period = agg);
zlo.SetPaintingStrategy(PaintingStrategy.HORIZONTAL);
zhi.SetDefaultColor(Color.cyan);
zhi.hidebubble();


i am finishing up a code for this Q
 
Solution
I calculate the following support and resistance every morning
R3: R1 + (High-Low)
R2: Pivot + (High- Low)
R1: 2 * Pivot - Low
Pivot: (High + Low + Close)/3
S1: 2 * Pivot -High
S2: Pivot - (High - Low)
S3: S1 - (High - Low)
This is based on 24 hour period, starting at 4:30 pm EST and ending the following day at 4:15 pm EST. I do this in excel and then plot the lines on my chart. Is there anyway this can be automated? I use these as stations and trade station to station. Hitting R3 and S3 is a rare occurrence

Thanks so much

i think this will work with different start times, even if the start time doesn't exist.
you pick a start time, HHMM , and it defines a 24 hour period in which to draw pivot lines.
it turned out to be tricky to properly define the start time. when there are missing time candles.
this starts on a time that is close to the desired time, and less than the next candle time.
another tricky part was when a start candle is the last bar of the day.

after defining the start time, it finds the OHLC levels.
then uses those to find the pivot levels.


Code:
# pivots_from_prev_24hours
#https://usethinkscript.com/threads/generating-pivots.20948/
#Generating Pivots
#DTM5459  4/24
#I calculate the following support and resistance every morning
#R3: R1 + (High-Low)
#R2: Pivot + (High- Low)
#R1: 2 * Pivot - Low
#Pivot: (High + Low + Close)/3
#S1: 2 * Pivot -High
#S2: Pivot - (High - Low)
#S3: S1 - (High - Low)
#This is based on 24 hour period, starting at 4:30 pm EST and ending the following day at 4:15 pm EST. I do this in excel and then plot the lines on my chart. Is there anyway this can be automated? I use these as stations and trade station to station. Hitting R3 and S3 is a rare occurrence

#------------------

# define start and stop times
# read open at start time
# read close at stop time
# find highest and lowest between start and stop times
# calc pivot levels
# draw lines on current day


def na = double.nan;
def bn = barnumber();
#def d = getday();
#def newday = d != d[1];
def n = 1600;
def big = 99999;
def b = !isnan(close);

#  4.30pm est start
input start = 1630;
#hint start: Enter a start time, HHMM.

def first1 = SecondsFromTime(start)[1] < 0 and SecondsFromTime(start) >= 0;
def first2 = SecondsFromTime(start) < 0 and (SecondsFromTime(start) > SecondsFromTime(start)[-1]);
def first = first1 or first2;
def last2 = first[-1];
def last = last2;

def o2;
def h2;
def l2;
def c2;
if first then {
# on the first bar of period, look at future bars and find, open , max hi and min low, and last close
 o2 = open;
 h2 = fold a1 = 0 to n
 with b1
 while  !isnan(getvalue(close,-(a1+1))) and !getvalue(last, -(a1+1))
 do max(getvalue(high,-(a1+0)),b1);

 l2 = fold a2 = 0 to n
 with b2 = big
 while  !isnan(getvalue(close,-(a2+1))) and !getvalue(last, -(a2+1))
 do min(getvalue(low,-(a2+1)),b2);

 c2 = fold a3 = 0 to n
 with b3
 while !isnan(getvalue(close,-(a3+1))) and !getvalue(last, -(a3+1))
 do getvalue(close,-a3);
} else { 
 o2 = o2[1];
 h2 = h2[1];
 l2 = l2[1];
 c2 = c2[1];
}

# check for 0 or 99999
def o = if o2 == 0 or o2 >= big then o[1] else o2;
def h = if h2 == 0 or h2 >= big then h[1] else h2;
def l = if l2 == 0 or l2 >= big then l[1] else l2;
def c = if c2 == 0 or h2 >= big then c[1] else c2;


def Pivot = (h + l + c)/3;
def R1 = (2 * Pivot) - L;
def R2 = Pivot + (h- l);
def R3 = R1 + (h-l);
def S1 = (2 * Pivot) - h;
def S2 = Pivot - (h - l);
def S3 = S1 - (h - l);


input show_pivot_lines = yes;
plot zp = if show_pivot_lines and b and pivot > 0 then pivot else na;
plot zr1 = if show_pivot_lines and b and r1 > 0 then r1 else na;
plot zr2 = if show_pivot_lines and b and r2 > 0 then r2 else na;
plot zr3 = if show_pivot_lines and b and r3 > 0 then r3 else na;
plot zs1 = if show_pivot_lines and b and s1 > 0 then s1 else na;
plot zs2 = if show_pivot_lines and b and s2 > 0 then s2 else na;
plot zs3 = if show_pivot_lines and b and s3 > 0 then s3 else na;

zr1.SetPaintingStrategy(PaintingStrategy.HORIZONTAL);
zr2.SetPaintingStrategy(PaintingStrategy.HORIZONTAL);
zr3.SetPaintingStrategy(PaintingStrategy.HORIZONTAL);
zp.SetPaintingStrategy(PaintingStrategy.HORIZONTAL);
zs1.SetPaintingStrategy(PaintingStrategy.HORIZONTAL);
zs2.SetPaintingStrategy(PaintingStrategy.HORIZONTAL);
zs3.SetPaintingStrategy(PaintingStrategy.HORIZONTAL);
zr1.SetDefaultColor(Color.red);
zr2.SetDefaultColor(Color.red);
zr3.SetDefaultColor(Color.red);
zp.SetDefaultColor(Color.magenta);
zs1.SetDefaultColor(Color.green);
zs2.SetDefaultColor(Color.green);
zs3.SetDefaultColor(Color.green);
zp.setlineweight(2);


#----------------------
# test stuff

input test1_ohlc_lines = no;
plot z1 = if test1_ohlc_lines and o > 0 then o else na;
plot z2 = if test1_ohlc_lines and h > 0 then h else na;
plot z3 = if test1_ohlc_lines and l > 0 then l else na;
plot z4 = if test1_ohlc_lines and c > 0 then c else na;
z1.SetPaintingStrategy(PaintingStrategy.HORIZONTAL);
z2.SetPaintingStrategy(PaintingStrategy.HORIZONTAL);
z3.SetPaintingStrategy(PaintingStrategy.HORIZONTAL);
z4.SetPaintingStrategy(PaintingStrategy.HORIZONTAL);
z1.SetDefaultColor(Color.cyan);
z2.SetDefaultColor(Color.white);
z3.SetDefaultColor(Color.white);
z4.SetDefaultColor(Color.yellow);


input test2_bubbles = no;
addchartbubble(test2_bubbles , low*0.99,
first + "\n" +
 o + "\n" +
 h + "\n" +
 l + "\n" +
 c + "\n" 
, (if first then color.green else if last then color.red else color.gray), no);


input test3_firstlast = no;
plot z11 = if test3_firstlast and first then high else na;
z11.SetPaintingStrategy(PaintingStrategy.ARROW_down);
z11.SetDefaultColor(Color.cyan);
z11.setlineweight(3);
z11.hidebubble();

plot z12 = if test3_firstlast and last then low else na;
z12.SetPaintingStrategy(PaintingStrategy.ARROW_UP);
z12.SetDefaultColor(Color.yellow);
z12.setlineweight(3);
z12.hidebubble();

input test4 = no;
addchartbubble(test4, low*0.99,
# SecondsFromTime(start)[1] + "\n" +
 SecondsFromTime(start) + "\n" +
 first1 + " F1\n" +
 first2 + " F2\n" +
 first + " F\n" +
 last2 + " L2\n" +
 last + " L"
#(SecondsFromTime(end)[1] < 0 and SecondsFromTime(end) >= 0) + "\n" +
#last2 + "\n" 
, color.yellow, no);

#-----------------------

def ext = if SecondsFromTime(1600) == 0 then 1 else ext[1];
addlabel(ext == 0, "---- EXTENDED HOURS ARE TURNED OFF ----", color.cyan);
#addchartbubble(1, high, four, color.cyan);
#
 

Attachments

  • 00d-img1.JPG
    00d-img1.JPG
    58.4 KB · Views: 9
please test codes before posting

aggregation of DAY , reads data from normal trading hours , 9:30 to 4pm.
it does not read data from premarket.
it does not read 5pm to 5pm

here is a code to find the highest and lowest , using day. it ignores premarket data

Code:
input agg = AggregationPeriod.DAY;

plot zhi = high(period = agg);
zhi.SetPaintingStrategy(PaintingStrategy.HORIZONTAL);
zhi.SetDefaultColor(Color.cyan);
zhi.hidebubble();

plot zlo = low(period = agg);
zlo.SetPaintingStrategy(PaintingStrategy.HORIZONTAL);
zhi.SetDefaultColor(Color.cyan);
zhi.hidebubble();


i am finishing up a code for this Q
"aggregation of DAY , reads data from normal trading hours , 9:30 to 4pm."
That depends on the market. Surely you don't mean that all markets are 9:30 to 4pm.
i think this will work with different start times, even if the start time doesn't exist.
you pick a start time, HHMM , and it defines a 24 hour period in which to draw pivot lines.
it turned out to be tricky to properly define the start time. when there are missing time candles.
this starts on a time that is close to the desired time, and less than the next candle time.
another tricky part was when a start candle is the last bar of the day.

after defining the start time, it finds the OHLC levels.
then uses those to find the pivot levels.


Code:
# pivots_from_prev_24hours
#https://usethinkscript.com/threads/generating-pivots.20948/
#Generating Pivots
#DTM5459  4/24
#I calculate the following support and resistance every morning
#R3: R1 + (High-Low)
#R2: Pivot + (High- Low)
#R1: 2 * Pivot - Low
#Pivot: (High + Low + Close)/3
#S1: 2 * Pivot -High
#S2: Pivot - (High - Low)
#S3: S1 - (High - Low)
#This is based on 24 hour period, starting at 4:30 pm EST and ending the following day at 4:15 pm EST. I do this in excel and then plot the lines on my chart. Is there anyway this can be automated? I use these as stations and trade station to station. Hitting R3 and S3 is a rare occurrence

#------------------

# define start and stop times
# read open at start time
# read close at stop time
# find highest and lowest between start and stop times
# calc pivot levels
# draw lines on current day


def na = double.nan;
def bn = barnumber();
#def d = getday();
#def newday = d != d[1];
def n = 1600;
def big = 99999;
def b = !isnan(close);

#  4.30pm est start
input start = 1630;
#hint start: Enter a start time, HHMM.

def first1 = SecondsFromTime(start)[1] < 0 and SecondsFromTime(start) >= 0;
def first2 = SecondsFromTime(start) < 0 and (SecondsFromTime(start) > SecondsFromTime(start)[-1]);
def first = first1 or first2;
def last2 = first[-1];
def last = last2;

def o2;
def h2;
def l2;
def c2;
if first then {
# on the first bar of period, look at future bars and find, open , max hi and min low, and last close
 o2 = open;
 h2 = fold a1 = 0 to n
 with b1
 while  !isnan(getvalue(close,-(a1+1))) and !getvalue(last, -(a1+1))
 do max(getvalue(high,-(a1+0)),b1);

 l2 = fold a2 = 0 to n
 with b2 = big
 while  !isnan(getvalue(close,-(a2+1))) and !getvalue(last, -(a2+1))
 do min(getvalue(low,-(a2+1)),b2);

 c2 = fold a3 = 0 to n
 with b3
 while !isnan(getvalue(close,-(a3+1))) and !getvalue(last, -(a3+1))
 do getvalue(close,-a3);
} else {
 o2 = o2[1];
 h2 = h2[1];
 l2 = l2[1];
 c2 = c2[1];
}

# check for 0 or 99999
def o = if o2 == 0 or o2 >= big then o[1] else o2;
def h = if h2 == 0 or h2 >= big then h[1] else h2;
def l = if l2 == 0 or l2 >= big then l[1] else l2;
def c = if c2 == 0 or h2 >= big then c[1] else c2;


def Pivot = (h + l + c)/3;
def R1 = (2 * Pivot) - L;
def R2 = Pivot + (h- l);
def R3 = R1 + (h-l);
def S1 = (2 * Pivot) - h;
def S2 = Pivot - (h - l);
def S3 = S1 - (h - l);


input show_pivot_lines = yes;
plot zp = if show_pivot_lines and b and pivot > 0 then pivot else na;
plot zr1 = if show_pivot_lines and b and r1 > 0 then r1 else na;
plot zr2 = if show_pivot_lines and b and r2 > 0 then r2 else na;
plot zr3 = if show_pivot_lines and b and r3 > 0 then r3 else na;
plot zs1 = if show_pivot_lines and b and s1 > 0 then s1 else na;
plot zs2 = if show_pivot_lines and b and s2 > 0 then s2 else na;
plot zs3 = if show_pivot_lines and b and s3 > 0 then s3 else na;

zr1.SetPaintingStrategy(PaintingStrategy.HORIZONTAL);
zr2.SetPaintingStrategy(PaintingStrategy.HORIZONTAL);
zr3.SetPaintingStrategy(PaintingStrategy.HORIZONTAL);
zp.SetPaintingStrategy(PaintingStrategy.HORIZONTAL);
zs1.SetPaintingStrategy(PaintingStrategy.HORIZONTAL);
zs2.SetPaintingStrategy(PaintingStrategy.HORIZONTAL);
zs3.SetPaintingStrategy(PaintingStrategy.HORIZONTAL);
zr1.SetDefaultColor(Color.red);
zr2.SetDefaultColor(Color.red);
zr3.SetDefaultColor(Color.red);
zp.SetDefaultColor(Color.magenta);
zs1.SetDefaultColor(Color.green);
zs2.SetDefaultColor(Color.green);
zs3.SetDefaultColor(Color.green);
zp.setlineweight(2);


#----------------------
# test stuff

input test1_ohlc_lines = no;
plot z1 = if test1_ohlc_lines and o > 0 then o else na;
plot z2 = if test1_ohlc_lines and h > 0 then h else na;
plot z3 = if test1_ohlc_lines and l > 0 then l else na;
plot z4 = if test1_ohlc_lines and c > 0 then c else na;
z1.SetPaintingStrategy(PaintingStrategy.HORIZONTAL);
z2.SetPaintingStrategy(PaintingStrategy.HORIZONTAL);
z3.SetPaintingStrategy(PaintingStrategy.HORIZONTAL);
z4.SetPaintingStrategy(PaintingStrategy.HORIZONTAL);
z1.SetDefaultColor(Color.cyan);
z2.SetDefaultColor(Color.white);
z3.SetDefaultColor(Color.white);
z4.SetDefaultColor(Color.yellow);


input test2_bubbles = no;
addchartbubble(test2_bubbles , low*0.99,
first + "\n" +
 o + "\n" +
 h + "\n" +
 l + "\n" +
 c + "\n"
, (if first then color.green else if last then color.red else color.gray), no);


input test3_firstlast = no;
plot z11 = if test3_firstlast and first then high else na;
z11.SetPaintingStrategy(PaintingStrategy.ARROW_down);
z11.SetDefaultColor(Color.cyan);
z11.setlineweight(3);
z11.hidebubble();

plot z12 = if test3_firstlast and last then low else na;
z12.SetPaintingStrategy(PaintingStrategy.ARROW_UP);
z12.SetDefaultColor(Color.yellow);
z12.setlineweight(3);
z12.hidebubble();

input test4 = no;
addchartbubble(test4, low*0.99,
# SecondsFromTime(start)[1] + "\n" +
 SecondsFromTime(start) + "\n" +
 first1 + " F1\n" +
 first2 + " F2\n" +
 first + " F\n" +
 last2 + " L2\n" +
 last + " L"
#(SecondsFromTime(end)[1] < 0 and SecondsFromTime(end) >= 0) + "\n" +
#last2 + "\n"
, color.yellow, no);

#-----------------------

def ext = if SecondsFromTime(1600) == 0 then 1 else ext[1];
addlabel(ext == 0, "---- EXTENDED HOURS ARE TURNED OFF ----", color.cyan);
#addchartbubble(1, high, four, color.cyan);
#
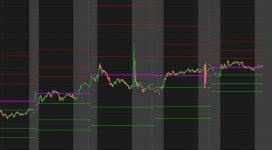
Please test your code before posting. I'm quite sure the request was to displace the pivot, support and resistance by one day.

FWIW - I test with Forex, and surely the normal trading hours for currencies is EST 5p-5p.
 
Last edited:

Join useThinkScript to post your question to a community of 21,000+ developers and traders.

Thread starter Similar threads Forum Replies Date
MP432 Fractal Pivots Indicator - Need help adding signal Questions 1
A AMM w/Trend Pivots Questions 2
R ATR Pivots Questions 2
Z 2nd & 3rd Order pivots Questions 2
A Pivots with Fibs Questions 4

Similar threads

Not the exact question you're looking for?

Start a new thread and receive assistance from our community.

87k+ Posts
368 Online
Create Post

Similar threads

Similar threads

The Market Trading Game Changer

Join 2,500+ subscribers inside the useThinkScript VIP Membership Club
  • Exclusive indicators
  • Proven strategies & setups
  • Private Discord community
  • ‘Buy The Dip’ signal alerts
  • Exclusive members-only content
  • Add-ons and resources
  • 1 full year of unlimited support

Frequently Asked Questions

What is useThinkScript?

useThinkScript is the #1 community of stock market investors using indicators and other tools to power their trading strategies. Traders of all skill levels use our forums to learn about scripting and indicators, help each other, and discover new ways to gain an edge in the markets.

How do I get started?

We get it. Our forum can be intimidating, if not overwhelming. With thousands of topics, tens of thousands of posts, our community has created an incredibly deep knowledge base for stock traders. No one can ever exhaust every resource provided on our site.

If you are new, or just looking for guidance, here are some helpful links to get you started.

What are the benefits of VIP Membership?
VIP members get exclusive access to these proven and tested premium indicators: Buy the Dip, Advanced Market Moves 2.0, Take Profit, and Volatility Trading Range. In addition, VIP members get access to over 50 VIP-only custom indicators, add-ons, and strategies, private VIP-only forums, private Discord channel to discuss trades and strategies in real-time, customer support, trade alerts, and much more. Learn all about VIP membership here.
How can I access the premium indicators?
To access the premium indicators, which are plug and play ready, sign up for VIP membership here.
Back
Top