# pivots_from_prev_24hours
#https://usethinkscript.com/threads/generating-pivots.20948/
#Generating Pivots
#DTM5459 4/24
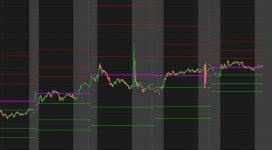
#I calculate the following support and resistance every morning
#R3: R1 + (High-Low)
#R2: Pivot + (High- Low)
#R1: 2 * Pivot - Low
#Pivot: (High + Low + Close)/3
#S1: 2 * Pivot -High
#S2: Pivot - (High - Low)
#S3: S1 - (High - Low)
#This is based on 24 hour period, starting at 4:30 pm EST and ending the following day at 4:15 pm EST. I do this in excel and then plot the lines on my chart. Is there anyway this can be automated? I use these as stations and trade station to station. Hitting R3 and S3 is a rare occurrence
#------------------
# define start and stop times
# read open at start time
# read close at stop time
# find highest and lowest between start and stop times
# calc pivot levels
# draw lines on current day
def na = double.nan;
def bn = barnumber();
#def d = getday();
#def newday = d != d[1];
def n = 1600;
def big = 99999;
def b = !isnan(close);
# 4.30pm est start
input start = 1630;
#hint start: Enter a start time, HHMM.
def first1 = SecondsFromTime(start)[1] < 0 and SecondsFromTime(start) >= 0;
def first2 = SecondsFromTime(start) < 0 and (SecondsFromTime(start) > SecondsFromTime(start)[-1]);
def first = first1 or first2;
def last2 = first[-1];
def last = last2;
def o2;
def h2;
def l2;
def c2;
if first then {
# on the first bar of period, look at future bars and find, open , max hi and min low, and last close
o2 = open;
h2 = fold a1 = 0 to n
with b1
while !isnan(getvalue(close,-(a1+1))) and !getvalue(last, -(a1+1))
do max(getvalue(high,-(a1+0)),b1);
l2 = fold a2 = 0 to n
with b2 = big
while !isnan(getvalue(close,-(a2+1))) and !getvalue(last, -(a2+1))
do min(getvalue(low,-(a2+1)),b2);
c2 = fold a3 = 0 to n
with b3
while !isnan(getvalue(close,-(a3+1))) and !getvalue(last, -(a3+1))
do getvalue(close,-a3);
} else {
o2 = o2[1];
h2 = h2[1];
l2 = l2[1];
c2 = c2[1];
}
# check for 0 or 99999
def o = if o2 == 0 or o2 >= big then o[1] else o2;
def h = if h2 == 0 or h2 >= big then h[1] else h2;
def l = if l2 == 0 or l2 >= big then l[1] else l2;
def c = if c2 == 0 or h2 >= big then c[1] else c2;
def Pivot = (h + l + c)/3;
def R1 = (2 * Pivot) - L;
def R2 = Pivot + (h- l);
def R3 = R1 + (h-l);
def S1 = (2 * Pivot) - h;
def S2 = Pivot - (h - l);
def S3 = S1 - (h - l);
input show_pivot_lines = yes;
plot zp = if show_pivot_lines and b and pivot > 0 then pivot else na;
plot zr1 = if show_pivot_lines and b and r1 > 0 then r1 else na;
plot zr2 = if show_pivot_lines and b and r2 > 0 then r2 else na;
plot zr3 = if show_pivot_lines and b and r3 > 0 then r3 else na;
plot zs1 = if show_pivot_lines and b and s1 > 0 then s1 else na;
plot zs2 = if show_pivot_lines and b and s2 > 0 then s2 else na;
plot zs3 = if show_pivot_lines and b and s3 > 0 then s3 else na;
zr1.SetPaintingStrategy(PaintingStrategy.HORIZONTAL);
zr2.SetPaintingStrategy(PaintingStrategy.HORIZONTAL);
zr3.SetPaintingStrategy(PaintingStrategy.HORIZONTAL);
zp.SetPaintingStrategy(PaintingStrategy.HORIZONTAL);
zs1.SetPaintingStrategy(PaintingStrategy.HORIZONTAL);
zs2.SetPaintingStrategy(PaintingStrategy.HORIZONTAL);
zs3.SetPaintingStrategy(PaintingStrategy.HORIZONTAL);
zr1.SetDefaultColor(Color.red);
zr2.SetDefaultColor(Color.red);
zr3.SetDefaultColor(Color.red);
zp.SetDefaultColor(Color.magenta);
zs1.SetDefaultColor(Color.green);
zs2.SetDefaultColor(Color.green);
zs3.SetDefaultColor(Color.green);
zp.setlineweight(2);
#----------------------
# test stuff
input test1_ohlc_lines = no;
plot z1 = if test1_ohlc_lines and o > 0 then o else na;
plot z2 = if test1_ohlc_lines and h > 0 then h else na;
plot z3 = if test1_ohlc_lines and l > 0 then l else na;
plot z4 = if test1_ohlc_lines and c > 0 then c else na;
z1.SetPaintingStrategy(PaintingStrategy.HORIZONTAL);
z2.SetPaintingStrategy(PaintingStrategy.HORIZONTAL);
z3.SetPaintingStrategy(PaintingStrategy.HORIZONTAL);
z4.SetPaintingStrategy(PaintingStrategy.HORIZONTAL);
z1.SetDefaultColor(Color.cyan);
z2.SetDefaultColor(Color.white);
z3.SetDefaultColor(Color.white);
z4.SetDefaultColor(Color.yellow);
input test2_bubbles = no;
addchartbubble(test2_bubbles , low*0.99,
first + "\n" +
o + "\n" +
h + "\n" +
l + "\n" +
c + "\n"
, (if first then color.green else if last then color.red else color.gray), no);
input test3_firstlast = no;
plot z11 = if test3_firstlast and first then high else na;
z11.SetPaintingStrategy(PaintingStrategy.ARROW_down);
z11.SetDefaultColor(Color.cyan);
z11.setlineweight(3);
z11.hidebubble();
plot z12 = if test3_firstlast and last then low else na;
z12.SetPaintingStrategy(PaintingStrategy.ARROW_UP);
z12.SetDefaultColor(Color.yellow);
z12.setlineweight(3);
z12.hidebubble();
input test4 = no;
addchartbubble(test4, low*0.99,
# SecondsFromTime(start)[1] + "\n" +
SecondsFromTime(start) + "\n" +
first1 + " F1\n" +
first2 + " F2\n" +
first + " F\n" +
last2 + " L2\n" +
last + " L"
#(SecondsFromTime(end)[1] < 0 and SecondsFromTime(end) >= 0) + "\n" +
#last2 + "\n"
, color.yellow, no);
#-----------------------
def ext = if SecondsFromTime(1600) == 0 then 1 else ext[1];
addlabel(ext == 0, "---- EXTENDED HOURS ARE TURNED OFF ----", color.cyan);
#addchartbubble(1, high, four, color.cyan);
#