GandalfProjectResearchSystem Dashboard For ThinkOrSwim

Ramisegal

Active member
Plus
Inspired by the post https://usethinkscript.com/threads/...acktesting-data-utility-for-thinkorswim.1624/


I came up with this solution when I wanted to backtest the indicators combined with other strategies, multiple positions, reentries and risk management..
All strategies combined on the chart with stops and or multiple contracts are calculated and are all in sync with the strategy reports.

The code below is a standalone/decoupled “strategy dashboard”, It seems that a script compiled as a study vs strategy is contained in differently, the key is that it must and should be created as a “Dummy” strategy in TOS, saved and named as your dashboard than add to the chart combined with all other strategies and studies.

View attachment 20387View attachment 20387
Example below: is a predefined strategy in TOS
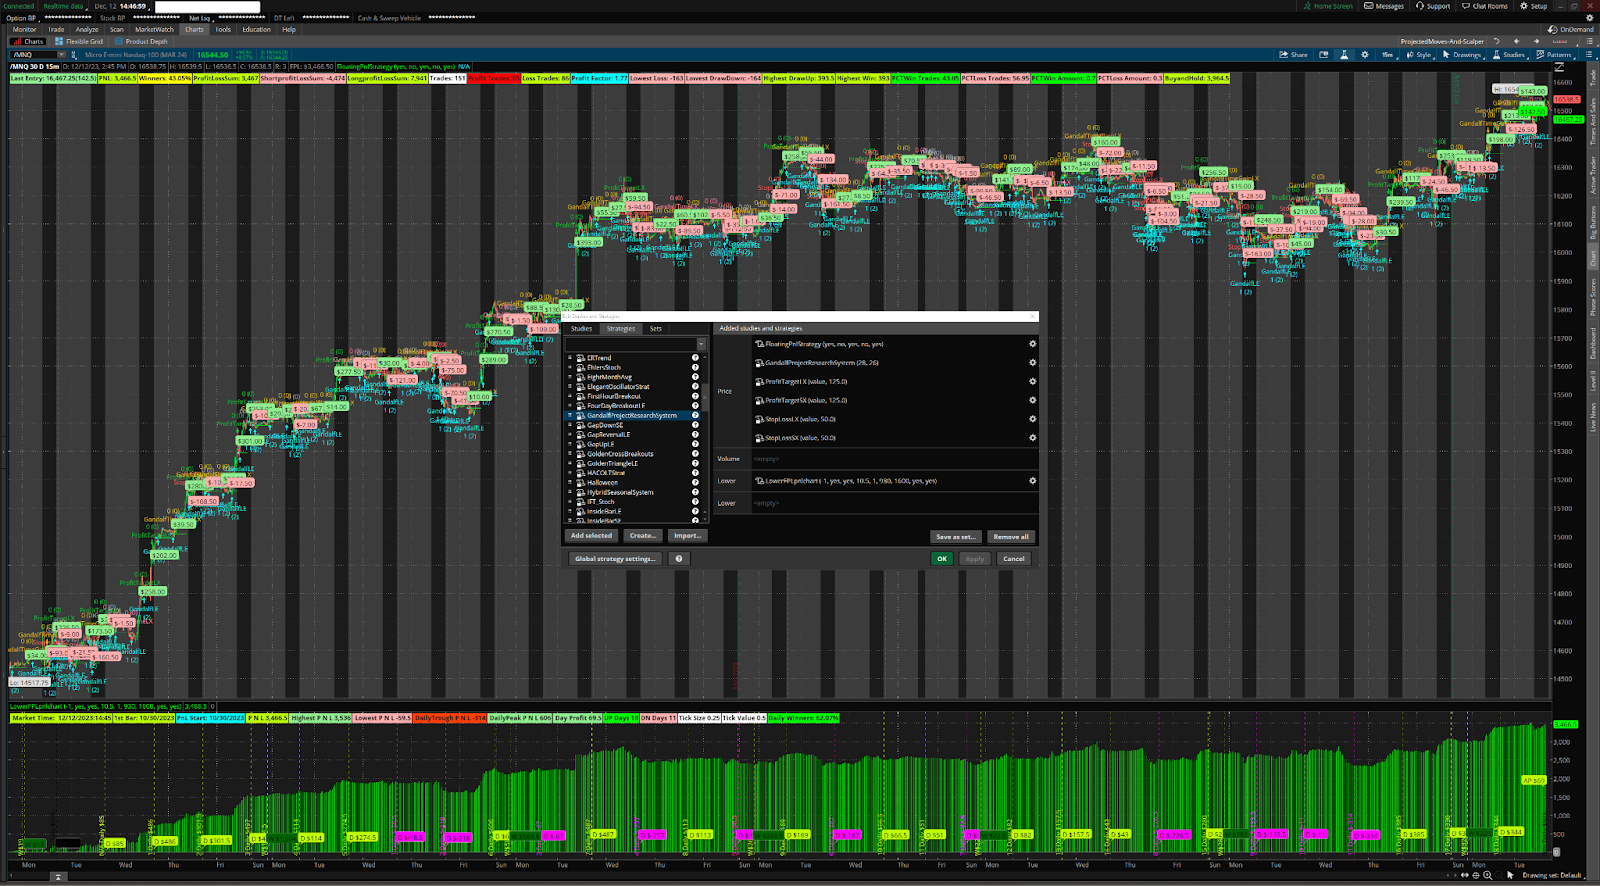
GandalfProjectResearchSystem​


W6_nqDYUhrHtJj9TEYMQCTmhrf_F8l7YogWlfpGn0HCg_c-lnE1WBVZAxNW_w0YKWh8-sdXSYyj45wk7R1pASazoMsJV5laOKlbUNgXQ2owJK_iAkawiFgo6HIrOAiZdmOUyxzd6DGIYi1dzpA1vilU


7leICLhMZ_WZusX042ER-GHH9uoRL7VytM4oNljstHdPxgp2cfvmhtD0VFlKHklzYE-P31Kql37n8WmEdAT_lALhEmp3BcZZa4-vy43S-RvBYWp94Cg22yqzLU6A8ZwLnCnQ9sRdA4ARDxm3V8xKAjA


Paste the script below and save as a strategy: FloatingPnlStrategy or any name...
Python:
#######################################
##  START of Strategies DashBoard
#######################################
addOrder(OrderType.BUY_AUTO, no);

input ShowStrategyCurrentPnlBubble = yes;
input ShowStrategyPnlBubble = no;
input ShowStrategyPnlEntryBubble = yes;
input ShowStrategyPnlVertical = no;
Input ShowStrategyProfitLossLabels = yes;
def fpl = FPL();
def StrategyEntryprice = if IsNaN(EntryPrice())  then 0 else EntryPrice();
def ep = entryprice();
def poschange = ( StrategyEntryprice <> StrategyEntryprice[1] and StrategyEntryprice == 0 ) or (  StrategyEntryprice <> StrategyEntryprice[1] and StrategyEntryprice[1] == 0  )   or (  StrategyEntryprice <> StrategyEntryprice[1] and StrategyEntryprice[1] > 0   and StrategyEntryprice[0] > 0 );
def pnlentry =  if  poschange  then  fpl[1] else pnlentry[1];
def currentprofit = fpl() - pnlentry[1];
def pnlprofit =  if pnlentry <> pnlentry[1] then  fpl()[1] - pnlentry[1] else 0  ;
def entryprofit = (if pnlprofit> 0 then 1 else -1 )  * absValue( if  poschange  then if StrategyEntryprice == 0 then open[0] - ep[1] else ep-ep[1] else 0) ;
def dollarentryprofitloss = Round(((entryprofit ) / TickSize()) * TickValue());

AddChartBubble(ShowStrategyPnlEntryBubble and poschange and absValue(dollarentryprofitloss  )>0, open[0], AsDollars(dollarentryprofitloss[0]), if dollarentryprofitloss[0] > 0 then Color.light_GREEN else if  dollarentryprofitloss[0] < 0 then Color.pink else Color.BLUE);
AddVerticalLine(ShowStrategyPnlVertical and ShowStrategyPnlEntryBubble and poschange, AsDollars(fpl) + " (" + dollarentryprofitloss + ")" ,  if dollarentryprofitloss > 0 then Color.GREEN else if dollarentryprofitloss < 0 then Color.RED else if pnlentry == 0 then Color.WHITE else Color.CYAN);

def fplpnlprofit = pnlprofit;
AddChartBubble(ShowStrategyPnlBubble and poschange[0] and absValue(fplpnlprofit  )>0, open[0], AsDollars(fplpnlprofit[0]), if fplpnlprofit[0] > 0 then Color.GREEN else if  fplpnlprofit[0] < 0 then Color.RED else Color.BLUE);
AddVerticalLine(ShowStrategyPnlVertical and ShowStrategyPnlBubble and poschange, AsDollars(fpl) + " (" + pnlprofit + ")" ,  if pnlprofit > 0 then Color.GREEN else if pnlprofit < 0 then Color.RED else if pnlentry == 0 then Color.WHITE else Color.CYAN);
def lastentry =if isnan( entryprice()) then lastentry[1] else entryprice() ;
AddChartBubble(ShowStrategyCurrentPnlBubble  and !IsNaN(close) and IsNaN(close [-1] ) and HighestAll(BarNumber()) and absValue(currentprofit)> 0, lastentry, AsDollars(currentprofit[0]), if currentprofit[0] > 0 then Color.green else if  currentprofit[0] < 0 then Color.red else Color.BLUE);

def pl = if ShowStrategyPnlEntryBubble then if isnan( dollarentryprofitloss) then 0 else dollarentryprofitloss else if isnan(fplpnlprofit) then 0 else fplpnlprofit;
def StrategyLongprofitLossSum = CompoundValue(1, if BarNumber() == 1 then 0 else if pl > 0 then StrategyLongprofitLossSum[1] + pl[0] else StrategyLongprofitLossSum[1], 0);
def StrategyShortprofitLossSum = CompoundValue(1, if BarNumber() == 1 then 0 else if pl < 0 then StrategyShortprofitLossSum[1] + pl[0] else StrategyShortprofitLossSum[1], 0);
def StrategyProfittradecnt = if  BarNumber() == 1 then 0 else if pl > 0 then StrategyProfittradecnt[1] + 1 else StrategyProfittradecnt[1] ;
def Strategylosstradecnt = if  BarNumber() == 1 then 0 else if pl < 0 then Strategylosstradecnt[1] + 1 else Strategylosstradecnt[1] ;
def Strategytradecnt = StrategyProfittradecnt + Strategylosstradecnt; 

# What percent were winners
def StrategyPCTWin = Round(((StrategyProfittradecnt) / (Strategytradecnt)) * 100, 2) ;
def StrategyPCTLoss = Round(((Strategylosstradecnt) / (Strategytradecnt)) * 100, 2) ;
def StrategyPCTWinamt = Round(((absValue(StrategyLongprofitLossSum/StrategyProfittradecnt)) /absValue( (StrategyLongprofitLossSum/StrategyProfittradecnt) + absValue(StrategyShortprofitLossSum/Strategytradecnt))) * 1, 2) ;
def PCTLossamt =  Round(((absValue(StrategyShortprofitLossSum/Strategylosstradecnt)) /absValue( (StrategyLongprofitLossSum/StrategyProfittradecnt) + absValue(StrategyShortprofitLossSum/Strategytradecnt))) * 1, 2) ;
plot PltEntryPrice = ep;
PltEntryPrice.SetPaintingStrategy(PaintingStrategy.DASHES);
PltEntryPrice.SetdefaultColor(color.cyan);
PltEntryPrice.assignValueColor(if currentprofit then color.green else 
if entryprofit < 0 then color.red else color.cyan );


def Strategylowestdrawdown =  min(if isnan(currentprofit) then 0 else currentprofit,Strategylowestdrawdown[1]);
def StrategyHigestdrawUp =  max(if isnan(currentprofit) then 0 else currentprofit,StrategyHigestdrawUp[1]);
def Strategylowestloss = min(pl,Strategylowestloss[1]);
def highestwin = max(pl,highestwin[1]);
AddLabel(ShowStrategyProfitLossLabels ,  "Last Entry: "+lastentry +"("+currentprofit +")" ,if currentprofit > 0 then color.light_green else if currentprofit < 0 then color.light_red else color.cyan );
AddLabel(ShowStrategyProfitLossLabels, "PNL: " + (FPL()), if FPL() > 0 then Color.LIME else Color.RED);
AddLabel(ShowStrategyProfitLossLabels, "Winners: " + StrategyPCTWin + "%", if StrategyPCTWin > 50 then Color.GREEN else if StrategyPCTWin > 40 then Color.YELLOW else Color.GRAY);
AddLabel(ShowStrategyProfitLossLabels, "ProfitLossSum: " + (StrategyLongprofitLossSum + StrategyShortprofitLossSum), if (StrategyLongprofitLossSum + StrategyShortprofitLossSum) > 0 then Color.LIME else Color.RED);
AddLabel(ShowStrategyProfitLossLabels, "StrategyShortprofitLossSum: " + (StrategyShortprofitLossSum), Color.pink);
AddLabel(ShowStrategyProfitLossLabels, "StrategyLongprofitLossSum: " + (StrategyLongprofitLossSum), Color.LIME);
AddLabel(ShowStrategyProfitLossLabels, "Trades: " + (Strategytradecnt), Color.WHITE);
AddLabel(ShowStrategyProfitLossLabels, "Profit Trades: " + (StrategyProfittradecnt), if StrategyProfittradecnt > Strategylosstradecnt then Color.LIME else Color.RED);
AddLabel(ShowStrategyProfitLossLabels, "Loss Trades: " + (Strategylosstradecnt), if StrategyProfittradecnt < Strategylosstradecnt then Color.LIME else Color.pink);
AddLabel(ShowStrategyProfitLossLabels, "Profit Factor: " +round(absvalue (StrategyLongprofitLossSum/StrategyShortprofitLossSum)),color.cyan);
AddLabel(ShowStrategyProfitLossLabels, "Lowest Loss: " + (Strategylowestloss), Color.pink);
AddLabel(ShowStrategyProfitLossLabels, "Lowest DrawDown: " + (Strategylowestdrawdown), Color.pink);
AddLabel(ShowStrategyProfitLossLabels, "Highest DrawUp: " + (StrategyHigestdrawUp), Color.LIME);
AddLabel(ShowStrategyProfitLossLabels, "Highest Win: " + (highestwin), Color.LIME);
AddLabel(ShowStrategyProfitLossLabels, "StrategyPCTWin Trades: " + (StrategyPCTWin), Color.GREEN);
AddLabel(ShowStrategyProfitLossLabels, "StrategyPCTLoss Trades: " + (StrategyPCTLoss), Color.PINK);
AddLabel(ShowStrategyProfitLossLabels, "StrategyPCTWin Amount: " + (StrategyPCTWinamt), Color.GREEN);
AddLabel(ShowStrategyProfitLossLabels, "StrategyPCTLoss Amount: " + (PCTLossamt), Color.PINK);

def firstentry = if Strategytradecnt ==1 then close[1] else firstentry[1];
def buyandhold = Round(((close - firstentry ) / TickSize()) * TickValue());
AddLabel(ShowStrategyProfitLossLabels, "BuyandHold: " + (buyandhold), if buyandhold > 0 then Color.LIME else Color.RED);


#######################################
##  END of Strategy DashBoard
#######################################
#endofcode


The Lower study dashboard is an extended P&L with daily and weekly subtotals and also to monitor the progress of the computation stream by checking the total up and down days vs the number of days selected for the chart. Sometimes TOS performance is so slow it seems it's compiling on a 286


5rYrR7PP0lMQKciocP2Ow7Q5rA4NmEjPx87falalUIWlAIJwNGelBvFvSb6iEwhWeJ3XY7qP4TTUZL25HkAMNN_UD32CIheVS3T87W8Id1swelVQwNXWaFdcMwhus5IoIJIPCavAAu7fBUtxSEYv3Ug

Paste the script below and save as a study: LowerFPLpnlchart
Python:
declare lower;
input Offset = -1;
def LastBar = !IsNaN(open) and IsNaN(open [-1] ) ;
def lastBubbleLocation = LastBar[Offset];
input ShowTime = no;
input ShowFromDate = no;
input TimeZone = 10.5;
def Hours = Floor(TimeZone + SecondsFromTime(0930) / 60 / 60) - 1;
def Minutes = ((TimeZone + SecondsFromTime(930) / 60 / 60) % 1) * 60;
AddLabel(ShowTime, " Market Time:  " + GetMonth() + "/" +  GetDayOfMonth(GetYYYYMMDD()) + "/"  + (AsPrice(GetYear()))  + ":" + Hours + ":" + Minutes ,
             if !IsNaN(GetTime())
             then Color.LIME
             else if IsNaN(GetTime())
                  then Color.PINK
                  else Color.WHITE);
# Defines the hours from last bar till end-of-day (midnight) on an intra-day chart
input time = 0001;# Is midnight which is the start of counting seconds in the functions below.
def TimeFrom = SecondsFromTime(time);# Returns the seconds from 'time'. If not an intra-day chart, returns 0.

def TimeLeft = SecondsTillTime(time);# Returns the seconds till input 'time'. If not an intra-day chart, returns 0.

#AddLabel(1, "Time from last bar till end-of-day (midnight) = " + (Round( (24 + (TimeLeft / 3600)), 1)) + " Hours", Color.WHITE);
def startdate = if   TOTALSUM(FPL()) <>  0 == 0 and TOTALSUM(FPL())[1]== 0 then 1 else 0;;
def startmonth = if startdate then GetMonth() else startmonth[1];
def startday = if startdate then GetDayOfMonth(GetYYYYMMDD()) else startday[1];
def startyear = if startdate then GetYear() else startyear[1];
def from_dayofmonth = if BarNumber() == 1 then GetDayOfMonth(GetYYYYMMDD()) else from_dayofmonth[1];
def from_month = if BarNumber() == 1 then GetMonth() else from_month[1];
def from_year  = if BarNumber() == 1 then GetYear() else from_year[1];
AddLabel(ShowFromDate, "1st Bar: " + from_month  + "/" + from_dayofmonth + "/"  + (AsPrice(from_year)),
             if !IsNaN(GetTime())
             then Color.LIME
             else if IsNaN(GetTime())
                  then Color.PINK
                  else Color.WHITE);
AddLabel(ShowFromDate, "PnL Start: " +asprice(startmonth) +"/" +asprice(startday) +"/" +asprice(startyear)  , color.cyan);
plot FPL = FPL();
plot ZeroLine = 0;
FPL.SetPaintingStrategy(PaintingStrategy.SQUARED_HISTOGRAM);
FPL.DefineColor("Positive and Up", Color.GREEN);
FPL.DefineColor("Positive and Down", Color.DARK_GREEN);
FPL.DefineColor("Negative and Down", Color.RED);
FPL.DefineColor("Negative and Up", Color.DARK_RED);
FPL.AssignValueColor(if FPL >= 0 then if FPL > FPL[1] then FPL.Color("Positive and Up") else FPL.Color("Positive and Down") else if FPL < FPL[1] then FPL.Color("Negative and Down") else FPL.Color("Negative and Up"));
ZeroLine.SetDefaultColor(Color.GRAY);
input TradeTimeStart = 0930;
input TradeTimeEnd = 1600;
input UseMarketTime = yes;
#################################################################################
##################################################################################
##################################################################################
def Active = if UseMarketTime then if SecondsTillTime(TradeTimeStart) <= 0 and
                           SecondsTillTime(TradeTimeEnd) >= 0  then 1 else 0
                    else if GetAggregationPeriod() == AggregationPeriod.DAY then 1 else 0;
##################################################################################
input showverticalprofits = yes;
def weeklybalance  =  if GetWeek()[1] != GetWeek() and GetLastWeek() != GetWeek()[1] then FPL() else weeklybalance[1] ;
def weeklyprofit = if GetWeek()[1] != GetWeek() and  GetLastWeek() != GetWeek()[1] then FPL() - weeklybalance[1] else weeklyprofit[1];
AddVerticalLine(showverticalprofits  and  GetWeek()[1] <> GetWeek() and GetLastWeek() != GetWeek()[1], "W$" + weeklyprofit , if weeklyprofit > 0 then Color.LIME else if weeklyprofit < 0 then Color.MAGENTA else Color.WHITE);
def dailybalance = if GetAggregationPeriod() < AggregationPeriod.DAY and Active[1] and !Active[0] then FPL() else if GetAggregationPeriod() == AggregationPeriod.DAY and GetDay() <> GetDay()[1] then FPL() else  dailybalance[1];
def dailyprofit = if Active[1] and !Active[0] and GetAggregationPeriod() < AggregationPeriod.DAY  then dailybalance - dailybalance[1] else if GetAggregationPeriod() == AggregationPeriod.DAY and GetDay() <> GetDay()[1]  then FPL() - FPL()[1] else   dailyprofit[1];
def activeprofit = if GetDay() == GetLastDay()  then FPL() - dailybalance[1] else activeprofit[1] ;
AddChartBubble(showverticalprofits and  GetAggregationPeriod() < AggregationPeriod.DAY  and Active[1] and !Active[0] , FPL() / 10, "D $" + dailyprofit  , if dailyprofit > 0 then Color.LIME else if dailyprofit < 0 then Color.MAGENTA else Color.WHITE, yes);
AddChartBubble(showverticalprofits and  GetAggregationPeriod() < AggregationPeriod.week and GetWeek()[1] != GetWeek() and GetLastWeek() != GetWeek()[1], FPL() / 10, "W $" + weeklyprofit  , if weeklyprofit > 0 then Color.dark_green else if weeklyprofit < 0 then Color.dark_red else Color.WHITE, yes);
AddChartBubble(showverticalprofits and lastBubbleLocation and  GetAggregationPeriod() == AggregationPeriod.DAY   , FPL() / 10, "Active D $" + activeprofit  , if activeprofit > 0 then Color.LIME else if activeprofit < 0 then Color.MAGENTA else Color.WHITE, yes);
AddChartBubble(showverticalprofits and  lastBubbleLocation and GetAggregationPeriod() < AggregationPeriod.DAY  , FPL() / 2, "AP $" + activeprofit  , if activeprofit > 0 then Color.LIME else if activeprofit < 0 then Color.MAGENTA else Color.WHITE, yes);
AddLabel(1, " P N L " + Round( FPL()) , if FPL() > 0 then  Color.lime else if FPL() < 0 then Color.magenta else Color.WHITE) ;
AddLabel(1, " Highest P N L " + Round( HighestAll(FPL())) , if HighestAll(FPL()) > 0 then  Color.light_GREEN else if HighestAll(FPL()) < 0 then Color.pink else Color.WHITE) ;
AddLabel(1, " Lowest P N L " + Round( LowestAll(FPL())) , if LowestAll(FPL()) > 0 then  Color.light_GREEN else if LowestAll(FPL()) < 0 then Color.pink else Color.WHITE) ;
AddLabel(1, " DailyTrough P N L " + Round( LowestAll(dailyprofit)) , if LowestAll(dailyprofit) > 0 then  Color.light_GREEN else if LowestAll(dailyprofit) < 0 then Color.light_RED else Color.WHITE) ;
AddLabel(1, " DailyPeak P N L " + Round( HighestAll(dailyprofit)) , if HighestAll(dailyprofit) > 0 then  Color.light_GREEN else if HighestAll(dailyprofit) < 0 then Color.light_RED else Color.WHITE) ;
AddLabel(1, " Day Profit " + activeprofit, if activeprofit > 0 then Color.light_GREEN else if activeprofit < 0 then Color.pink else Color.WHITE);
def dayupdays = if dailyprofit > 0 and GetDay()[1] != GetDay() and  GetLastDay() != GetDay()[1] and GetAggregationPeriod() == AggregationPeriod.DAY  then dayupdays[1] + 1 else if IsNaN(dayupdays[1]) then 0 else dayupdays[1] ;
def daydndays = if dailyprofit < 0 and GetDay()[1] != GetDay() and  GetLastDay() != GetDay()[1] and GetAggregationPeriod() == AggregationPeriod.DAY  then  daydndays[1] + 1 else if IsNaN(daydndays[1]) then 0 else daydndays[1];
def dp = dailyprofit;
def updays = if dp > 0 and Active[1] and !Active[0] and GetAggregationPeriod() < AggregationPeriod.DAY  then updays[1] + 1 else if IsNaN(updays[1]) then 0 else updays[1] ;
def dndays = if dp < 0 and Active[1] and !Active[0] and GetAggregationPeriod() < AggregationPeriod.DAY  then  dndays[1] + 1 else if IsNaN(dndays[1]) then 0 else dndays[1];
def updndays =  if dailyprofit > 0 then (updays) else if dailyprofit < 0 then (dndays) else 0;
AddVerticalLine(showverticalprofits and Active[1] and !Active[0] and GetAggregationPeriod() < AggregationPeriod.DAY , updndays +" Daily $" + (dailyprofit) , if dailyprofit > 0 then Color.LIME else if dailyprofit < 0 then Color.MAGENTA else Color.WHITE);
AddLabel(GetAggregationPeriod() < AggregationPeriod.DAY, "UP Days " + updays, if updays  > 0 then  Color.GREEN  else Color.WHITE) ;
AddLabel(GetAggregationPeriod() < AggregationPeriod.DAY, "DN Days " + dndays, if dndays  > 0 then  Color.PINK  else Color.WHITE) ;
AddLabel(GetAggregationPeriod() == AggregationPeriod.DAY, "UP Days " + dayupdays, Color.LIME);
AddLabel(GetAggregationPeriod() == AggregationPeriod.DAY, "DN Days " + daydndays, Color.MAGENTA);
AddLabel(1, "Tick Size " + TickSize(), Color.WHITE);
AddLabel(1, "Tick Value " + TickValue(), Color.WHITE);
def PCTWin = if GetAggregationPeriod() < AggregationPeriod.DAY then Round((updays / (updays + dndays)) * 100, 2) else Round((dayupdays / (dayupdays + daydndays)) * 100, 2);
AddLabel(GetAggregationPeriod() <= AggregationPeriod.DAY, "Daily Winners: " + PCTWin + "%", if PCTWin > 50 then Color.GREEN else if PCTWin > 40 then Color.YELLOW else Color.GRAY);
###endofcode

Example of a random selection TOS pre defined strategy (combine as many strategies to all be calculated together in the dashboard)

evcIgIZcH3zQon_QaRXCDDfZQpP9FChj5wWF6kZOY_f37dP7Yf_xH6IRjnEuwmO2oebQl7mXmDhekTOZEPySYkk20_sr8SpMnaFXPInrEtbHdYVpIRRxg_JhxqpEQHdsA3XjabCKt9doEAZCzGrQebI


This tool helped me develop my strategies. I debugged it over time. Let me know if you find any issues.
 
Last edited:
Gandalf Filtered SuperTrend Range strategy.

This is an adapted version of The Gandalf Project Research System strategy that was discussed by Domenico D’Errico and Giovanni Trombetta in “System Development Using Artificial Intelligence.
Grid Setup
http://tos.mx/Bln0quz

Gandalf Strategy is a long-only strategy, meaning it is designed to profit from rising prices.
I have optimized this strategy to work on NQ and ES futures combined with a modified version of the supertrend indicator.
The Superttrend indicator was modified to use an ATR based on the highest high, lowest low and average of the highest close plus the lowest close for a given number of periods.
A momentum filter to limit trade frequency with 3 options.
When the trend direction is down new lows are registered based on the momentum filter setting:
Swing: close below the recent registered low
Scalp: Low below the recent registered low
Hold: High below the recent registered low

Entry Signal Pattern:

  • A simulated buy to open order is added if either all of the following is true:
  • Supertrend momentum filter did not register a new low
  • No Gandalf exit signal pattern (described below)
  • The previous ohlc4 is less than the previous median price.
  • The median price from 2 bars ago is less than or equal to the previous ohlc4.
  • The median price from 2 bars ago is less than or equal to the ohlc4 from 3 bars ago.
  • OR if all of the following is true:
  • The previous ohlc4 is less than the median price from 3 bars ago.
  • The current mid-body price is less than the median price from 2 bars ago.
  • The previous mid-body price is less than the mid-body price from 2 bars ago.
Exit Signal Pattern:

  • Trend is down and new lows are registered by the momentum filter
  • The previous ohlc4 is less than the previous mid-body price.
  • The median price from 2 bars ago equals to the mid-body price from 3 bars ago.
  • The previous mid-body price is less than or equal to the mid-body price from 4 bars ago.
OR if all of the following:

  • The ohlc4 from 2 bars ago is less than the current mid-body price.
  • The median price from 4 bars ago is less than the ohlc4 from 3 bars ago.
  • The previous mid-body price is less than the previous ohlc4.


Gandalf Patterns:
def averagePrice = ohlc4;
def medianPrice = hl2;
def medianBodyPrice = MidBodyVal();

def entryGandaldfPattern = (averagePrice[1] < medianPrice[1] and
medianPrice[2] <= averagePrice[1] and
medianBodyPrice[2] <= averagePrice[3]) or
(averagePrice[1] < medianPrice[3] and
medianBodyPrice < medianPrice[2] and
medianBodyPrice[1] < medianBodyPrice[2]);

def exitGandalfPattern = (averagePrice[1] < medianBodyPrice[1] and
medianPrice[2] == medianBodyPrice[3] and
medianBodyPrice[1] <= medianBodyPrice[4]) or
(averagePrice[2] < medianBodyPrice and
medianPrice[4] <= averagePrice[3] and
medianBodyPrice[1] <= averagePrice[1]);


Gandalf Filtered SuperTrend Range strategy. (save as a strategy)

To use as a study find the following in the script : (## Remove below and save as a study)
study can be used as an upper or lower in the option settings

LowerGwiZTRStrategy

Code:
input EnableStrategy = yes;
input UseMarketTime = no; #hint UseMarketTime: Use Trading hours?
input TradeTimeStart = 0930;
input TradeTimeEnd = 1555;
input UseTradeOffTradeTime = no;
input UseMarketTradeTimeToExitPositions = no; #hint UseMarketTradeTimeToExitPositions: Exit/Close open trades based on the market hours selected
input UseDateRange = no; #hint UseDateRange: Trade Signals within the date range specified
input ActiveStartDate = 20230101;
input ActiveEndDate = 20240101;

def activedaterange = GetYYYYMMDD() >= ActiveStartDate and GetYYYYMMDD() <= ActiveEndDate;
def activerange = if UseDateRange then  activedaterange else 1;
AddLabel(UseDateRange, if activerange then "Range " + AsPrice(ActiveStartDate) + " - " + AsPrice(ActiveEndDate) else ""  , Color.WHITE );

def Active = if GetDay() != GetDay()[1]
          then 0
          else if SecondsTillTime(TradeTimeStart) <= 0 and
                  SecondsTillTime(TradeTimeEnd) >= 0
            then 1
            else 0;

def ActiveTradeTime = if UseTradeOffTradeTime then !Active else if UseMarketTime then if SecondsTillTime(TradeTimeStart) <= 0 and
                           SecondsTillTime(TradeTimeEnd) >= 0  then 1 else 0
                    else 1;
def closeallmarket =   ( if UseMarketTime and UseTradeOffTradeTime then Active and !Active[1] and UseMarketTradeTimeToExitPositions else  !ActiveTradeTime and ActiveTradeTime[1])  and UseMarketTradeTimeToExitPositions;

input ShowTime = yes;

input TimeZone = 10.5;
def Hours = Floor(TimeZone + SecondsFromTime(0930) / 60 / 60) - 1;
def Minutes = ((TimeZone + SecondsFromTime(930) / 60 / 60) % 1) * 60;

AddLabel(ShowTime, "MarketStructure Market Time:  " + GetMonth() + "/" +  GetDayOfMonth(GetYYYYMMDD()) + "/"  + (AsPrice(GetYear()))  + ":" + Hours + ":" + Minutes ,
             if !IsNaN(GetTime())
             then Color.LIME
             else if IsNaN(GetTime())
                  then Color.PINK
                  else Color.WHITE);

input uselower = no;


input ShowLabels = yes;
input sourcehigh = high;
input sourcelow = low;
input sourceclose = close;
input nATR = 5;
input ATRMult = .7;
input tmV = 3;
input AvgType = AverageType.SIMPLE;


AddLabel(1, "LowerGwiZTRStrategy: TF: " + GetAggregationPeriod() / 60000, Color.WHITE);

def h = Highest(sourcehigh, tmV);
def l = Lowest(sourcelow, tmV);
def c = (Highest(sourceclose, tmV) + Lowest(sourceclose, tmV)) / 2;

def ATR = MovingAverage(AvgType, TrueRange(h, c, l), nATR);
def UP = c + (ATRMult * ATR);
def DN = c + (-ATRMult * ATR);

def priceclose = c;
def lowestup = if UP <= lowestup[1] then UP[0] else if priceclose < lowestup[1] and priceclose < UP[0] then lowestup[1] else UP[0];
def highestdn = if DN >= highestdn[1] then DN[0] else if priceclose > highestdn[1] and priceclose > DN[0]  then highestdn[1] else DN[0];

def trend = if  priceclose[0] crosses below highestdn[1] then -1 else if  priceclose[0] crosses above lowestup[1]  then 1 else trend[1];

def sellmodeprice =  if  priceclose[0] crosses below highestdn[1] and trend[1] > 0 then highestdn[1] else sellmodeprice[1];
def buymodeprice =  if  priceclose[0] crosses above lowestup[1] and   trend[1] < 0 then lowestup[1] else buymodeprice[1];

plot sellcrossprice = if trend <> 0  then  sellmodeprice else Double.NaN;
plot buycrossprice = if trend <> 0  then  buymodeprice   else Double.NaN;

sellcrossprice.SetPaintingStrategy(PaintingStrategy.HORIZONTAL);
buycrossprice.SetPaintingStrategy(PaintingStrategy.HORIZONTAL);

buycrossprice.SetDefaultColor(  Color.LIGHT_GREEN);
sellcrossprice.SetDefaultColor ( Color.PINK);

buycrossprice.AssignValueColor(if close > buycrossprice then Color.GREEN else Color.LIGHT_GREEN);
sellcrossprice.AssignValueColor(if close < sellcrossprice then Color.RED else  Color.PINK);

sellcrossprice.SetStyle(Curve.FIRM );
sellcrossprice.SetLineWeight(1);

buycrossprice.SetStyle(Curve.FIRM );
buycrossprice.SetLineWeight(1);


plot sell =  if  trend < 0 then lowestup[0] else Double.NaN ;
plot buy = if  trend > 0  then highestdn[0] else Double.NaN ;


sell.SetPaintingStrategy(if uselower then PaintingStrategy.HISTOGRAM else PaintingStrategy.LINE);
buy.SetPaintingStrategy(if uselower then PaintingStrategy.HISTOGRAM else PaintingStrategy.LINE);

sell.SetDefaultColor(  Color.MAGENTA );
buy.SetDefaultColor( Color.LIME );

def barUp = trend > 0 ;
def barDown = trend < 0 ;
def barUpCount = CompoundValue(1, if barUp then (if IsNaN(barUpCount[1]) then 0 else barUpCount[1]) + 1 else 0, 0);
def barDownCount = CompoundValue(1, if barDown then ( if IsNaN( barDownCount[1]) then 0 else barDownCount[1] ) - 1 else 0, 0);
def trendcnt = barDownCount + barUpCount ;

AddLabel(ShowLabels, "Trendind Bars " + (trendcnt) ,  if trend > 0  then Color.LIME else  Color.MAGENTA );

input AssignPriceColorByCurrentTrend = no;
AssignPriceColor( if trend > 0  and AssignPriceColorByCurrentTrend then Color.LIME else  if trend < 0 and AssignPriceColorByCurrentTrend then Color.MAGENTA else Color.CURRENT);

input UseMomentumFilter = yes;
input TradeFrequecy= {Default "Hold", "Swing", "Scalp"};
def tf;
Switch (TradeFrequecy) {
Case "Swing":
tf = 3;
Case "Scalp":
tf = 2;
Case "Hold":
tf = 1;
}

AddLabel(UseMomentumFilter, "Momentum Filter: " + TradeFrequecy,  color.white);

def otf_trendlowestlow;
def otf_trendhighesthigh;

if trend < 0
then
{
    otf_trendlowestlow = if trend == trend[1] then if (if UseMomentumFilter then (if tf==3 then close else if tf==2 then  low else if tf==1 then high else low) else low) < otf_trendlowestlow[1] then low else otf_trendlowestlow[1] else low[1];
    otf_trendhighesthigh =  otf_trendhighesthigh[1];
}
else
if trend > 0
then
{
    otf_trendlowestlow = otf_trendlowestlow[1];
    otf_trendhighesthigh = if trend == trend[1] then if (if UseMomentumFilter then  (if tf==3 then close else if tf==2 then  high else if tf==1 then low else high) else high) > otf_trendhighesthigh[1] then high else otf_trendhighesthigh[1] else high[1];
}
else
{
    otf_trendlowestlow = otf_trendlowestlow[1];
    otf_trendhighesthigh = otf_trendhighesthigh[1];
}

def max1h = Max( otf_trendhighesthigh, sellcrossprice );
def min1h = Min( otf_trendhighesthigh, sellcrossprice ) ;
def max1l = Max(  otf_trendlowestlow, buycrossprice  ) ;
def min1l = Min(  otf_trendlowestlow, buycrossprice  ) ;
#################################
input ShowOrderBlockCloud = yes;
#################################
AddCloud(if ShowOrderBlockCloud and trendcnt < 0    then min1h  else   Double.NaN , max1h, Color.RED );
AddCloud(if ShowOrderBlockCloud and trendcnt > 0   then max1l  else   Double.NaN , min1l, Color.GREEN    );

def sellLight =  otf_trendlowestlow < otf_trendlowestlow[1];
def averagePrice = ohlc4;
def medianPrice = hl2;
def medianBodyPrice = MidBodyVal();

def entryGandaldfPattern = (averagePrice[1] < medianPrice[1] and
    medianPrice[2] <= averagePrice[1] and
    medianBodyPrice[2] <= averagePrice[3]) or
    (averagePrice[1] < medianPrice[3] and
    medianBodyPrice < medianPrice[2] and
    medianBodyPrice[1] < medianBodyPrice[2]);

def exitGandalfPattern = (averagePrice[1] < medianBodyPrice[1] and
    medianPrice[2] == medianBodyPrice[3] and
    medianBodyPrice[1] <= medianBodyPrice[4]) or
    (averagePrice[2] < medianBodyPrice and
    medianPrice[4] <= averagePrice[3] and
    medianBodyPrice[1] <= averagePrice[1]);

def rs_buy = (entryGandaldfPattern and !(( sellLight  ) or (exitGandalfPattern and !entryGandaldfPattern))) ;
def rs_sell = ( sellLight  ) and (exitGandalfPattern or !entryGandaldfPattern);

def dir = if rs_buy and rs_buy <> rs_buy[1] and rs_sell[1] then 1 else if  rs_sell and rs_sell <> rs_sell[1] and rs_buy[1]  then -1  else dir[1];

def showVerticalDirectionlSignals = yes;
AddVerticalLine(showVerticalDirectionlSignals and dir <> dir and dir > 0 , "B", Color.GREEN);
AddVerticalLine(showVerticalDirectionlSignals and dir <> dir[1] and dir < 0, "S", Color.RED);


input trade_odds_Labels = yes;
input useAlerts = no;
input showSignals = yes;
input showBubbles = yes;
input useStops = yes;

def BuySignal = rs_buy; # insert condition to create long position
def SellSignal = rs_sell; # insert condition to create short position
def BuyStop  = closeAllmarket ; # insert condition to stop in place of the 0 after else
def SellStop = closeAllmarket ; # insert condition to stop in place of the 0 after else


#######################################
##  Maintain the position of trades
#######################################

def CurrentPosition;  # holds whether flat = 0 long = 1 short = -1

if (BarNumber() == 1) or IsNaN(CurrentPosition[1]) {
    CurrentPosition = 0;
} else {
    if CurrentPosition[1] == 0 {            # FLAT
        if (BuySignal) {
            CurrentPosition = 1;
        } else if (SellSignal) {
            CurrentPosition = -1;
        } else {
            CurrentPosition = CurrentPosition[1];
        }
    } else if CurrentPosition[1] == 1 {      # LONG
        if (SellSignal) {
            CurrentPosition = -1;
        } else if (BuyStop) {
            CurrentPosition = 0;
        } else {
            CurrentPosition = CurrentPosition[1];
        }
    } else if CurrentPosition[1] == -1 {     # SHORT
        if (BuySignal) {
            CurrentPosition = 1;
        } else if (SellStop) {
            CurrentPosition = 0;
        } else {
            CurrentPosition = CurrentPosition[1];
        }
    } else {
        CurrentPosition = CurrentPosition[1];
    }
}

def isLong  = if CurrentPosition == 1 then 1 else 0;
def isShort = if CurrentPosition == -1 then 1 else 0;
def isFlat  = if CurrentPosition == 0 then 1 else 0;

# If not already long and get a BuySignal
plot BuySig = if (!isLong[1] and BuySignal and showSignals) then 1 else 0;
BuySig.AssignValueColor(Color.CYAN);
BuySig.SetPaintingStrategy(PaintingStrategy.BOOLEAN_ARROW_UP);
BuySig.SetLineWeight(5);

Alert(BuySig and useAlerts, "Buy Signal", Alert.BAR, Sound.Ding);

# If not already short and get a SellSignal
plot SellSig = if (!isShort[1] and SellSignal and showSignals) then 1 else 0;
SellSig.AssignValueColor(Color.CYAN);
SellSig.SetPaintingStrategy(PaintingStrategy.BOOLEAN_ARROW_DOWN);
SellSig.SetLineWeight(5);

Alert(SellSig and useAlerts, "Sell Signal", Alert.BAR, Sound.Ding);

# If long and get a BuyStop
plot BuyStpSig = if (BuyStop and isLong[1] and showSignals and useStops) then 1 else 0;
BuyStpSig.AssignValueColor(Color.LIGHT_GRAY);
BuyStpSig.SetPaintingStrategy(PaintingStrategy.BOOLEAN_ARROW_DOWN);
BuyStpSig.SetLineWeight(3);

# If short and get a SellStop
plot SellStpSig = if (SellStop and isShort[1] and showSignals and useStops) then 1 else 0;
SellStpSig.AssignValueColor(Color.LIGHT_GRAY);
SellStpSig.SetPaintingStrategy(PaintingStrategy.BOOLEAN_ARROW_UP);
SellStpSig.SetLineWeight(3);
#######################################
## Orders
#######################################

def isOrder = if CurrentPosition == CurrentPosition[1] then 0 else 1; # Position changed so it's a new order

# If there is an order, then the price is the next days close
def orderPrice = if (isOrder and (BuySignal or SellSignal)) then close else orderPrice[1];


def prevpricelevel = if orderPrice <> orderPrice[1] then orderPrice[1] else prevpricelevel[1];

plot OrderEntry = orderPrice;
OrderEntry.SetPaintingStrategy(PaintingStrategy.DASHES);
OrderEntry.SetDefaultColor(Color.CYAN);


input showverticalsignals = yes;

AddVerticalLine(showverticalsignals and orderPrice <> orderPrice[1], if isFlat then "Flat" else if isShort then "short" else if isLong then "Long" else "",
if isFlat then Color.CYAN else if isShort then Color.MAGENTA else if isLong then Color.LIME else Color.WHITE);


plot closeprice = if uselower then close else double.nan;

closeprice.SetDefaultColor(Color.WHITE);
closeprice.AssignValueColor(if isFlat then Color.CYAN else if isShort then Color.MAGENTA else if isLong then Color.LIME else Color.WHITE) ;


#######################################
## Price and Profit
#######################################

def profitLoss;

if (!isOrder or orderPrice[1] == 0) {
    profitLoss = 0;
} else if ((isOrder and isLong[1]) and ((!isShort[1] and SellSignal) or (BuyStop and isLong[1] ))) {
    profitLoss = close - orderPrice[1];
} else if ((isOrder and isShort[1]) and ((!isLong[1] and BuySignal) or ( SellStop and isShort[1] ))) {
    profitLoss = orderPrice[1] - close;
} else {
    profitLoss = 0;
}

# Total Profit or Loss
def profitLossSum = CompoundValue(1, if IsNaN(isOrder) or BarNumber() == 1 then 0 else if isOrder then profitLossSum[1] + profitLoss else profitLossSum[1], 0);

# How many trades won or lost
def profitWinners = CompoundValue(1, if IsNaN(profitWinners[1]) or BarNumber() == 1 then 0 else if isOrder and profitLoss > 0 then profitWinners[1] + 1 else profitWinners[1], 0);
def profitLosers = CompoundValue(1, if IsNaN(profitLosers[1]) or BarNumber() == 1 then 0 else if isOrder and profitLoss < 0 then profitLosers[1] + 1 else profitLosers[1], 0);
def profitPush = CompoundValue(1, if IsNaN(profitPush[1]) or BarNumber() == 1 then 0 else if isOrder and profitLoss == 0 then profitPush[1] + 1 else profitPush[1], 0);

def orderCount = (profitWinners + profitLosers + profitPush) - 1;

# Current Open Trade Profit or Loss
def TradePL = if isLong then Round(((close - orderPrice) / TickSize()) * TickValue()) else if isShort then Round(((orderPrice - close) / TickSize()) * TickValue()) else 0;

#########################
#########################
# Math
#########################
#########################
# Convert to actual dollars based on Tick Value for bubbles
def dollarProfitLoss = if orderPrice[1] == 0 or IsNaN(orderPrice[1]) then 0 else Round((profitLoss / TickSize()) * TickValue());

# Closed Orders dollar P/L
def dollarPLSum = Round((profitLossSum / TickSize()) * TickValue())  ;

# Split profits or losses by long and short trades
def profitLong = CompoundValue(1, if IsNaN(profitLong[1]) or BarNumber() == 1 then 0 else if isOrder and isLong[1] then profitLong[1] + dollarProfitLoss else profitLong[1], 0);
def profitShort = CompoundValue(1, if IsNaN(profitShort[1]) or BarNumber() == 1 then 0 else if isOrder and isShort[1] then profitShort[1] + dollarProfitLoss else profitShort[1], 0);
def countLong = CompoundValue(1, if IsNaN(countLong[1]) or BarNumber() == 1 then 0 else if isOrder and isLong[1] then countLong[1] + 1 else countLong[1], 0);
def countShort = CompoundValue(1, if IsNaN(countShort[1]) or BarNumber() == 1 then 0 else if isOrder and isShort[1] then countShort[1] + 1 else countShort[1], 0);

# What was the biggest winning and losing trade
def biggestWin = CompoundValue(1, if IsNaN(biggestWin[1]) or BarNumber() == 1 then 0 else if isOrder and (dollarProfitLoss > 0) and (dollarProfitLoss > biggestWin[1]) then dollarProfitLoss else biggestWin[1], 0);
def biggestLoss = CompoundValue(1, if IsNaN(biggestLoss[1]) or BarNumber() == 1 then 0 else if isOrder and (dollarProfitLoss < 0) and (dollarProfitLoss < biggestLoss[1]) then dollarProfitLoss else biggestLoss[1], 0);

# What percent were winners
def PCTWin = Round((profitWinners / orderCount) * 100, 2);

# Average trade
def avgTrade = Round((dollarPLSum / orderCount), 2);

#######################################
## Win / Loss labels
#######################################

AddLabel(trade_odds_Labels, "Closed Orders: " + orderCount + " P/L: " + AsDollars(dollarPLSum), if dollarPLSum > 0 then Color.GREEN else if dollarPLSum < 0 then Color.YELLOW else Color.GRAY);
AddLabel(if !IsNaN(orderPrice) and trade_odds_Labels then 1 else 0, "Closed+Open P/L: " + AsDollars(TradePL + dollarPLSum), if ((TradePL + dollarPLSum) > 0) then Color.GREEN else if ((TradePL + dollarPLSum) < 0) then Color.YELLOW else Color.GRAY);

AddLabel(trade_odds_Labels, "Avg per Trade: " + AsDollars(avgTrade), if avgTrade > 0 then Color.GREEN else if avgTrade < 0 then Color.YELLOW else Color.GRAY);
AddLabel(trade_odds_Labels, "Winners: " + PCTWin + "%", if PCTWin > 50 then Color.GREEN else if PCTWin > 40 then Color.YELLOW else Color.GRAY);

AddLabel(trade_odds_Labels, "MaxUp: " + AsDollars(biggestWin) + " MaxDown: " + AsDollars(biggestLoss), Color.WHITE);
AddLabel(trade_odds_Labels, "Long Profit: " + AsDollars(profitLong), if profitLong > 0 then Color.GREEN else if profitLong < 0 then Color.YELLOW else Color.GRAY);
AddLabel(trade_odds_Labels, "Short Profit: " + AsDollars(profitShort), if profitShort > 0 then Color.GREEN else if profitShort < 0 then Color.YELLOW else Color.GRAY);
AddLabel(if !IsNaN(CurrentPosition) and trade_odds_Labels then 1 else 0, "Open: " + (if isLong then "Bought" else "Sold") + " @ " + orderPrice, Color.WHITE);
AddLabel(if !IsNaN(orderPrice) and trade_odds_Labels then 1 else 0, "Open Trade P/L: " + AsDollars(TradePL), if (TradePL > 0) then Color.GREEN else if (TradePL < 0) then Color.YELLOW else Color.GRAY);

#######################################
##  Bubbles for Profit/Loss
#######################################

AddChartBubble(showSignals and showBubbles and isOrder and isLong[1], low, "$" + dollarProfitLoss, if dollarProfitLoss == 0 then Color.LIGHT_GRAY else if dollarProfitLoss > 0 then Color.GREEN else Color.WHITE, 0);
AddChartBubble(showSignals and showBubbles and isOrder and isShort[1], high, "$" + dollarProfitLoss, if dollarProfitLoss == 0 then Color.LIGHT_GRAY else if dollarProfitLoss > 0 then Color.GREEN else Color.WHITE, 1);

input ShowStrategyCurrentPnlBubble = yes;

AddChartBubble(ShowStrategyCurrentPnlBubble  and !IsNaN(close) and IsNaN(close [-1] ) and HighestAll(BarNumber()) and AbsValue(TradePL) > 0, orderPrice, AsDollars(TradePL), if TradePL[0] > 0 then Color.GREEN else if  TradePL[0] < 0 then Color.RED else Color.BLUE);

## Remove below and save as a study
#######################################
##  Strategy Entries - Start
#######################################

AddOrder(OrderType.BUY_AUTO, EnableStrategy and activerange and ActiveTradeTime and  BuySignal, name =  "B()@ "  + open[-1], price = open[-1], tickcolor = GetColor(1), arrowcolor = GetColor(1));
AddOrder(OrderType.SELL_TO_CLOSE, EnableStrategy and activerange and ActiveTradeTime and SellStop, name =   "S(X)@ "  + open[-1],  price = open[-1], tickcolor = GetColor(4), arrowcolor = GetColor(4));

AddOrder(OrderType.SELL_AUTO, EnableStrategy and activerange and ActiveTradeTime and  SellSignal, name =  "s()@ "  + open[-1], price = open[-1], tickcolor = GetColor(4), arrowcolor = GetColor(4));
AddOrder(OrderType.BUY_TO_CLOSE, EnableStrategy and activerange and ActiveTradeTime and BuyStop, name =   "B(X)@ "  + open[-1],  price = open[-1], tickcolor = GetColor(1), arrowcolor = GetColor(1));

#######################################
##  Strategy Entries - End
#######################################

IFgcCtDICe9XjGa6z_xi5aQtEnypn1iWgUcMtDwj-EmYBVsSbu33tmVHXVnf8whRNzhLvCTGO1RdtkfrmNTwlWBBTy8hRy7A_ycpsGBsPg_m3yPdpE7G_WpbQfo7YebHiL1XdpNcW9WLBADeS3qjaSM

l0euusCSTO-8lPz69BV1rJrl-8SbhptEtu5MAiQy2voWB6w5C2lCi4AWYkZf9PwH9q9S3WSRrMxaZ6z5gJXtvmGJ693oNo2RYkwegg5u8dMvldqVlfzImuK4X9M8Sar1JBdip1oHXKUpoFt3_MP4sLQ
 
Last edited:
Smart Money Breakouts post
https://usethinkscript.com/threads/smart-money-breakouts-chartprime-for-thinkorswim.16967/

Found them to work well together.
http://tos.mx/QDt0n9W
Strategy: Gandalf with Smart Money Breakouts

Code:
# https://www.tradingview.com/v/aM3PRWEM/
#// This source code is subject to the terms of the Mozilla Public License 2.0 at
#// © ChartPrime
#indicator("Smart Money Breakouts [ChartPrime]", overlay=true, max_labels_count=500
# Converted and mod By Sam4Cok@Samer800    - 10 / 2023
input showInfoLabel = yes;
input colorBars = yes;
input colorBackground = yes;
input period = 20;                               #, 'Length',group = CORE,tooltip = "Swing Length")
input WicksOrBodyOfTheCandle = {default "Wicks", "Body"};    # "Wicks or Body of the candle"
input showBosChoch = {Default "Bubbles & Lines", "Bubbles Only", "Lines Only", "Don't Show"};
input signalType = {Default "Bubbles", "Arrows", "Don't Show"};
input showTargetLines = yes;
input LotSize = 100;
input ProfitMultiplyer = 1.75;    # "Target Multiplyer "
input StopLossMultiplyer = 2.00;

def na = Double.NaN;
def pos = Double.POSITIVE_INFINITY;
def neg = Double.NEGATIVE_INFINITY;
def Sync = AbsValue(BarNumber());
def tar = ProfitMultiplyer * 10;
def stL = StopLossMultiplyer * 10;
def wick = WicksOrBodyOfTheCandle == WicksOrBodyOfTheCandle."Wicks";
def sigBubble = signalType == signalType."Bubbles";
def sigArrows = signalType == signalType."Arrows";
#method volAdj(int len)=>
def nATR = ATR(Length = 30);
def volAdj = Min(nATR * 0.3, close * (0.3 / 100));
def Adj = volAdj[20] / 2;
def bubble; def lines;
Switch (showBosChoch) {
Case "Bubbles Only" :
    bubble = yes;
    lines = no;
Case "Lines Only" :
    bubble = no;
    lines = yes;
Case "Don't Show" :
    bubble = no;
    lines = no;
Default :
    bubble = yes;
    lines = yes;
}

#-- Colors
DefineGlobalColor("GREEN", CreateColor(2, 133, 69));
DefineGlobalColor("TAIL", CreateColor(20, 141, 154));
DefineGlobalColor("RED" , CreateColor(246, 7, 7));
DefineGlobalColor("_Green", CreateColor(3, 156, 131));
DefineGlobalColor("_RED", GetColor(2));
DefineGlobalColor("dGreen", CreateColor(3,69,57));
DefineGlobalColor("dRed", CreateColor(86,3,10));

#-- Script
script VolCal {
    input Index = 100;
    input Sync  = 50;
    def Bars = AbsValue(Index - Sync);
    def Green = fold i = 0 to Bars with p do
                p + (if GetValue(close, i) > GetValue(open, i)
                then GetValue(volume, i) else 0);
    def Red  = fold j = 0 to Bars with q do
                q + (if GetValue(close, j) < GetValue(open, j)
                then GetValue(volume, j) else 0);
    def Total = fold v = 0 to Bars with l do
                l + GetValue(volume, v);
    def GreenRatio = Green / Total * 100;
    def RedRatio = Red / Total * 100;
    def VolCal = if GreenRatio > 55 then 1 else
                 if RedRatio > 55 then -1 else 0;
    plot Out = VolCal;
}
script FindPivots {
    input dat = close; # default data or study being evaluated
    input HL  = 0;    # default high or low pivot designation, -1 low, +1 high
    input lbL  = 5;    # default Pivot Lookback Left
    input lbR  = 1;    # default Pivot Lookback Right
    ##############
    def _nan;    # used for non-number returns
    def _BN;     # the current barnumber
    def _VStop;  # confirms that the lookforward period continues the pivot trend
    def _V;      # the Value at the actual pivot point
    def _pivotRange;
    ##############
    _BN  = BarNumber();
    _nan = Double.NaN;
    _pivotRange = lbL + lbL;
    _VStop = if !IsNaN(dat[_pivotRange]) and lbR > 0 and lbL > 0 then
                fold a = 1 to lbR + 1 with b=1 while b do
                    if HL > 0 then dat > GetValue(dat, -a) else dat < GetValue(dat, -a) else _nan;
    if (HL > 0) {
        _V = if _BN > lbL and dat == Highest(dat, lbL + 1) and _VStop
            then dat else _nan;
    } else {
        _V = if _BN > lbL and dat == Lowest(dat, lbL + 1) and _VStop
            then dat else _nan;
    }
    plot result = if !IsNaN(_V) and _VStop then _V else _nan;
}
def ph =  findpivots(high, 1, period, period);
def pl =  findpivots(low ,-1, period, period);
def nanPh = !isNaN(ph);
def nanPl = !isNaN(pl);
def fixPh = if nanPh then ph else fixPh[1];
def fixPl = if nanPl then pl else fixPl[1];
def ScrHigh = if wick then high else close;
def ScrLow  = if wick then low else close;

def UpdatedHigh;
def UpdatedLow;
def ShortTrade;
def TradeisON;
def LongTrade;
def HighIndex;
def phActive;
def plActive;
def phActive_;
def plActive_;
def LowIndex;
def HBreak;
def TP;
def SL;
def BUY;
def SELL;

if nanPh {
    UpdatedHigh = ph;
    phActive_   = yes;
    HighIndex   = Sync;
    } else {
    UpdatedHigh = UpdatedHigh[1];
    phActive_   = phActive[1];
    HighIndex   = HighIndex[1];
}
if nanPl  {
    UpdatedLow = pl;
    plActive_  = yes;
    LowIndex   = Sync;
    } else {
    UpdatedLow = UpdatedLow[1];
    plActive_  = plActive[1];
    LowIndex   = LowIndex[1];
}
#// LONG
if ScrHigh > UpdatedHigh and phActive_ {
    BUY = yes;
    phActive = no;
    } else {
    BUY = no;
    phActive = phActive_;
}
#//Sell
if ScrLow < UpdatedLow and plActive_ {
    SELL = yes;
    plActive = no;
    } else {
    SELL = no;
    plActive = plActive_;
}
#// lets Draw

def barB;def LabLocB;def labB;
def barS;def LabLocS;def labS;

if BUY and !TradeisON[1] {
    barB    = Sync;
    barS    = barS[1];
    LabLocB = floor(Sync - (Sync - HighIndex) / 2);
    LabLocS = LabLocS[1];
    labB    = if !HBreak[1] then 1 else -1;
    labS    = labS[1];
    HBreak  = yes;
    } else
if SELL and !TradeisON[1] {
    barB    = barB[1];
    barS    = Sync;
    LabLocB = LabLocB[1];
    LabLocS = floor(Sync - (Sync - LowIndex) / 2);
    labB    = labB[1];
    labS    = if HBreak[1] then 1 else -1;
    HBreak  = no;
    } else {
    barB    = barB[1];
    barS    = barS[1];
    LabLocB = LabLocB[1];
    LabLocS = LabLocS[1];
    labB    = labB[1];
    labS    = labS[1];
    HBreak  = HBreak[1];
}
def Long = BUY and !TradeisON[1];
def Short = SELL and !TradeisON[1];
def TradeFire = Long or Short;

if Long and !TradeisON[1] {
    LongTrade = yes;
    ShortTrade = no;
    } else
if Short and !TradeisON[1] {
    LongTrade = no;
    ShortTrade = yes;
    } else {
    LongTrade = LongTrade[1];
    ShortTrade = ShortTrade[1];
}
def win; def los;def entry;
def profit; def losses;
if TradeFire and !TradeisON[1] {
    entry = ohlc4[-1];
    TP = if Long  then entry + (Adj * Tar) else
         if Short then entry - (Adj * Tar) else na;
    SL = if Long  then entry - (Adj * stL) else
         if Short then entry + (Adj * stL) else na;
    win = if !sync then 0 else win[1];
    los = if !sync then 0 else los[1];
    profit = profit[1];
    losses = losses[1];
    TradeisON = yes;
    } else
if LongTrade and TradeisON[1] {
    entry = entry[1];
    TP = TP[1];
    SL = SL[1];
    win = if high  >= TP then win[1] + 1 else win[1];
    los = if close <= SL then los[1] + 1 else los[1];
    profit = if high crosses above TP then profit[1] + AbsValue(close - Entry) * lotSize else profit[1];
    losses = if close crosses below SL then losses[1] + AbsValue(Entry - close) * lotSize else losses[1];
    TradeisON = if high >= TP then no else
                if close <= SL then no else TradeisON[1];
    } else
if ShortTrade and TradeisON[1] {
    entry = entry[1];
    TP = TP[1];
    SL = SL[1];
    win = if low <= TP then win[1] + 1 else win[1];
    los = if close >= SL then los[1] + 1 else los[1];
    profit = if low crosses below TP then profit[1] + AbsValue(entry - close) * lotSize else profit[1];
    losses = if close Crosses Above SL then losses[1] + AbsValue(close - Entry) * lotSize else losses[1];
    TradeisON = if low <= tp then no else
                if close >= SL then no else TradeisON[1];
    } else {
    entry = na;
    TP = TP[1];
    SL = SL[1];
    win = if !sync then 0 else win[1];
    los = if !sync then 0 else los[1];
    profit = profit[1];
    losses = losses[1];
    TradeisON = TradeisON[1];
}
def volH =  VolCal(HighIndex,Sync);
def volL = VolCal(LowIndex,Sync);
def BearCon = TradeisON and ShortTrade;
def BullCon = TradeisON and LongTrade;
def signH = if BUY  and !TradeisON then volH else signH[1];
def signS = if SELL and !TradeisON then volL else signS[1];
def buyCond = BullCon and !BullCon[1];
def sellCond = BearCon and !BearCon[1];
def barBuy  = if buyCond  then HighIndex -1 else barBuy[1];
def barSell = if sellCond then lowIndex  -1 else barSell[1];

#-- Signals
plot arrUp = if sigArrows and buyCond then low else na;
plot arrDn = if sigArrows and sellCond then high else na;
arrUp.SetPaintingStrategy(PaintingStrategy.BOOLEAN_ARROW_UP);
arrDn.SetPaintingStrategy(PaintingStrategy.BOOLEAN_ARROW_DOWN);
arrUp.AssignValueColor(if signH>0 then color.CYAN else Color.VIOLET);
arrDn.AssignValueColor(if signS<0 then color.MAGENTA else Color.PLUM);

AddchartBubble(sigBubble and buyCond, low,"B" ,if signH>0 then color.GREEN else Color.DARK_GREEN, no);
AddchartBubble(sigBubble and sellCond, high,"S",if signS<0 then color.RED else Color.DARK_RED);

#-- Trade
plot entryLine = if !showTargetLines then na else
                 if TradeisON then entry else na;
entryLine.SetDefaultColor(Color.GRAY);
entryLine.SetStyle(Curve.SHORT_DASH);

plot lineUp = if !showTargetLines then na else
              if BullCon then tp else
              if BearCon then tp else na;
plot lineDn = if !showTargetLines then na else
              if BullCon then sl else
              if BearCon then sl else na;
lineUp.SetDefaultColor(Color.CYAN);
lineDn.SetDefaultColor(Color.MAGENTA);
lineUp.SetPaintingStrategy(PaintingStrategy.HORIZONTAL);
lineDn.SetPaintingStrategy(PaintingStrategy.HORIZONTAL);


def plotUp = lines and highestAll(barB) > Sync and Sync > highestAll(barBuy);
def plotDn = lines and highestAll(barS) > Sync and Sync > highestAll(barSell);

plot BullPvt = if plotUp then if fixPh then fixPh else na else na;
plot BearPvt = if plotDn then if fixPl then fixPl else na else na;

BullPvt.SetStyle(Curve.LONG_DASH);
BearPvt.SetStyle(Curve.LONG_DASH);
BullPvt.SetDefaultColor(GlobalColor("Green"));
BearPvt.SetDefaultColor(GlobalColor("Red"));

BullPvt.SetPaintingStrategy(PaintingStrategy.HORIZONTAL);
BearPvt.SetPaintingStrategy(PaintingStrategy.HORIZONTAL);

def bubUpCond = bubble and highestAll(LabLocB) == sync;
def bubDnpCond = bubble and highestAll(LabLocS) == sync;

AddChartBubble(bubUpCond, fixPh ,if labB > 0 then "BOS" else "CHoCH",
               if signH>0 then Color.GREEN else if  signH < 0 then Color.RED else GetColor(4));
AddChartBubble(bubDnpCond, fixPl ,if labS > 0 then "BOS" else "CHoCH",
               if signS<0 then Color.GREEN else if signS > 0 then Color.RED else GetColor(4));

#-- BG and Bar Color
AddCloud(if !colorBackground then na else if BullCon then pos else na, neg, GlobalColor("dGreen"));
AddCloud(if !colorBackground then na else if BearCon then pos else na, neg, GlobalColor("dRed"));

AssignPriceColor(if !colorBars then Color.CURRENT else
                 if BearCon then GlobalColor("_RED") else
                 if BullCon then GlobalColor("_Green") else CreateColor(52, 52, 54));

#--

plot TradeEnd = if !TradeisON and TradeisON[1] then
                if los>los[1] then lineDn[1] else lineUp[1] else na;
TradeEnd.AssignValueColor(if win>win[1] then Color.GREEN else Color.RED);
TradeEnd.SetPaintingStrategy(PaintingStrategy.SQUARES);

#-- Label
def totTrade = win + los;
def winRate = Round(win / totTrade * 100, 0);
def PandL = Round(profit - losses, 2);
 
AddLabel(showInfoLabel, "Tot Trade: " + totTrade, color.WHITE);
AddLabel(showInfoLabel, "P/L: $" + PandL,
                        if PandL > 0 then Color.LIGHT_GREEN else
                        if PandL < 0 then Color.PINK else Color.GRAY);
AddLabel(showInfoLabel, "WinRate: " + winRate + "%",
                        if winRate > 50 then Color. Green else
                        if winRate < 50 then color.RED else Color.GRAY);
AddLabel(showInfoLabel, "Win: " + win, color.GREEN);
AddLabel(showInfoLabel, "Loss: " + los, color.RED);


#-- END of CODE


#rami Segal
## strategy template

input EnableStrategy = yes;
input UseMarketTime = no; #hint UseMarketTime: Use Trading hours?
input TradeTimeStart = 0930;
input TradeTimeEnd = 1555;
input UseTradeOffTradeTime = no;
input UseMarketTradeTimeToExitPositions = no; #hint UseMarketTradeTimeToExitPositions: Exit/Close open trades based on the market hours selected
input UseDateRange = no; #hint UseDateRange: Trade Signals within the date range specified
input ActiveStartDate = 20230101;
input ActiveEndDate = 20240101;

def activedaterange = GetYYYYMMDD() >= ActiveStartDate and GetYYYYMMDD() <= ActiveEndDate;
def activerange = if UseDateRange then  activedaterange else 1;
AddLabel(UseDateRange, if activerange then "Range " + AsPrice(ActiveStartDate) + " - " + AsPrice(ActiveEndDate) else ""  , Color.WHITE );

def Active = if GetDay() != GetDay()[1]
          then 0
          else if SecondsTillTime(TradeTimeStart) <= 0 and
                  SecondsTillTime(TradeTimeEnd) >= 0
            then 1
            else 0;

def ActiveTradeTime = if UseTradeOffTradeTime then !Active else if UseMarketTime then if SecondsTillTime(TradeTimeStart) <= 0 and
                           SecondsTillTime(TradeTimeEnd) >= 0  then 1 else 0
                    else 1;
def closeallmarket =   ( if UseMarketTime and UseTradeOffTradeTime then Active and !Active[1] and UseMarketTradeTimeToExitPositions else  !ActiveTradeTime and ActiveTradeTime[1])  and UseMarketTradeTimeToExitPositions;
input ShowTime = yes;

input TimeZone = 10.5;
def Hours = Floor(TimeZone + SecondsFromTime(0930) / 60 / 60) - 1;
def Minutes = ((TimeZone + SecondsFromTime(930) / 60 / 60) % 1) * 60;

AddLabel(ShowTime, " Market Time:  " + GetMonth() + "/" +  GetDayOfMonth(GetYYYYMMDD()) + "/"  + (AsPrice(GetYear()))  + ":" + Hours + ":" + Minutes ,
             if !IsNaN(GetTime())
             then Color.LIME
             else if IsNaN(GetTime())
                  then Color.PINK
                  else Color.WHITE);


##@@@@@@@@@@@@@@@@@@@@@@@@@@@@@@@@@@@@@@@@@@@@@@@@@@@@@@@@@@@@@@@@@@@@@@@@@@@@@@@@@@@@@@@@@@@@@@@@@@@@@@@@@@@@@@@@@@@@@@@@@@@@@@@@@@@@@@@@@
#rami Segal
## strategy logic with gandalf
input useWizSmartMoneyOrders = yes;
input useWizSmartMoneyOrderLong = yes;
input useWizSmartMoneyOrderShort = no;
input useWiz = no;
input useAutoOrdersWiz = yes;

def averagePrice = ohlc4;
def medianPrice = hl2;
def medianBodyPrice = MidBodyVal();

def entryGandaldfPattern = (averagePrice[1] < medianPrice[1] and
    medianPrice[2] <= averagePrice[1] and
    medianBodyPrice[2] <= averagePrice[3]) or
    (averagePrice[1] < medianPrice[3] and
    medianBodyPrice < medianPrice[2] and
    medianBodyPrice[1] < medianBodyPrice[2]);

def exitGandalfPattern = (averagePrice[1] < medianBodyPrice[1] and
    medianPrice[2] == medianBodyPrice[3] and
    medianBodyPrice[1] <= medianBodyPrice[4]) or
    (averagePrice[2] < medianBodyPrice and
    medianPrice[4] <= averagePrice[3] and
    medianBodyPrice[1] <= averagePrice[1]);


def wiz_buy = ((buyCond or entryGandaldfPattern) and !(( sellCond  ) or (exitGandalfPattern and !entryGandaldfPattern))) ;
def wiz_sell = ( sellCond  );

def rs_buy = ( EnableStrategy and activerange and ActiveTradeTime and useWiz and useAutoOrderswiz and wiz_buy) or
(EnableStrategy and activerange and ActiveTradeTime and useWiz and !useAutoOrderswiz and wiz_buy)or
( EnableStrategy and activerange and ActiveTradeTime and usewizSmartMoneyOrders and !usewizSmartMoneyOrderLong and !usewizSmartMoneyOrderShort and buyCond) or
( EnableStrategy and activerange and ActiveTradeTime and usewizSmartMoneyOrders and usewizSmartMoneyOrderLong and !usewizSmartMoneyOrderShort and buyCond)
or
( EnableStrategy and activerange and ActiveTradeTime and usewizSmartMoneyOrders and usewizSmartMoneyOrderLong and !usewizSmartMoneyOrderShort and buyCond);


def rs_sell = (EnableStrategy and activerange and ActiveTradeTime and usewizSmartMoneyOrders and !usewizSmartMoneyOrderShort and !usewizSmartMoneyOrderLong and sellCond) or  (EnableStrategy and activerange and ActiveTradeTime and usewizSmartMoneyOrders and usewizSmartMoneyOrderShort and !usewizSmartMoneyOrderLong and sellCond) or
( EnableStrategy and activerange and ActiveTradeTime and useWiz and useAutoOrderswiz and wiz_sell);


#rami Segal
## strategy trade odds
input trade_odds_Labels = yes;
input useAlerts = no;
input showSignals = yes;
input showBubbles = yes;
input useStops = yes;

def indBuySignal = rs_buy; # insert condition to create long position
def IndSellSignal = rs_sell; # insert condition to create short position

def IndBuyStop  = ((EnableStrategy and closeAllmarket) or (EnableStrategy  and  !activerange))
or
 ( EnableStrategy and activerange and ActiveTradeTime and usewizSmartMoneyOrders and useWizSmartMoneyOrderLong and !usewizSmartMoneyOrderShort and sellCond) or

(EnableStrategy and activerange and ActiveTradeTime and useWiz and !useAutoOrderswiz and wiz_buy);

def IndSellStop = (EnableStrategy and closeAllmarket) or (EnableStrategy  and  !activerange) or
 (EnableStrategy and activerange and ActiveTradeTime and usewizSmartMoneyOrders and usewizSmartMoneyOrderShort and !useWizSmartMoneyOrderLong and buyCond)


; # insert condition to stop in place of the 0 after else

def otf_BarBuySignal = IndBuySignal;
def otf_BarSellSignal = IndSellSignal;

def otf_BarBuySignalCount = CompoundValue(1, if otf_BarBuySignal then (if IsNaN(otf_BarBuySignalCount[1]) then 0 else otf_BarBuySignalCount[1]) + 1 else 0, 0);
def otf_BarSellSignalCount = CompoundValue(1, if otf_BarSellSignal then ( if IsNaN( otf_BarSellSignalCount[1]) then 0 else otf_BarSellSignalCount[1] ) - 1 else 0, 0);
def otf_BarBuyStopSignalCount = CompoundValue(1, if IndSellStop then (if IsNaN(otf_BarBuyStopSignalCount[1]) then 0 else otf_BarBuyStopSignalCount[1]) + 1 else 0, 0);
def otf_BarSellStopSignalCount = CompoundValue(1, if IndBuyStop then ( if IsNaN( otf_BarSellStopSignalCount[1]) then 0 else otf_BarSellStopSignalCount[1] ) - 1 else 0, 0);

#
#######################################
def BuySignal = otf_BarBuySignalCount  == 1;
def SellSignal = otf_BarSellSignalCount == -1;

def BuyStop  = otf_BarBuyStopSignalCount == 1;
def SellStop = otf_BarSellStopSignalCount == -1;


#######################################
##  Maintain the position of trades
#######################################

def CurrentPosition;  # holds whether flat = 0 long = 1 short = -1

if (BarNumber() == 1) or IsNaN(CurrentPosition[1]) {
    CurrentPosition = 0;
} else {
    if CurrentPosition[1] == 0 {            # FLAT
        if (BuySignal) {
            CurrentPosition = 1;
        } else if (SellSignal) {
            CurrentPosition = -1;
        } else {
            CurrentPosition = CurrentPosition[1];
        }
    } else if CurrentPosition[1] == 1 {      # LONG
        if (SellSignal) {
            CurrentPosition = -1;
        } else if (BuyStop) {
            CurrentPosition = 0;
        } else {
            CurrentPosition = CurrentPosition[1];
        }
    } else if CurrentPosition[1] == -1 {     # SHORT
        if (BuySignal) {
            CurrentPosition = 1;
        } else if (SellStop) {
            CurrentPosition = 0;
        } else {
            CurrentPosition = CurrentPosition[1];
        }
    } else {
        CurrentPosition = CurrentPosition[1];
    }
}

def isLong  = if CurrentPosition == 1 then 1 else 0;
def isShort = if CurrentPosition == -1 then 1 else 0;
def isFlat  = if CurrentPosition == 0 then 1 else 0;

# If not already long and get a BuySignal
plot BuySig = if (!isLong[1] and BuySignal and showSignals) then 1 else 0;
BuySig.AssignValueColor(Color.CYAN);
BuySig.SetPaintingStrategy(PaintingStrategy.BOOLEAN_ARROW_UP);
BuySig.SetLineWeight(5);

Alert(BuySig and useAlerts, "Buy Signal", Alert.BAR, Sound.Ding);

# If not already short and get a SellSignal
plot SellSig = if (!isShort[1] and SellSignal and showSignals) then 1 else 0;
SellSig.AssignValueColor(Color.CYAN);
SellSig.SetPaintingStrategy(PaintingStrategy.BOOLEAN_ARROW_DOWN);
SellSig.SetLineWeight(5);

Alert(SellSig and useAlerts, "Sell Signal", Alert.BAR, Sound.Ding);

# If long and get a BuyStop
plot BuyStpSig = if (BuyStop and isLong[1] and showSignals and useStops) then 1 else 0;
BuyStpSig.AssignValueColor(Color.LIGHT_GRAY);
BuyStpSig.SetPaintingStrategy(PaintingStrategy.BOOLEAN_ARROW_DOWN);
BuyStpSig.SetLineWeight(3);

# If short and get a SellStop
plot SellStpSig = if (SellStop and isShort[1] and showSignals and useStops) then 1 else 0;
SellStpSig.AssignValueColor(Color.LIGHT_GRAY);
SellStpSig.SetPaintingStrategy(PaintingStrategy.BOOLEAN_ARROW_UP);
SellStpSig.SetLineWeight(3);
#######################################
## Orders
#######################################

def isOrder = if CurrentPosition == CurrentPosition[1] then 0 else 1; # Position changed so it's a new order

# If there is an order, then the price is the next days close
def orderPrice = if (isOrder and (BuySignal or SellSignal)) then close else orderPrice[1];


def prevpricelevel = if orderPrice <> orderPrice[1] then orderPrice[1] else prevpricelevel[1];

plot OrderEntry = orderPrice;
OrderEntry.SetPaintingStrategy(PaintingStrategy.DASHES);
OrderEntry.SetDefaultColor(Color.CYAN);


#######################################
## Price and Profit
#######################################

def profitLoss;

if (!isOrder or orderPrice[1] == 0) {
    profitLoss = 0;
} else if ((isOrder and isLong[1]) and ((!isShort[1] and SellSignal) or (BuyStop and isLong[1] ))) {
    profitLoss = close - orderPrice[1];
} else if ((isOrder and isShort[1]) and ((!isLong[1] and BuySignal) or ( SellStop and isShort[1] ))) {
    profitLoss = orderPrice[1] - close;
} else {
    profitLoss = 0;
}

# Total Profit or Loss
def profitLossSum = CompoundValue(1, if IsNaN(isOrder) or BarNumber() == 1 then 0 else if isOrder then profitLossSum[1] + profitLoss else profitLossSum[1], 0);

# How many trades won or lost
def profitWinners = CompoundValue(1, if IsNaN(profitWinners[1]) or BarNumber() == 1 then 0 else if isOrder and profitLoss > 0 then profitWinners[1] + 1 else profitWinners[1], 0);
def profitLosers = CompoundValue(1, if IsNaN(profitLosers[1]) or BarNumber() == 1 then 0 else if isOrder and profitLoss < 0 then profitLosers[1] + 1 else profitLosers[1], 0);
def profitPush = CompoundValue(1, if IsNaN(profitPush[1]) or BarNumber() == 1 then 0 else if isOrder and profitLoss == 0 then profitPush[1] + 1 else profitPush[1], 0);

def orderCount = (profitWinners + profitLosers + profitPush) - 1;

# Current Open Trade Profit or Loss
def TradePL = if isLong then Round(((close - orderPrice) / TickSize()) * TickValue()) else if isShort then Round(((orderPrice - close) / TickSize()) * TickValue()) else 0;

#########################
#########################
# Math
#########################
#########################
# Convert to actual dollars based on Tick Value for bubbles
def dollarProfitLoss = if orderPrice[1] == 0 or IsNaN(orderPrice[1]) then 0 else Round((profitLoss / TickSize()) * TickValue());

# Closed Orders dollar P/L
def dollarPLSum = Round((profitLossSum / TickSize()) * TickValue())  ;

# Split profits or losses by long and short trades
def profitLong = CompoundValue(1, if IsNaN(profitLong[1]) or BarNumber() == 1 then 0 else if isOrder and isLong[1] then profitLong[1] + dollarProfitLoss else profitLong[1], 0);
def profitShort = CompoundValue(1, if IsNaN(profitShort[1]) or BarNumber() == 1 then 0 else if isOrder and isShort[1] then profitShort[1] + dollarProfitLoss else profitShort[1], 0);
def countLong = CompoundValue(1, if IsNaN(countLong[1]) or BarNumber() == 1 then 0 else if isOrder and isLong[1] then countLong[1] + 1 else countLong[1], 0);
def countShort = CompoundValue(1, if IsNaN(countShort[1]) or BarNumber() == 1 then 0 else if isOrder and isShort[1] then countShort[1] + 1 else countShort[1], 0);

# What was the biggest winning and losing trade
def biggestWin = CompoundValue(1, if IsNaN(biggestWin[1]) or BarNumber() == 1 then 0 else if isOrder and (dollarProfitLoss > 0) and (dollarProfitLoss > biggestWin[1]) then dollarProfitLoss else biggestWin[1], 0);
def biggestLoss = CompoundValue(1, if IsNaN(biggestLoss[1]) or BarNumber() == 1 then 0 else if isOrder and (dollarProfitLoss < 0) and (dollarProfitLoss < biggestLoss[1]) then dollarProfitLoss else biggestLoss[1], 0);

# What percent were winners
def PCTWin = Round((profitWinners / orderCount) * 100, 2);

# Average trade
def avgTrade = Round((dollarPLSum / orderCount), 2);

#######################################
## Win / Loss labels
#######################################

AddLabel(trade_odds_Labels, "Closed Orders: " + orderCount + " P/L: " + AsDollars(dollarPLSum), if dollarPLSum > 0 then Color.GREEN else if dollarPLSum < 0 then Color.YELLOW else Color.GRAY);
AddLabel(if !IsNaN(orderPrice) and trade_odds_Labels then 1 else 0, "Closed+Open P/L: " + AsDollars(TradePL + dollarPLSum), if ((TradePL + dollarPLSum) > 0) then Color.GREEN else if ((TradePL + dollarPLSum) < 0) then Color.YELLOW else Color.GRAY);

AddLabel(trade_odds_Labels, "Avg per Trade: " + AsDollars(avgTrade), if avgTrade > 0 then Color.GREEN else if avgTrade < 0 then Color.YELLOW else Color.GRAY);
AddLabel(trade_odds_Labels, "Winners: " + PCTWin + "%", if PCTWin > 50 then Color.GREEN else if PCTWin > 40 then Color.YELLOW else Color.GRAY);

AddLabel(trade_odds_Labels, "MaxUp: " + AsDollars(biggestWin) + " MaxDown: " + AsDollars(biggestLoss), Color.WHITE);
AddLabel(trade_odds_Labels, "Long Profit: " + AsDollars(profitLong), if profitLong > 0 then Color.GREEN else if profitLong < 0 then Color.YELLOW else Color.GRAY);
AddLabel(trade_odds_Labels, "Short Profit: " + AsDollars(profitShort), if profitShort > 0 then Color.GREEN else if profitShort < 0 then Color.YELLOW else Color.GRAY);
AddLabel(if !IsNaN(CurrentPosition) and trade_odds_Labels then 1 else 0, "Open: " + (if isLong then "Bought" else "Sold") + " @ " + orderPrice, Color.WHITE);
AddLabel(if !IsNaN(orderPrice) and trade_odds_Labels then 1 else 0, "Open Trade P/L: " + AsDollars(TradePL), if (TradePL > 0) then Color.GREEN else if (TradePL < 0) then Color.YELLOW else Color.GRAY);

#######################################
##  Bubbles for Profit/Loss
#######################################

AddChartBubble(showSignals and showBubbles and isOrder and isLong[1], low, "$" + dollarProfitLoss, if dollarProfitLoss == 0 then Color.LIGHT_GRAY else if dollarProfitLoss > 0 then Color.GREEN else Color.WHITE, 0);
AddChartBubble(showSignals and showBubbles and isOrder and isShort[1], high, "$" + dollarProfitLoss, if dollarProfitLoss == 0 then Color.LIGHT_GRAY else if dollarProfitLoss > 0 then Color.GREEN else Color.WHITE, 1);

input ShowStrategyCurrentPnlBubble = yes;

AddChartBubble(ShowStrategyCurrentPnlBubble  and !IsNaN(close) and IsNaN(close [-1] ) and HighestAll(BarNumber()) and AbsValue(TradePL) > 0, orderPrice, AsDollars(TradePL), if TradePL[0] > 0 then Color.GREEN else if  TradePL[0] < 0 then Color.RED else Color.BLUE);

## Remove below and save as a study
#######################################
##  Strategy Entries - Start
#######################################

AddOrder(OrderType.BUY_AUTO, EnableStrategy and activerange and ActiveTradeTime and  BuySignal, name =  "B()@ "  + open[-1], price = open[-1], tickcolor = GetColor(1), arrowcolor = GetColor(1));
AddOrder(OrderType.SELL_TO_CLOSE, EnableStrategy and activerange and ActiveTradeTime and SellStop, name =   "S(X)@ "  + open[-1],  price = open[-1], tickcolor = GetColor(4), arrowcolor = GetColor(4));

AddOrder(OrderType.SELL_AUTO, EnableStrategy and activerange and ActiveTradeTime and  SellSignal, name =  "s()@ "  + open[-1], price = open[-1], tickcolor = GetColor(4), arrowcolor = GetColor(4));
AddOrder(OrderType.BUY_TO_CLOSE, EnableStrategy and activerange and ActiveTradeTime and BuyStop, name =   "B(X)@ "  + open[-1],  price = open[-1], tickcolor = GetColor(1), arrowcolor = GetColor(1));

#######################################
##  Strategy Entries - End
#######################################
 
Last edited:
Hybrid strategy: SuperWizTrendTrailStrategy

This strategy is using Mobius implied volatility fractal chop, Daily Bias Super trend and Gandalf Pattern
Best performance on lower time frames with the default setup.
Entries are triggered in sync with the daily bias and/or super trend and Gandalf pattern
Stops are triggered in sync with the daily bias implied volatility trend fractal chop signal
Conservative and Momentum combined filters will increase or reduce the number of singles triggered.

This strategy has the best performing mix of indicators I was able to assemble so far.

1706559543340.png


1706571765436.png


nv1ZQEKLjJqW2jgaumfmG-yGXMg80DRJceXLIxddQRvRR4UR-DhUpDDSxtAC4SsY_EdMKD-o98Kz8eXMovQkqwVrujbaIqdNigHnPrK1Fffr0rcIXEKYhy7PW2ECujfYcunmvR0Aat45VCDpj3e6OOo


Save the script as a strategy or
remove the strategy orders at the bottom of the script and save as a study.

Hybrid strategy: SuperWizTrendTrailStrategy

Code:
#rsegal
#SuperWizTrendTrailStrategy#############ver 01/29/24 08:20pm


input EnableStrategy = yes;
input UseMarketTime = no; #hint UseMarketTime: Use Trading hours?
input TradeTimeStart = 0930;
input TradeTimeEnd = 1555;
input UseTradeOffTradeTime = no;
input UseMarketTradeTimeToExitPositions = no; #hint UseMarketTradeTimeToExitPositions: Exit/Close open trades based on the market hours selected
input UseDateRange = no; #hint UseDateRange: Trade Signals within the date range specified
input ActiveStartDate = 20230101;
input ActiveEndDate = 20240101;
input ShowLabels = yes;
def activedaterange = GetYYYYMMDD() >= ActiveStartDate and GetYYYYMMDD() <= ActiveEndDate;
def activerange = if UseDateRange then  activedaterange else 1;
AddLabel(ShowLabels and UseDateRange, if activerange then "Range " + AsPrice(ActiveStartDate) + " - " + AsPrice(ActiveEndDate) else ""  , Color.WHITE );

def Active = if GetDay() != GetDay()[1]
          then 0
          else if SecondsTillTime(TradeTimeStart) <= 0 and
                  SecondsTillTime(TradeTimeEnd) >= 0
            then 1
            else 0;

def ActiveTradeTime = if UseTradeOffTradeTime then !Active else if UseMarketTime then if SecondsTillTime(TradeTimeStart) <= 0 and
                           SecondsTillTime(TradeTimeEnd) >= 0  then 1 else 0
                    else 1;
def closeallmarket =   ( if UseMarketTime and UseTradeOffTradeTime then !Active[1] and Active and UseMarketTradeTimeToExitPositions else  !ActiveTradeTime and ActiveTradeTime[1])  and UseMarketTradeTimeToExitPositions;

input ShowTime = yes;

input TimeZone = 10.5;
def Hours = Floor(TimeZone + SecondsFromTime(0930) / 60 / 60) - 1;
def Minutes = ((TimeZone + SecondsFromTime(930) / 60 / 60) % 1) * 60;

AddLabel(ShowLabels and ShowTime, "SuperWizTrendTrailStrategy: Market Time:  " + GetMonth() + "/" +  GetDayOfMonth(GetYYYYMMDD()) + "/"  + (AsPrice(GetYear()))  + ":" + Hours + ":" + Minutes ,
             if !IsNaN(GetTime())
             then Color.LIME
             else if IsNaN(GetTime())
                  then Color.PINK
                  else Color.WHITE);


input sourcehigh = high;
input sourcelow = low;
input sourceclose = close;
input nATR = 5;
input ATRMult = .7;
input tmV = 3;
input AvgType = AverageType.SIMPLE;
Input TrendingBars = 1;
AddLabel(ShowLabels, "TF: " + GetAggregationPeriod() / 60000, Color.WHITE);

def h = Highest(sourcehigh, tmV);
def l = Lowest(sourcelow, tmV);
def c = (Highest(sourceclose, tmV) + Lowest(sourceclose, tmV)) / 2;

def ATR = MovingAverage(AvgType, TrueRange(h, c, l), nATR);
def UP = c + (ATRMult * ATR);
def DN = c + (-ATRMult * ATR);

def priceclose = c;
def lowestup = if UP <= lowestup[1] then UP[0] else if priceclose < lowestup[1] and priceclose < UP[0] then lowestup[1] else UP[0];
def highestdn = if DN >= highestdn[1] then DN[0] else if priceclose > highestdn[1] and priceclose > DN[0]  then highestdn[1] else DN[0];

def trend = if  priceclose[0] crosses below highestdn[1] then -1 else if  priceclose[0] crosses above lowestup[1]  then 1 else trend[1];

def sellmodeprice =  if  priceclose[0] crosses below highestdn[1] and trend[1] > 0 then highestdn[1] else sellmodeprice[1];
def buymodeprice =  if  priceclose[0] crosses above lowestup[1] and   trend[1] < 0 then lowestup[1] else buymodeprice[1];

plot sellcrossprice = if trend <> 0  then  sellmodeprice else Double.NaN;
plot buycrossprice = if trend <> 0  then  buymodeprice   else Double.NaN;

sellcrossprice.SetPaintingStrategy(PaintingStrategy.HORIZONTAL);
buycrossprice.SetPaintingStrategy(PaintingStrategy.HORIZONTAL);

buycrossprice.SetDefaultColor(  Color.LIGHT_GREEN);
sellcrossprice.SetDefaultColor ( Color.PINK);

buycrossprice.AssignValueColor(if close > buycrossprice then Color.GREEN else Color.LIGHT_GREEN);
sellcrossprice.AssignValueColor(if close < sellcrossprice then Color.RED else  Color.PINK);

sellcrossprice.SetStyle(Curve.FIRM );
sellcrossprice.SetLineWeight(1);

buycrossprice.SetStyle(Curve.FIRM );
buycrossprice.SetLineWeight(1);


plot sell =  if  trend < 0 then lowestup[0] else Double.NaN ;
plot buy = if  trend > 0  then highestdn[0] else Double.NaN ;


sell.SetDefaultColor(  Color.MAGENTA );
buy.SetDefaultColor( Color.LIME );

def barUp = trend > 0 ;
def barDown = trend < 0 ;
def barUpCount = CompoundValue(1, if barUp then (if IsNaN(barUpCount[1]) then 0 else barUpCount[1]) + 1 else 0, 0);
def barDownCount = CompoundValue(1, if barDown then ( if IsNaN( barDownCount[1]) then 0 else barDownCount[1] ) - 1 else 0, 0);
def trendcnt = barDownCount + barUpCount ;

AddLabel(ShowLabels, "Trending Bars " + (trendcnt) ,  if trend > 0  then Color.LIME else  Color.MAGENTA );

input AssignPriceColorByCurrentTrend = no;
AssignPriceColor( if trend > 0  and AssignPriceColorByCurrentTrend then Color.LIME else  if trend < 0 and AssignPriceColorByCurrentTrend then Color.MAGENTA else Color.CURRENT);

input UseMomentumFilter = yes;
input TradeFrequecy = {default "Hold", "Swing", "Scalp"};
def tf;
switch (TradeFrequecy) {
case "Swing":
    tf = 3;
case "Scalp":
    tf = 2;
case "Hold":
    tf = 1;
}

AddLabel(ShowLabels and UseMomentumFilter, "Momentum Filter: " + TradeFrequecy,  Color.WHITE);

def otf_trendlowestlow;
def otf_trendhighesthigh;

if trend < 0
then
{
    otf_trendlowestlow = if trend == trend[1] then if (if UseMomentumFilter then (if tf == 3 then close else if tf == 2 then  low else if tf == 1 then high else low) else low) < otf_trendlowestlow[1] then low else otf_trendlowestlow[1] else low[1];
    otf_trendhighesthigh =  otf_trendhighesthigh[1];
}
else
if trend > 0
then
{
    otf_trendlowestlow = otf_trendlowestlow[1];
    otf_trendhighesthigh = if trend == trend[1] then if (if UseMomentumFilter then  (if tf == 3 then close else if tf == 2 then  high else if tf == 1 then low else high) else high) > otf_trendhighesthigh[1] then high else otf_trendhighesthigh[1] else high[1];
}
else
{
    otf_trendlowestlow = otf_trendlowestlow[1];
    otf_trendhighesthigh = otf_trendhighesthigh[1];
}

input ShowHighAndLow = yes;
plot t1rendlowestlow =  if ShowHighAndLow and trend >  0 and otf_trendlowestlow == otf_trendlowestlow[1]then otf_trendlowestlow else double.NaN;
plot t1rendhighesthigh =  if ShowHighAndLow and  trend < 0 and otf_trendhighesthigh == otf_trendhighesthigh[1] then otf_trendhighesthigh  else double.NaN;

t1rendlowestlow.SetPaintingStrategy(PaintingStrategy.HORIZONTAL);
t1rendhighesthigh .SetPaintingStrategy(PaintingStrategy.HORIZONTAL);
t1rendlowestlow.SetDefaultColor(color.red);
t1rendhighesthigh.SetDefaultColor(color.green);


def max1h = Max( otf_trendhighesthigh, sellcrossprice );
def min1h = Min( otf_trendhighesthigh, sellcrossprice ) ;
def max1l = Max(  otf_trendlowestlow, buycrossprice  ) ;
def min1l = Min(  otf_trendlowestlow, buycrossprice  ) ;
#################################
input ShowOrderBlockCloud = yes;
#################################
AddCloud(if ShowOrderBlockCloud and trendcnt < 0    then min1h  else   Double.NaN , max1h, Color.RED );
AddCloud(if ShowOrderBlockCloud and trendcnt > 0   then max1l  else   Double.NaN , min1l, Color.GREEN    );


def averagePrice = ohlc4;
def medianPrice = hl2;
def medianBodyPrice = MidBodyVal();

def entryGandaldfPattern = (averagePrice[1] < medianPrice[1] and
    medianPrice[2] <= averagePrice[1] and
    medianBodyPrice[2] <= averagePrice[3]) or
    (averagePrice[1] < medianPrice[3] and
    medianBodyPrice < medianPrice[2] and
    medianBodyPrice[1] < medianBodyPrice[2]);

def exitGandalfPattern = (averagePrice[1] < medianBodyPrice[1] and
    medianPrice[2] == medianBodyPrice[3] and
    medianBodyPrice[1] <= medianBodyPrice[4]) or
    (averagePrice[2] < medianBodyPrice and
    medianPrice[4] <= averagePrice[3] and
    medianBodyPrice[1] <= averagePrice[1]);

def Exitwiz =  otf_trendlowestlow < otf_trendlowestlow[1] ;
def wiz_buy = (entryGandaldfPattern and !(( Exitwiz  ) or (exitGandalfPattern and !entryGandaldfPattern))) ;
def wiz_sell = ( Exitwiz  ) and (exitGandalfPattern or !entryGandaldfPattern);

def dir = if wiz_buy and wiz_buy <> wiz_buy[1] then 1 else if  wiz_sell and wiz_sell <> wiz_sell[1]  then -1  else dir[1];

def showVerticalDirectionlSignals = yes;
AddVerticalLine(showVerticalDirectionlSignals and dir <> dir and dir > 0 , "B", Color.GREEN);
AddVerticalLine(showVerticalDirectionlSignals and dir <> dir[1] and dir < 0, "S", Color.RED);
################################################################### Trade Logic ###############################################


#################################################

# DailyBias?
# Mobius?
# Study tracks the open vs previous close and current days closing bias?
# V01.07.2015?

def RTHopen = open(period = AggregationPeriod.DAY);
def prevRTHclose = close(period = AggregationPeriod.DAY)[1];
def RTHclose = close(period = AggregationPeriod.DAY);
def countUp = if RTHopen < prevRTHclose and
                 RTHclose < RTHopen
              then countUp[1] + 1
              else countUp[1];

def countDn = if RTHopen > prevRTHclose and
                 RTHclose > RTHopen
              then countDn[1] + 1
              else countDn[1];

def barCount = CompoundValue(1, barCount[1] + 1, 0);
def Pup = (barCount - countUp) / BarNumber();
def Pdn = (barCount - countDn) / BarNumber();

AddLabel(ShowLabels , "Daily Bias:" + "%O < PC and C < O = " + AsPercent(Pup) +
 "  %O > PC and C > O = " + AsPercent(Pdn),
 if RTHopen < prevRTHclose and RTHclose < RTHopen
 then Color.RED
 else if RTHopen < prevRTHclose and RTHclose > RTHopen
 then Color.YELLOW
 else Color.WHITE);

def dailybias = if RTHopen < prevRTHclose and RTHclose < RTHopen then -1 else  if RTHopen < prevRTHclose and RTHclose > RTHopen  then 1 else dailybias[1];

#################################################
input useWizTrend = yes;
input conservativeOrders = no;
input OrderSimbol = no;
input showDailyBiasBubble = no;
#################################################

AddChartBubble(showDailyBiasBubble and  dailybias <> dailybias[1], close, "Daily Bias:" + "%O < PC and C < O = " + AsPercent(Pup) +
 "  %O > PC and C > O = " + AsPercent(Pdn),  if RTHopen < prevRTHclose and RTHclose < RTHopen
 then Color.RED
 else if RTHopen < prevRTHclose and RTHclose > RTHopen
 then Color.YELLOW
 else Color.WHITE);

# End Code Daily Bias 


input FractalCalculationsLength = 13; #hint FractalCalculationsLength: Periods or Length for the fractal calculations
input Periods_for_the_Smoothed_Signal_Line = 5; #hint Periods_for_the_Smoothed_Signal_Line: Periods for the Smoothed Signal Line.

def IV = if IsNaN(imp_volatility(period = AggregationPeriod.DAY))
            then IV[1]
            else imp_volatility(period = AggregationPeriod.DAY);
def HTH = Highest(Max(high, close[1]), FractalCalculationsLength);
def LTL = Lowest(Min(low, close[1]), FractalCalculationsLength);
def CIb = (((close * IV) / (HTH - LTL)) / Log(10));
def CI = WildersAverage(CIb, Periods_for_the_Smoothed_Signal_Line);

AddLabel(ShowLabels , if CI < CI[1] then "Trending" else "Choppy", if CI < CI[1] then Color.GREEN else Color.RED);

input PaintFractalCalculationsBars = yes;

AssignPriceColor( if PaintFractalCalculationsBars then if  CI < CI[1]
 then if trend > 0  then Color.LIME  else if trend < 0
 then Color.MAGENTA else Color.CURRENT  else Color.GRAY  else Color.CURRENT ) ;


def wizdb_buy = if conservativeOrders then trend > 0 else 1 and (entryGandaldfPattern and  dailybias > 0 ) and !( exitGandalfPattern and !entryGandaldfPattern) ;
def wdizbz_sell = if conservativeOrders then trend < 0 else 1 and  (   dailybias < 0 ) and (exitGandalfPattern or !entryGandaldfPattern);

def trenddb_BUY_auto =  (dailybias > 0 and  trendcnt > max(TrendingBars,0) and CI < CI[1]);
def trenddb_sell_auto = (dailybias < 0 and  trendcnt < min(-TrendingBars,0) and CI < CI[1] );

def trenddb_Sell_to_close = ( !( CI < CI[1] ) and trend <> trend[1] );
def trenddb_BUY_to_close = (!( CI < CI[1] ) and trend <> trend[1]);

def BuySignal = (EnableStrategy and activerange and ActiveTradeTime and useWizTrend and wizdb_buy) or
(EnableStrategy and activerange and ActiveTradeTime and useWizTrend and trenddb_BUY_auto ) ;

def SellSignal =  EnableStrategy and activerange and ActiveTradeTime and useWizTrend and trenddb_sell_auto ;

def SellStop  = closeallmarket or !activerange or ( EnableStrategy and activerange and ActiveTradeTime and useWizTrend and trenddb_BUY_to_close);

def BuyStop = closeallmarket or !activerange or ( EnableStrategy and activerange and ActiveTradeTime and useWizTrend and wdizbz_sell  ) or
(  EnableStrategy and activerange and ActiveTradeTime and useWizTrend and trenddb_Sell_to_close  );

def posdir = if BuySignal then 1 else if SellSignal then -1 else if buystop then 0 else if sellstop then 0 else if isnan(posdir[1]) then 0 else posdir[1];

input ShowRisksVerticals = yes;
AddVerticalLine(ShowRisksVerticals and BuySignal <> BuySignal[1] and BuySignal and (SellSignal[1] or BuyStop[1] or SellStop[1] )   , "Risk On", Color.LIME);
AddVerticalLine(ShowRisksVerticals and SellSignal <> SellSignal[1] and SellSignal  and (BuySignal[1] or BuyStop[1] or SellStop[1] )  , "Risk Off", Color.MAGENTA);
AddVerticalLine(ShowRisksVerticals and posdir < 0 and BuyStop <> BuyStop[1] and BuyStop  and (BuySignal[1] or SellSignal[1] or SellStop[1] ) , "Buy Stops", Color.white);
AddVerticalLine(ShowRisksVerticals and posdir > 0 and SellStop <> SellStop[1] and SellStop  and  (BuySignal[1] or SellSignal[1] or BuyStop[1] ) , "Sell Stops", Color.white);


def pbm = if buymodeprice <> buymodeprice[1] then buymodeprice[1] else pbm[1];
def psm =  if sellmodeprice <> sellmodeprice[1] then sellmodeprice[1] else psm[1];

input ShowTrendModeShiftVerticals = yes;
AddVerticalLine(ShowTrendModeShiftVerticals and buymodeprice > buymodeprice[1] and buymodeprice[1] > pbm[1], "         Trend Shift", Color.LIME);
AddVerticalLine(ShowTrendModeShiftVerticals and sellmodeprice < sellmodeprice[1] and sellmodeprice[1] < psm[1], "      Trend Shift", Color.MAGENTA);

def  trendswitchmodeprice = if (buymodeprice > buymodeprice[1] and buymodeprice[1] > pbm[1]) or (sellmodeprice < sellmodeprice[1] and sellmodeprice[1] < psm[1] ) then close else trendswitchmodeprice[1];
plot TrendFlip = if trendswitchmodeprice == trendswitchmodeprice[1] or trendswitchmodeprice == trendswitchmodeprice[-1] then trendswitchmodeprice else Double.NaN;
TrendFlip.SetPaintingStrategy(PaintingStrategy.HORIZONTAL);

TrendFlip.assignValueColor(if buymodeprice > buymodeprice[1] and buymodeprice[1] > pbm[1] then Color.yellow else color.cyan);
TrendFlip.SetStyle(Curve.MEDIUM_DASH );
TrendFlip.SetLineWeight(2);

def highestclosehigh = if trend > 0 and close >  if isnan(highestclosehigh[1]) then high else highestclosehigh[1]  then high else if  trend < 0 and trend[1] > 0 then high else  highestclosehigh[1];

def highestclosehighlow = if highestclosehigh <> highestclosehigh[1] then low else highestclosehighlow[1];

plot hcl = if trend > 0  then  highestclosehighlow else double.nan;

hcl.SetPaintingStrategy(PaintingStrategy.HORIZONTAL);
hcl.SetDefaultColor(color.yellow);
hcl.assignvalueColor(if close < highestclosehighlow then color.gRAY else color.current);


def lowestcloselow = if trend < 0 and close <  if isnan(lowestcloselow[1]) then low else lowestcloselow[1]  then low else if  trend > 0 and trend[1] < 0 then low else  lowestcloselow[1];

def lowestcloselowhigh = if lowestcloselow <> lowestcloselow[1] then high else lowestcloselowhigh[1];

plot lch = if trend < 0  then  lowestcloselowhigh else double.nan;
lch.SetPaintingStrategy(PaintingStrategy.HORIZONTAL);
lch.SetDefaultColor(color.magenta);
lch.assignvalueColor(if close > lowestcloselowhigh then color.gRAY else color.current);


input ShowRiskFadeBubble = yes;
AddChartBubble(ShowRiskFadeBubble and  (high < sell and trend < 0  and  low crosses above lowestcloselowhigh ) or (low > buy and trend > 0   and high crosses below highestclosehighlow) , if trend > 0 then lowest(close,natr)[1] else highest(high,natr)[1], if trend > 0  then  "Risk On" else if  trend < 0  then  "Risk Off" else "", if  trend > 0 then Color.gray else Color.gray, if  trend > 0 then 0 else 1);


input trade_odds_Labels = yes;
input useAlerts = no;
input showSignals = yes;
input showSignalLines = yes;
input showSignalBubbles = yes;
input showBubbles = yes;
input useStops = yes;


#######################################
##  Maintain the position of trades
#######################################

def CurrentPosition;  # holds whether flat = 0 long = 1 short = -1

if (BarNumber() == 1) or IsNaN(CurrentPosition[1]) {
    CurrentPosition = 0;
} else {
 if CurrentPosition[1] == 1 {      # LONG
        if (SellSignal) {
            CurrentPosition = -1;
        } else if (BuyStop) {
            CurrentPosition = 0;
        } else {
            CurrentPosition = CurrentPosition[1];
        }
    } else if CurrentPosition[1] == -1 {     # SHORT
        if (BuySignal) {
            CurrentPosition = 1;
        } else if (SellStop) {
            CurrentPosition = 0;
        } else {
            CurrentPosition = CurrentPosition[1];
        }
    } else  
if CurrentPosition[1] == 0 {            # FLAT

        if (BuySignal) {
            CurrentPosition = 1;
        } else if (SellSignal) {
            CurrentPosition = -1;
        } else {
            CurrentPosition = CurrentPosition[1];
        }
    } else {
        CurrentPosition = CurrentPosition[1];
    }
}

def isLong  = if CurrentPosition == 1 then 1 else 0;
def isShort = if CurrentPosition == -1 then 1 else 0;
def isFlat  = if CurrentPosition == 0 then 1 else 0;

# If not already long and get a BuySignal
plot BuySig = if (!isLong[1] and BuySignal and showSignals) then 1 else 0;
BuySig.AssignValueColor(Color.CYAN);
BuySig.SetPaintingStrategy(PaintingStrategy.BOOLEAN_ARROW_UP);
BuySig.SetLineWeight(5);

Alert(BuySig and useAlerts, "Buy Signal", Alert.BAR, Sound.Ding);

# If not already short and get a SellSignal
plot SellSig = if (!isShort[1] and SellSignal and showSignals) then 1 else 0;
SellSig.AssignValueColor(Color.CYAN);
SellSig.SetPaintingStrategy(PaintingStrategy.BOOLEAN_ARROW_DOWN);
SellSig.SetLineWeight(5);

Alert(SellSig and useAlerts, "Sell Signal", Alert.BAR, Sound.Ding);

# If long and get a BuyStop
plot BuyStpSig = if (CurrentPosition == 0 and isLong[1] and showSignals and useStops) then 1 else 0;
BuyStpSig.AssignValueColor(Color.LIGHT_GRAY);
BuyStpSig.SetPaintingStrategy(if showSignalLines then PaintingStrategy.dASHES else PaintingStrategy.BOOLEAN_ARROW_DOWN);
BuyStpSig.SetLineWeight(3);

# If short and get a SellStop
plot SellStpSig = if (CurrentPosition == 0 and isShort[1] and showSignals and useStops) then 1 else 0;
SellStpSig.AssignValueColor(Color.LIGHT_GRAY);
SellStpSig.SetPaintingStrategy(if showSignalLines then PaintingStrategy.dASHES else PaintingStrategy.BOOLEAN_ARROW_UP);
SellStpSig.SetLineWeight(3);
#######################################
## Orders
#######################################

def isOrder = if CurrentPosition == CurrentPosition[1] then 0 else 1; # Position changed so it's a new order

# If there is an order, then the price is the next days close
def orderPrice = if (isOrder and (BuySignal or SellSignal)) then open[-1] else orderPrice[1];


def prevpricelevel = if orderPrice <> orderPrice[1] then orderPrice[1] else prevpricelevel[1];

plot OrderEntry = orderPrice;
OrderEntry.SetPaintingStrategy(PaintingStrategy.dASHES);
OrderEntry.SetDefaultColor(color.cyan);


input showVerticalSignals = yes;

addverticalLine(showverticalsignals and CurrentPosition<>CurrentPosition[1], if isFlat then "Flat" else if isShort then "Short" else if islong then "Long" else "",
if isFlat then color.gray else if isShort then color.magenta else if islong then color.lime else color.white);
AddChartBubble(showSignalBubbles and BuySig, low, "B@ " + orderprice,color.lime, 0);
AddChartBubble(showSignalBubbles and SellSig, high, "S@ " + orderprice,color.magenta, 0);
AddChartBubble(showSignalBubbles and SellStpSig, high, "Sell Stop@ " + orderprice,color.gray, 0);
AddChartBubble(showSignalBubbles and BuyStpSig, low, "Buy Stop@ " + orderprice,color.gray, 0);


#######################################
## Price and Profit
#######################################


def profitLoss;

if (!isOrder or orderPrice[1] == 0)   {
    profitLoss = 0;
} else if  (isOrder ) and (isflat[1] ) {
    profitLoss = 0;
} else if  (!isLong   and isOrder ) and (isLong[1] ) {
    profitLoss = open[-1] - orderPrice[1];
} else if (!isShort  and isOrder ) and (isShort[1] ) {
    profitLoss = orderPrice[1] - open[-1];
} else {
    profitLoss = 0;
}


def  ShortsProfitsSum = CompoundValue(1, if IsNaN(isOrder) or BarNumber() == 1 then 0 else if isOrder and isShort[1] then ShortsProfitsSum[1] + if isnan(profitLoss) then 0 else if profitLoss > 0 then profitLoss else 0 else ShortsProfitsSum[1], 0);
def  ShortsLossSum = CompoundValue(1, if IsNaN(isOrder) or BarNumber() == 1 then 0 else if isOrder and isShort[1] then ShortsLossSum[1] + if isnan(profitLoss) then 0 else if profitLoss < 0 then profitLoss else 0 else ShortsLossSum[1], 0);

def dollarShortsLossSum = Round((ShortsLossSum / TickSize()) * TickValue())  ;
def dollarShortsProfitsSum = Round((ShortsProfitsSum / TickSize()) * TickValue())  ;

def  LongsProfitsSum = CompoundValue(1, if IsNaN(isOrder) or BarNumber() == 1 then 0 else if isOrder and islong[1] then LongsProfitsSum[1] + if isnan(profitLoss) then 0 else if profitLoss > 0 then profitLoss else 0 else LongsProfitsSum[1], 0);
def  LongsLossSum = CompoundValue(1, if IsNaN(isOrder) or BarNumber() == 1 then 0 else if isOrder and islong[1] then LongsLossSum[1] + if isnan(profitLoss) then 0 else if profitLoss < 0 then profitLoss else 0 else LongsLossSum[1], 0);
def dollarLongsProfitsSum = Round((LongsProfitsSum / TickSize()) * TickValue())  ;
def dollarLongsLossSum = Round((LongsLossSum / TickSize()) * TickValue())  ;


# Total Profit or Loss
def profitLossSum = CompoundValue(1, if IsNaN(isOrder) or BarNumber() == 1 then 0 else if isOrder then profitLossSum[1] + if isnan(profitLoss) then 0 else profitLoss else profitLossSum[1], 0);

def  LossSum = CompoundValue(1, if IsNaN(isOrder) or BarNumber() == 1 then 0 else if isOrder then LossSum[1] + if isnan(profitLoss) then 0 else if profitLoss < 0 then profitLoss else 0 else LossSum[1], 0);

def  ProfitSum = CompoundValue(1, if IsNaN(isOrder) or BarNumber() == 1 then 0 else if isOrder then ProfitSum[1] + if isnan(profitLoss) then 0 else if profitLoss > 0 then profitLoss else 0 else ProfitSum[1], 0);
def dollarLossSum = Round((LossSum / TickSize()) * TickValue())  ;
def dollarProfitSum = Round((ProfitSum / TickSize()) * TickValue())  ;

# Current Open Trade Profit or Loss
def TradePL = if isLong then Round(((close - orderPrice) / TickSize()) * TickValue()) else if isShort then Round(((orderPrice - close) / TickSize()) * TickValue()) else 0;

# How many trades won or lost
def profitWinners = CompoundValue(1, if IsNaN(profitWinners[1]) or BarNumber() == 1 then 0 else if isOrder and !isflat[1] and profitLoss > 0 then profitWinners[1] + 1 else profitWinners[1], 0);
def profitLosers = CompoundValue(1, if IsNaN(profitLosers[1]) or BarNumber() == 1 then 0 else if isOrder and !isflat[1] and profitLoss < 0 then profitLosers[1] + 1 else profitLosers[1], 0);
def profitPush = CompoundValue(1, if IsNaN(profitPush[1]) or BarNumber() == 1 then 0 else if isOrder and !isflat[1] and profitLoss == 0 then profitPush[1] + 1 else profitPush[1], 0);


#########################
#########################
# Math
#########################
#########################
# Convert to actual dollars based on Tick Value for bubbles
def dollarProfitLoss = if orderPrice[1] == 0 or IsNaN(orderPrice[1]) then 0 else Round((profitLoss / TickSize()) * TickValue());

# Closed Orders dollar P/L
def dollarPLSum = Round((profitLossSum / TickSize()) * TickValue())  ;

# Split profits or losses by long and short trades
def profitLong = CompoundValue(1, if IsNaN(profitLong[1]) or BarNumber() == 1 then 0 else if isOrder and isLong[1] then profitLong[1] + dollarProfitLoss else profitLong[1], 0);
def profitShort = CompoundValue(1, if IsNaN(profitShort[1]) or BarNumber() == 1 then 0 else if isOrder and isShort[1] then profitShort[1] + dollarProfitLoss else profitShort[1], 0);
def countLong = CompoundValue(1, if IsNaN(countLong[1]) or BarNumber() == 1 then 0 else if isOrder and isLong[1] then countLong[1] + 1 else countLong[1], 0);
def countShort = CompoundValue(1, if IsNaN(countShort[1]) or BarNumber() == 1 then 0 else if isOrder and isShort[1] then countShort[1] + 1 else countShort[1], 0);

# What was the biggest winning and losing trade
def biggestWin = CompoundValue(1, if IsNaN(biggestWin[1]) or BarNumber() == 1 then 0 else if isOrder and (dollarProfitLoss > 0) and (dollarProfitLoss > biggestWin[1]) then dollarProfitLoss else biggestWin[1], 0);
def biggestLoss = CompoundValue(1, if IsNaN(biggestLoss[1]) or BarNumber() == 1 then 0 else if isOrder and (dollarProfitLoss < 0) and (dollarProfitLoss < biggestLoss[1]) then dollarProfitLoss else biggestLoss[1], 0);

def orderCount = CompoundValue(1, if IsNaN(orderCount[1]) or BarNumber() == 1 then 0 else if (isOrder and !isOrder[1]) then orderCount[1] + 1 else orderCount[1], 0);
#def orderCount = (profitWinners+profitLosers);

# What percent were winners
def PCTWin = Round((profitWinners / (profitWinners+profitLosers)) * 100, 2);

# Average trade
def avgTrade = Round((dollarPLSum / (orderCount/2 )), 2);

#######################################
## Win / Loss labels
#######################################
AddLabel(ShowLabels and trade_odds_Labels, "Closed Orders: " + orderCount/2 ,  Color.white );
AddLabel(ShowLabels and trade_odds_Labels,  " P/L: " + AsDollars(dollarPLSum), if dollarPLSum > 0 then Color.GREEN else if dollarPLSum < 0 then Color.YELLOW else Color.GRAY);
AddLabel(ShowLabels and trade_odds_Labels,  " Profit Sum: " + AsDollars(dollarProfitSum), if dollarProfitSum > 0 then Color.GREEN else if dollarProfitSum < 0 then Color.YELLOW else Color.GRAY);
AddLabel(ShowLabels and trade_odds_Labels,  " Loss Sum: " + AsDollars(dollarLossSum), if dollarLossSum > 0 then Color.GREEN else if dollarLossSum < 0 then Color.YELLOW else Color.GRAY);


AddLabel(ShowLabels and if !IsNaN(orderPrice) and trade_odds_Labels then 1 else 0, "Closed+Open P/L: " + AsDollars(TradePL + dollarPLSum), if ((TradePL + dollarPLSum) > 0) then Color.GREEN else if ((TradePL + dollarPLSum) < 0) then Color.YELLOW else Color.GRAY);


AddLabel(ShowLabels and trade_odds_Labels, "Longs Profit Sum: " + AsDollars(dollarLongsProfitsSum), if dollarLongsProfitsSum > 0 then Color.GREEN else if dollarLongsProfitsSum < 0 then Color.YELLOW else Color.GRAY);

AddLabel(ShowLabels and trade_odds_Labels, "Longs Loss Sum: " + AsDollars(dollarLongsLossSum), if dollarLongsLossSum > 0 then Color.GREEN else if dollarLongsLossSum < 0 then Color.YELLOW else Color.GRAY);
#
#

AddLabel(ShowLabels and trade_odds_Labels, "Shorts Profit Sum: " + AsDollars(dollarShortsProfitsSum), if dollarShortsProfitsSum > 0 then Color.GREEN else if dollarShortsProfitsSum < 0 then Color.YELLOW else Color.GRAY);
AddLabel(ShowLabels and trade_odds_Labels, "Shorts Loss Sum: " + AsDollars(dollarShortsLossSum), if dollarShortsLossSum > 0 then Color.GREEN else if dollarShortsLossSum < 0 then Color.YELLOW else Color.GRAY);


AddLabel(ShowLabels and trade_odds_Labels, "Avg per Trade: " + AsDollars(avgTrade), if avgTrade > 0 then Color.GREEN else if avgTrade < 0 then Color.YELLOW else Color.GRAY);
AddLabel(ShowLabels and trade_odds_Labels, "Winners: " + PCTWin + "%", if PCTWin > 50 then Color.GREEN else if PCTWin > 40 then Color.YELLOW else Color.GRAY);

AddLabel(ShowLabels and trade_odds_Labels, "MaxUp: " + AsDollars(biggestWin) + " MaxDown: " + AsDollars(biggestLoss), Color.WHITE);

AddLabel(ShowLabels and  if !IsNaN(CurrentPosition) and trade_odds_Labels then 1 else 0, "Open: " + (if isLong then "Bought" else "Sold") + " @ " + orderPrice, Color.WHITE);
AddLabel(ShowLabels and if !IsNaN(orderPrice) and trade_odds_Labels then 1 else 0, "Open Trade P/L: " + AsDollars(TradePL), if (TradePL > 0) then Color.GREEN else if (TradePL < 0) then Color.YELLOW else Color.GRAY);

def RTHstart = if  SecondsFromTime(0930) == 0 then 1 else  getday() <> getday()[1]; 
def daysOnChart = if RTHstart
then compoundValue(1, daysOnChart[1] + 1, 1)
else daysOnChart[1];
addLabel(trade_odds_Labels, "Days on Chart: " + daysOnChart, color.cyan);
#######################################
##  Bubbles for Profit/Loss
#######################################

AddChartBubble(showSignals and showBubbles and isOrder and isLong[1], low, "$" + dollarProfitLoss, if dollarProfitLoss == 0 then Color.LIGHT_GRAY else if dollarProfitLoss > 0 then Color.GREEN else Color.WHITE, 0);
AddChartBubble(showSignals and showBubbles and isOrder and isShort[1], high, "$" + dollarProfitLoss, if dollarProfitLoss == 0 then Color.LIGHT_GRAY else if dollarProfitLoss > 0 then Color.GREEN else Color.white, 1);


AddChartBubble(showSignals and showBubbles and !isOrder and (islong or isshort) and !IsNaN(orderprice)  and IsNaN(close [-1] ) and  !IsNaN(close) and HighestAll(BarNumber()) and TradePL> 0, orderprice, "$" +TradePL, if  TradePL == 0 then Color.LIGHT_GRAY else if TradePL > 0 then Color.light_GREEN else Color.pink, 1);


#######################################
##  Start - Strategy Orders
#######################################
## Comment or remove the orders below and save as a study

AddOrder(OrderType.BUY_AUTO, EnableStrategy and activerange and ActiveTradeTime and BuySignal, name = if OrderSimbol then "B" else " B(*)@ "  + open[-1], price = open[-1], tickcolor = GetColor(6), arrowcolor = GetColor(6));
AddOrder(OrderType.SELL_AUTO, EnableStrategy and activerange and ActiveTradeTime and SellSignal, name = if OrderSimbol then "S" else  " S(*)@ "  + open[-1], price = open[-1], tickcolor = GetColor(8), arrowcolor = GetColor(8));

AddOrder(OrderType.BUY_TO_CLOSE, EnableStrategy and activerange and ActiveTradeTime  and SellStop , name = if OrderSimbol then "Bx" else  " B(x)@ "  + open[-1], price = open[-1], tickcolor = GetColor(9), arrowcolor = GetColor(9));
AddOrder(OrderType.SELL_TO_CLOSE, EnableStrategy and activerange and ActiveTradeTime and BuyStop, name = if OrderSimbol then "Sx" else  " S(x)@ "  + open[-1], price = open[-1], tickcolor = GetColor(7), arrowcolor = GetColor(7));
#######################################
##  End - Strategy Orders
#######################################
 
Last edited:
Inspired by the post https://usethinkscript.com/threads/...acktesting-data-utility-for-thinkorswim.1624/


I came up with this solution when I wanted to backtest the indicators combined with other strategies, multiple positions, reentries and risk management..
All strategies combined on the chart with stops and or multiple contracts are calculated and are all in sync with the strategy reports.

The code below is a standalone/decoupled “strategy dashboard”, It seems that a script compiled as a study vs strategy is contained in differently, the key is that it must and should be created as a “Dummy” strategy in TOS, saved and named as your dashboard than add to the chart combined with all other strategies and studies.

View attachment 20387View attachment 20387
Example below: is a predefined strategy in TOS
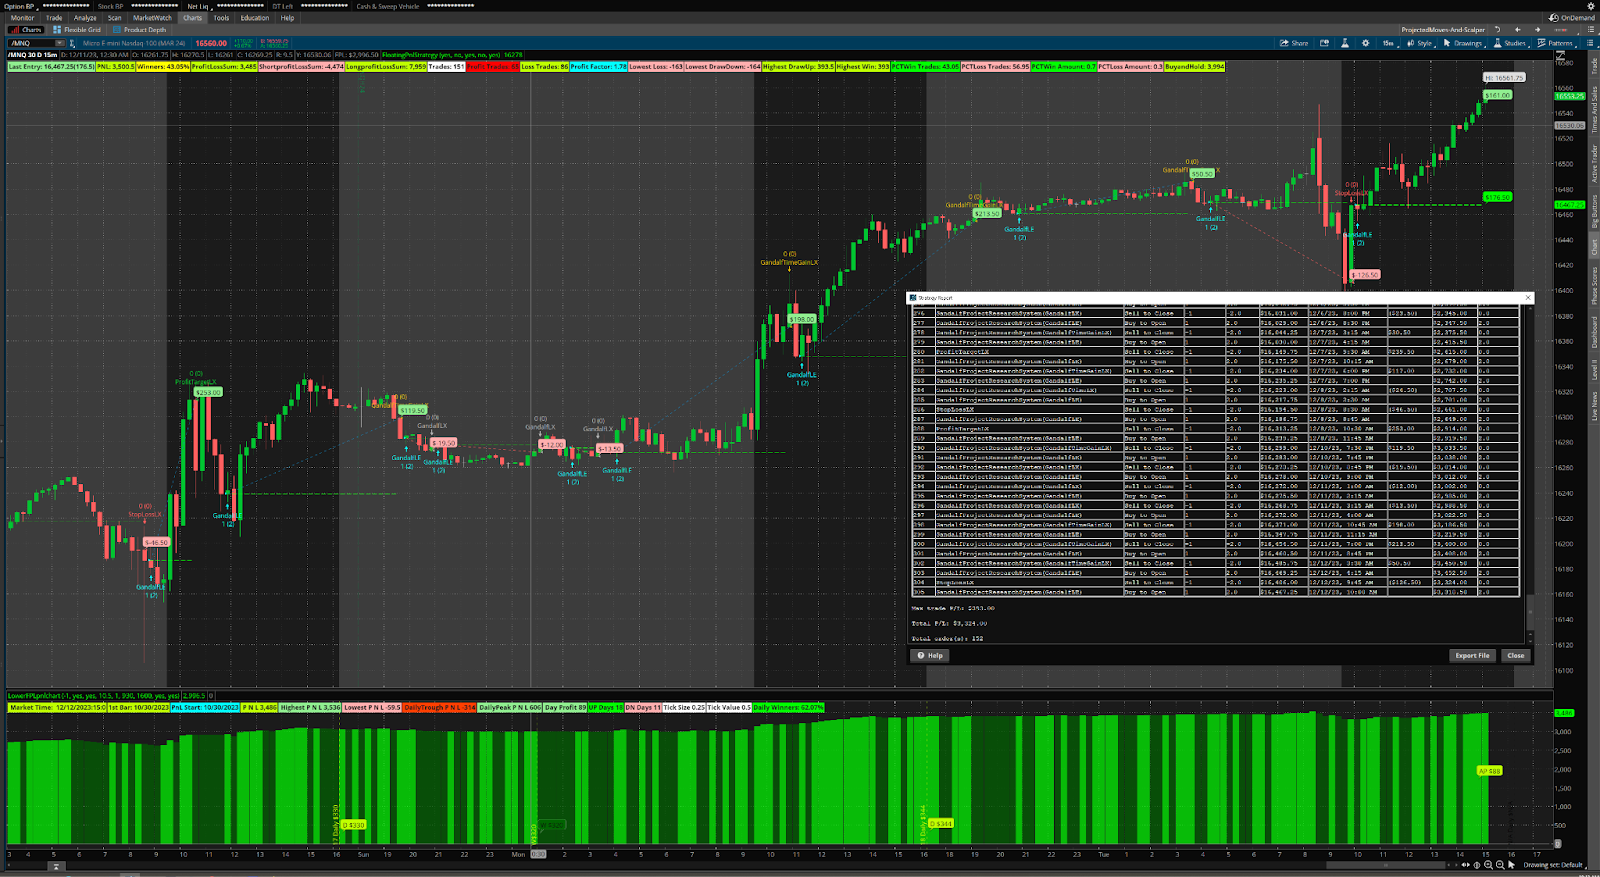
GandalfProjectResearchSystem​


W6_nqDYUhrHtJj9TEYMQCTmhrf_F8l7YogWlfpGn0HCg_c-lnE1WBVZAxNW_w0YKWh8-sdXSYyj45wk7R1pASazoMsJV5laOKlbUNgXQ2owJK_iAkawiFgo6HIrOAiZdmOUyxzd6DGIYi1dzpA1vilU


7leICLhMZ_WZusX042ER-GHH9uoRL7VytM4oNljstHdPxgp2cfvmhtD0VFlKHklzYE-P31Kql37n8WmEdAT_lALhEmp3BcZZa4-vy43S-RvBYWp94Cg22yqzLU6A8ZwLnCnQ9sRdA4ARDxm3V8xKAjA


Paste the script below and save as a strategy: FloatingPnlStrategy or any name...
Python:
#######################################
##  START of Strategies DashBoard
#######################################
addOrder(OrderType.BUY_AUTO, no);

input ShowStrategyCurrentPnlBubble = yes;
input ShowStrategyPnlBubble = no;
input ShowStrategyPnlEntryBubble = yes;
input ShowStrategyPnlVertical = no;
Input ShowStrategyProfitLossLabels = yes;
def fpl = FPL();
def StrategyEntryprice = if IsNaN(EntryPrice())  then 0 else EntryPrice();
def ep = entryprice();
def poschange = ( StrategyEntryprice <> StrategyEntryprice[1] and StrategyEntryprice == 0 ) or (  StrategyEntryprice <> StrategyEntryprice[1] and StrategyEntryprice[1] == 0  )   or (  StrategyEntryprice <> StrategyEntryprice[1] and StrategyEntryprice[1] > 0   and StrategyEntryprice[0] > 0 );
def pnlentry =  if  poschange  then  fpl[1] else pnlentry[1];
def currentprofit = fpl() - pnlentry[1];
def pnlprofit =  if pnlentry <> pnlentry[1] then  fpl()[1] - pnlentry[1] else 0  ;
def entryprofit = (if pnlprofit> 0 then 1 else -1 )  * absValue( if  poschange  then if StrategyEntryprice == 0 then open[0] - ep[1] else ep-ep[1] else 0) ;
def dollarentryprofitloss = Round(((entryprofit ) / TickSize()) * TickValue());

AddChartBubble(ShowStrategyPnlEntryBubble and poschange and absValue(dollarentryprofitloss  )>0, open[0], AsDollars(dollarentryprofitloss[0]), if dollarentryprofitloss[0] > 0 then Color.light_GREEN else if  dollarentryprofitloss[0] < 0 then Color.pink else Color.BLUE);
AddVerticalLine(ShowStrategyPnlVertical and ShowStrategyPnlEntryBubble and poschange, AsDollars(fpl) + " (" + dollarentryprofitloss + ")" ,  if dollarentryprofitloss > 0 then Color.GREEN else if dollarentryprofitloss < 0 then Color.RED else if pnlentry == 0 then Color.WHITE else Color.CYAN);

def fplpnlprofit = pnlprofit;
AddChartBubble(ShowStrategyPnlBubble and poschange[0] and absValue(fplpnlprofit  )>0, open[0], AsDollars(fplpnlprofit[0]), if fplpnlprofit[0] > 0 then Color.GREEN else if  fplpnlprofit[0] < 0 then Color.RED else Color.BLUE);
AddVerticalLine(ShowStrategyPnlVertical and ShowStrategyPnlBubble and poschange, AsDollars(fpl) + " (" + pnlprofit + ")" ,  if pnlprofit > 0 then Color.GREEN else if pnlprofit < 0 then Color.RED else if pnlentry == 0 then Color.WHITE else Color.CYAN);
def lastentry =if isnan( entryprice()) then lastentry[1] else entryprice() ;
AddChartBubble(ShowStrategyCurrentPnlBubble  and !IsNaN(close) and IsNaN(close [-1] ) and HighestAll(BarNumber()) and absValue(currentprofit)> 0, lastentry, AsDollars(currentprofit[0]), if currentprofit[0] > 0 then Color.green else if  currentprofit[0] < 0 then Color.red else Color.BLUE);

def pl = if ShowStrategyPnlEntryBubble then if isnan( dollarentryprofitloss) then 0 else dollarentryprofitloss else if isnan(fplpnlprofit) then 0 else fplpnlprofit;
def StrategyLongprofitLossSum = CompoundValue(1, if BarNumber() == 1 then 0 else if pl > 0 then StrategyLongprofitLossSum[1] + pl[0] else StrategyLongprofitLossSum[1], 0);
def StrategyShortprofitLossSum = CompoundValue(1, if BarNumber() == 1 then 0 else if pl < 0 then StrategyShortprofitLossSum[1] + pl[0] else StrategyShortprofitLossSum[1], 0);
def StrategyProfittradecnt = if  BarNumber() == 1 then 0 else if pl > 0 then StrategyProfittradecnt[1] + 1 else StrategyProfittradecnt[1] ;
def Strategylosstradecnt = if  BarNumber() == 1 then 0 else if pl < 0 then Strategylosstradecnt[1] + 1 else Strategylosstradecnt[1] ;
def Strategytradecnt = StrategyProfittradecnt + Strategylosstradecnt;

# What percent were winners
def StrategyPCTWin = Round(((StrategyProfittradecnt) / (Strategytradecnt)) * 100, 2) ;
def StrategyPCTLoss = Round(((Strategylosstradecnt) / (Strategytradecnt)) * 100, 2) ;
def StrategyPCTWinamt = Round(((absValue(StrategyLongprofitLossSum/StrategyProfittradecnt)) /absValue( (StrategyLongprofitLossSum/StrategyProfittradecnt) + absValue(StrategyShortprofitLossSum/Strategytradecnt))) * 1, 2) ;
def PCTLossamt =  Round(((absValue(StrategyShortprofitLossSum/Strategylosstradecnt)) /absValue( (StrategyLongprofitLossSum/StrategyProfittradecnt) + absValue(StrategyShortprofitLossSum/Strategytradecnt))) * 1, 2) ;
plot PltEntryPrice = ep;
PltEntryPrice.SetPaintingStrategy(PaintingStrategy.DASHES);
PltEntryPrice.SetdefaultColor(color.cyan);
PltEntryPrice.assignValueColor(if currentprofit then color.green else
if entryprofit < 0 then color.red else color.cyan );


def Strategylowestdrawdown =  min(if isnan(currentprofit) then 0 else currentprofit,Strategylowestdrawdown[1]);
def StrategyHigestdrawUp =  max(if isnan(currentprofit) then 0 else currentprofit,StrategyHigestdrawUp[1]);
def Strategylowestloss = min(pl,Strategylowestloss[1]);
def highestwin = max(pl,highestwin[1]);
AddLabel(ShowStrategyProfitLossLabels ,  "Last Entry: "+lastentry +"("+currentprofit +")" ,if currentprofit > 0 then color.light_green else if currentprofit < 0 then color.light_red else color.cyan );
AddLabel(ShowStrategyProfitLossLabels, "PNL: " + (FPL()), if FPL() > 0 then Color.LIME else Color.RED);
AddLabel(ShowStrategyProfitLossLabels, "Winners: " + StrategyPCTWin + "%", if StrategyPCTWin > 50 then Color.GREEN else if StrategyPCTWin > 40 then Color.YELLOW else Color.GRAY);
AddLabel(ShowStrategyProfitLossLabels, "ProfitLossSum: " + (StrategyLongprofitLossSum + StrategyShortprofitLossSum), if (StrategyLongprofitLossSum + StrategyShortprofitLossSum) > 0 then Color.LIME else Color.RED);
AddLabel(ShowStrategyProfitLossLabels, "StrategyShortprofitLossSum: " + (StrategyShortprofitLossSum), Color.pink);
AddLabel(ShowStrategyProfitLossLabels, "StrategyLongprofitLossSum: " + (StrategyLongprofitLossSum), Color.LIME);
AddLabel(ShowStrategyProfitLossLabels, "Trades: " + (Strategytradecnt), Color.WHITE);
AddLabel(ShowStrategyProfitLossLabels, "Profit Trades: " + (StrategyProfittradecnt), if StrategyProfittradecnt > Strategylosstradecnt then Color.LIME else Color.RED);
AddLabel(ShowStrategyProfitLossLabels, "Loss Trades: " + (Strategylosstradecnt), if StrategyProfittradecnt < Strategylosstradecnt then Color.LIME else Color.pink);
AddLabel(ShowStrategyProfitLossLabels, "Profit Factor: " +round(absvalue (StrategyLongprofitLossSum/StrategyShortprofitLossSum)),color.cyan);
AddLabel(ShowStrategyProfitLossLabels, "Lowest Loss: " + (Strategylowestloss), Color.pink);
AddLabel(ShowStrategyProfitLossLabels, "Lowest DrawDown: " + (Strategylowestdrawdown), Color.pink);
AddLabel(ShowStrategyProfitLossLabels, "Highest DrawUp: " + (StrategyHigestdrawUp), Color.LIME);
AddLabel(ShowStrategyProfitLossLabels, "Highest Win: " + (highestwin), Color.LIME);
AddLabel(ShowStrategyProfitLossLabels, "StrategyPCTWin Trades: " + (StrategyPCTWin), Color.GREEN);
AddLabel(ShowStrategyProfitLossLabels, "StrategyPCTLoss Trades: " + (StrategyPCTLoss), Color.PINK);
AddLabel(ShowStrategyProfitLossLabels, "StrategyPCTWin Amount: " + (StrategyPCTWinamt), Color.GREEN);
AddLabel(ShowStrategyProfitLossLabels, "StrategyPCTLoss Amount: " + (PCTLossamt), Color.PINK);

def firstentry = if Strategytradecnt ==1 then close[1] else firstentry[1];
def buyandhold = Round(((close - firstentry ) / TickSize()) * TickValue());
AddLabel(ShowStrategyProfitLossLabels, "BuyandHold: " + (buyandhold), if buyandhold > 0 then Color.LIME else Color.RED);


#######################################
##  END of Strategy DashBoard
#######################################
#endofcode


The Lower study dashboard is an extended P&L with daily and weekly subtotals and also to monitor the progress of the computation stream by checking the total up and down days vs the number of days selected for the chart. Sometimes TOS performance is so slow it seems it's compiling on a 286


5rYrR7PP0lMQKciocP2Ow7Q5rA4NmEjPx87falalUIWlAIJwNGelBvFvSb6iEwhWeJ3XY7qP4TTUZL25HkAMNN_UD32CIheVS3T87W8Id1swelVQwNXWaFdcMwhus5IoIJIPCavAAu7fBUtxSEYv3Ug

Paste the script below and save as a study: LowerFPLpnlchart
Python:
declare lower;
input Offset = -1;
def LastBar = !IsNaN(open) and IsNaN(open [-1] ) ;
def lastBubbleLocation = LastBar[Offset];
input ShowTime = no;
input ShowFromDate = no;
input TimeZone = 10.5;
def Hours = Floor(TimeZone + SecondsFromTime(0930) / 60 / 60) - 1;
def Minutes = ((TimeZone + SecondsFromTime(930) / 60 / 60) % 1) * 60;
AddLabel(ShowTime, " Market Time:  " + GetMonth() + "/" +  GetDayOfMonth(GetYYYYMMDD()) + "/"  + (AsPrice(GetYear()))  + ":" + Hours + ":" + Minutes ,
             if !IsNaN(GetTime())
             then Color.LIME
             else if IsNaN(GetTime())
                  then Color.PINK
                  else Color.WHITE);
# Defines the hours from last bar till end-of-day (midnight) on an intra-day chart
input time = 0001;# Is midnight which is the start of counting seconds in the functions below.
def TimeFrom = SecondsFromTime(time);# Returns the seconds from 'time'. If not an intra-day chart, returns 0.

def TimeLeft = SecondsTillTime(time);# Returns the seconds till input 'time'. If not an intra-day chart, returns 0.

#AddLabel(1, "Time from last bar till end-of-day (midnight) = " + (Round( (24 + (TimeLeft / 3600)), 1)) + " Hours", Color.WHITE);
def startdate = if   TOTALSUM(FPL()) <>  0 == 0 and TOTALSUM(FPL())[1]== 0 then 1 else 0;;
def startmonth = if startdate then GetMonth() else startmonth[1];
def startday = if startdate then GetDayOfMonth(GetYYYYMMDD()) else startday[1];
def startyear = if startdate then GetYear() else startyear[1];
def from_dayofmonth = if BarNumber() == 1 then GetDayOfMonth(GetYYYYMMDD()) else from_dayofmonth[1];
def from_month = if BarNumber() == 1 then GetMonth() else from_month[1];
def from_year  = if BarNumber() == 1 then GetYear() else from_year[1];
AddLabel(ShowFromDate, "1st Bar: " + from_month  + "/" + from_dayofmonth + "/"  + (AsPrice(from_year)),
             if !IsNaN(GetTime())
             then Color.LIME
             else if IsNaN(GetTime())
                  then Color.PINK
                  else Color.WHITE);
AddLabel(ShowFromDate, "PnL Start: " +asprice(startmonth) +"/" +asprice(startday) +"/" +asprice(startyear)  , color.cyan);
plot FPL = FPL();
plot ZeroLine = 0;
FPL.SetPaintingStrategy(PaintingStrategy.SQUARED_HISTOGRAM);
FPL.DefineColor("Positive and Up", Color.GREEN);
FPL.DefineColor("Positive and Down", Color.DARK_GREEN);
FPL.DefineColor("Negative and Down", Color.RED);
FPL.DefineColor("Negative and Up", Color.DARK_RED);
FPL.AssignValueColor(if FPL >= 0 then if FPL > FPL[1] then FPL.Color("Positive and Up") else FPL.Color("Positive and Down") else if FPL < FPL[1] then FPL.Color("Negative and Down") else FPL.Color("Negative and Up"));
ZeroLine.SetDefaultColor(Color.GRAY);
input TradeTimeStart = 0930;
input TradeTimeEnd = 1600;
input UseMarketTime = yes;
#################################################################################
##################################################################################
##################################################################################
def Active = if UseMarketTime then if SecondsTillTime(TradeTimeStart) <= 0 and
                           SecondsTillTime(TradeTimeEnd) >= 0  then 1 else 0
                    else if GetAggregationPeriod() == AggregationPeriod.DAY then 1 else 0;
##################################################################################
input showverticalprofits = yes;
def weeklybalance  =  if GetWeek()[1] != GetWeek() and GetLastWeek() != GetWeek()[1] then FPL() else weeklybalance[1] ;
def weeklyprofit = if GetWeek()[1] != GetWeek() and  GetLastWeek() != GetWeek()[1] then FPL() - weeklybalance[1] else weeklyprofit[1];
AddVerticalLine(showverticalprofits  and  GetWeek()[1] <> GetWeek() and GetLastWeek() != GetWeek()[1], "W$" + weeklyprofit , if weeklyprofit > 0 then Color.LIME else if weeklyprofit < 0 then Color.MAGENTA else Color.WHITE);
def dailybalance = if GetAggregationPeriod() < AggregationPeriod.DAY and Active[1] and !Active[0] then FPL() else if GetAggregationPeriod() == AggregationPeriod.DAY and GetDay() <> GetDay()[1] then FPL() else  dailybalance[1];
def dailyprofit = if Active[1] and !Active[0] and GetAggregationPeriod() < AggregationPeriod.DAY  then dailybalance - dailybalance[1] else if GetAggregationPeriod() == AggregationPeriod.DAY and GetDay() <> GetDay()[1]  then FPL() - FPL()[1] else   dailyprofit[1];
def activeprofit = if GetDay() == GetLastDay()  then FPL() - dailybalance[1] else activeprofit[1] ;
AddChartBubble(showverticalprofits and  GetAggregationPeriod() < AggregationPeriod.DAY  and Active[1] and !Active[0] , FPL() / 10, "D $" + dailyprofit  , if dailyprofit > 0 then Color.LIME else if dailyprofit < 0 then Color.MAGENTA else Color.WHITE, yes);
AddChartBubble(showverticalprofits and  GetAggregationPeriod() < AggregationPeriod.week and GetWeek()[1] != GetWeek() and GetLastWeek() != GetWeek()[1], FPL() / 10, "W $" + weeklyprofit  , if weeklyprofit > 0 then Color.dark_green else if weeklyprofit < 0 then Color.dark_red else Color.WHITE, yes);
AddChartBubble(showverticalprofits and lastBubbleLocation and  GetAggregationPeriod() == AggregationPeriod.DAY   , FPL() / 10, "Active D $" + activeprofit  , if activeprofit > 0 then Color.LIME else if activeprofit < 0 then Color.MAGENTA else Color.WHITE, yes);
AddChartBubble(showverticalprofits and  lastBubbleLocation and GetAggregationPeriod() < AggregationPeriod.DAY  , FPL() / 2, "AP $" + activeprofit  , if activeprofit > 0 then Color.LIME else if activeprofit < 0 then Color.MAGENTA else Color.WHITE, yes);
AddLabel(1, " P N L " + Round( FPL()) , if FPL() > 0 then  Color.lime else if FPL() < 0 then Color.magenta else Color.WHITE) ;
AddLabel(1, " Highest P N L " + Round( HighestAll(FPL())) , if HighestAll(FPL()) > 0 then  Color.light_GREEN else if HighestAll(FPL()) < 0 then Color.pink else Color.WHITE) ;
AddLabel(1, " Lowest P N L " + Round( LowestAll(FPL())) , if LowestAll(FPL()) > 0 then  Color.light_GREEN else if LowestAll(FPL()) < 0 then Color.pink else Color.WHITE) ;
AddLabel(1, " DailyTrough P N L " + Round( LowestAll(dailyprofit)) , if LowestAll(dailyprofit) > 0 then  Color.light_GREEN else if LowestAll(dailyprofit) < 0 then Color.light_RED else Color.WHITE) ;
AddLabel(1, " DailyPeak P N L " + Round( HighestAll(dailyprofit)) , if HighestAll(dailyprofit) > 0 then  Color.light_GREEN else if HighestAll(dailyprofit) < 0 then Color.light_RED else Color.WHITE) ;
AddLabel(1, " Day Profit " + activeprofit, if activeprofit > 0 then Color.light_GREEN else if activeprofit < 0 then Color.pink else Color.WHITE);
def dayupdays = if dailyprofit > 0 and GetDay()[1] != GetDay() and  GetLastDay() != GetDay()[1] and GetAggregationPeriod() == AggregationPeriod.DAY  then dayupdays[1] + 1 else if IsNaN(dayupdays[1]) then 0 else dayupdays[1] ;
def daydndays = if dailyprofit < 0 and GetDay()[1] != GetDay() and  GetLastDay() != GetDay()[1] and GetAggregationPeriod() == AggregationPeriod.DAY  then  daydndays[1] + 1 else if IsNaN(daydndays[1]) then 0 else daydndays[1];
def dp = dailyprofit;
def updays = if dp > 0 and Active[1] and !Active[0] and GetAggregationPeriod() < AggregationPeriod.DAY  then updays[1] + 1 else if IsNaN(updays[1]) then 0 else updays[1] ;
def dndays = if dp < 0 and Active[1] and !Active[0] and GetAggregationPeriod() < AggregationPeriod.DAY  then  dndays[1] + 1 else if IsNaN(dndays[1]) then 0 else dndays[1];
def updndays =  if dailyprofit > 0 then (updays) else if dailyprofit < 0 then (dndays) else 0;
AddVerticalLine(showverticalprofits and Active[1] and !Active[0] and GetAggregationPeriod() < AggregationPeriod.DAY , updndays +" Daily $" + (dailyprofit) , if dailyprofit > 0 then Color.LIME else if dailyprofit < 0 then Color.MAGENTA else Color.WHITE);
AddLabel(GetAggregationPeriod() < AggregationPeriod.DAY, "UP Days " + updays, if updays  > 0 then  Color.GREEN  else Color.WHITE) ;
AddLabel(GetAggregationPeriod() < AggregationPeriod.DAY, "DN Days " + dndays, if dndays  > 0 then  Color.PINK  else Color.WHITE) ;
AddLabel(GetAggregationPeriod() == AggregationPeriod.DAY, "UP Days " + dayupdays, Color.LIME);
AddLabel(GetAggregationPeriod() == AggregationPeriod.DAY, "DN Days " + daydndays, Color.MAGENTA);
AddLabel(1, "Tick Size " + TickSize(), Color.WHITE);
AddLabel(1, "Tick Value " + TickValue(), Color.WHITE);
def PCTWin = if GetAggregationPeriod() < AggregationPeriod.DAY then Round((updays / (updays + dndays)) * 100, 2) else Round((dayupdays / (dayupdays + daydndays)) * 100, 2);
AddLabel(GetAggregationPeriod() <= AggregationPeriod.DAY, "Daily Winners: " + PCTWin + "%", if PCTWin > 50 then Color.GREEN else if PCTWin > 40 then Color.YELLOW else Color.GRAY);
###endofcode

Example of a random selection TOS pre defined strategy (combine as many strategies to all be calculated together in the dashboard)
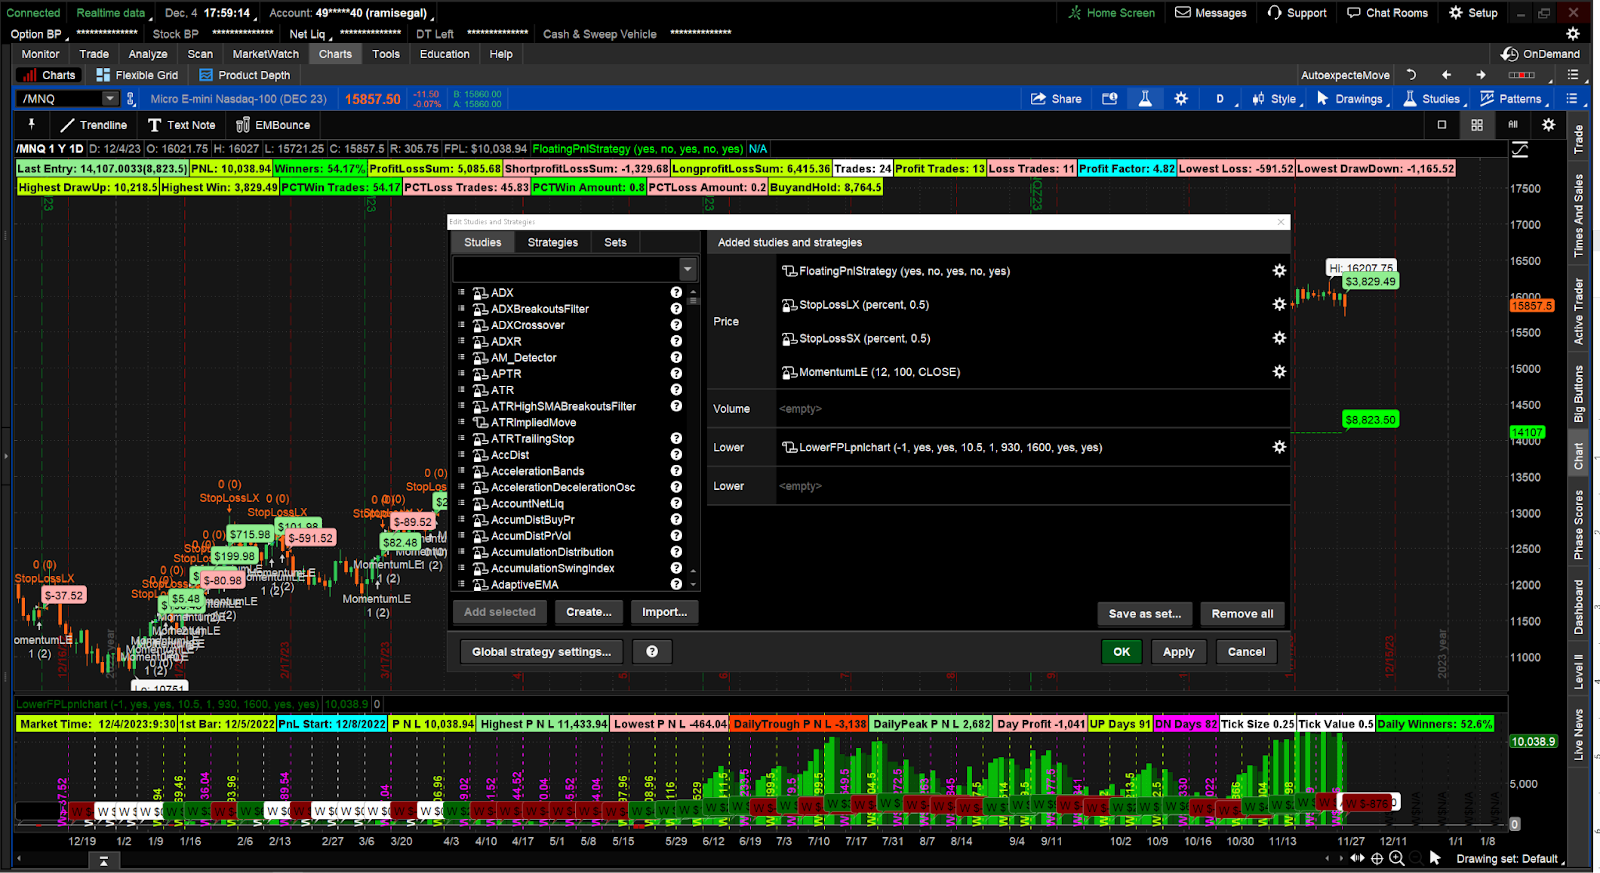
evcIgIZcH3zQon_QaRXCDDfZQpP9FChj5wWF6kZOY_f37dP7Yf_xH6IRjnEuwmO2oebQl7mXmDhekTOZEPySYkk20_sr8SpMnaFXPInrEtbHdYVpIRRxg_JhxqpEQHdsA3XjabCKt9doEAZCzGrQebI


This tool helped me develop my strategies. I debugged it over time. Let me know if you find any issues.

Hey @Ramisegal I see where there is cyan arrow and Gandalf indicators on the chart is there a way to scan for this?

check screenshot below!
This was in reference to the first script that was posted in the thread.

pasted image 0.png
 
Last edited by a moderator:
Sure, check screenshot below!

This was in reference to the first script that was posted in the thread.

View attachment 21125
San for the entry pattern is true...
def averagePrice = ohlc4;
def medianPrice = hl2;
def medianBodyPrice = MidBodyVal();

def entryGandaldfPattern = (averagePrice[1] < medianPrice[1] and
medianPrice[2] <= averagePrice[1] and
medianBodyPrice[2] <= averagePrice[3]) or
(averagePrice[1] < medianPrice[3] and
medianBodyPrice < medianPrice[2] and
medianBodyPrice[1] < medianBodyPrice[2]);
 
Okay I'm actually trying to test the first script and nothing is showing up on a study or strategy. Can you double check this. The original screenshot you have uploaded shows the gandalf signal. I don't see this signals in the updated ones. What am I doing wrong?

Is there anyway you can share a link for a scan?

It is a predefined strategy in TOS
GandalfProjectResearchSystem
The script is not provided in the post. It is available in TOS

The post is about the dashboard.
I will share a scan for the pattern when i get to my desktop.
 
Oh okay I see. Thanks @Ramisegal! I appreciate it!
#scan script:

def averagePrice = ohlc4;
def medianPrice = hl2;
def medianBodyPrice = MidBodyVal();

def entryGandaldfPattern = (averagePrice[1] < medianPrice[1] and
medianPrice[2] <= averagePrice[1] and
medianBodyPrice[2] <= averagePrice[3]) or
(averagePrice[1] < medianPrice[3] and
medianBodyPrice < medianPrice[2] and
medianBodyPrice[1] < medianBodyPrice[2]);

plot PatternStart = entryGandaldfPattern and !entryGandaldfPattern[1];
#plot PatternOn = entryGandaldfPattern ;


1708485738631.png
 
Hi, I'm new. I have setup a few basic advanced orders based on RSI/Bollinger Bands, but I wanted to try and make some using the strategies I found on the website. I setup the Gandalf indicators but it is a lot of information, and I'm not sure how to create an advanced order that can trigger based on the indicators. Please help.
 
Hi, I'm new. I have setup a few basic advanced orders based on RSI/Bollinger Bands, but I wanted to try and make some using the strategies I found on the website. I setup the Gandalf indicators but it is a lot of information, and I'm not sure how to create an advanced order that can trigger based on the indicators. Please help.
Some indicators are too complex for the advanced order interface but if it works in the scan it should be fine.
If you can describe the condition for the entey i can help you strip yhe indicator from its complexity.
 
I also setup the SuperWizTrendTrailStrategy, and saved it as a strategy. Should I also save it as a study so I can use it to make the orders and use it in the scanner to find best fits for that strategy? I'm not really sure what I'm doing. I'm using paper account for testing and working out the kinks.
 
This strategy is utilizing the daily time frame for a directional bias and IV.
Unfortunately, multiple timeframes are not supported in the scan hacker.
 
Lines 413 and 419 uses PaintingStrategy.BOOLEAN_ARROW_... and don't work properly (arrows don't show).

Area should change from:
Code:
# If long and get a BuyStop
plot BuyStpSig = if (CurrentPosition == 0 and isLong[1] and showSignals and useStops) then 1 else 0;
###
BuyStpSig.SetPaintingStrategy(if showSignalLines then PaintingStrategy.dASHES else PaintingStrategy.BOOLEAN_ARROW_DOWN);

###

# If short and get a SellStop
plot SellStpSig = if (CurrentPosition == 0 and isShort[1] and showSignals and useStops) then 1 else 0;
###
SellStpSig.SetPaintingStrategy(if showSignalLines then PaintingStrategy.dASHES else PaintingStrategy.BOOLEAN_ARROW_UP);
to:
Code:
# If long and get a BuyStop
plot BuyStpSig = if (CurrentPosition == 0 and isLong[1] and showSignals and useStops and showSignalLines) then 1 else 0;
###
BuyStpSig.SetPaintingStrategy(PaintingStrategy.BOOLEAN_ARROW_DOWN);

###

# If short and get a SellStop
plot SellStpSig = if (CurrentPosition == 0 and isShort[1] and showSignals and useStops and showSignalLines) then 1 else 0;
###
SellStpSig.SetPaintingStrategy(PaintingStrategy.BOOLEAN_ARROW_UP);
 
Last edited:
Lines 413 and 419 uses PaintingStrategy.BOOLEAN_ARROW_... and don't work properly (arrows don't show).

Area should change from:
Code:
# If long and get a BuyStop
plot BuyStpSig = if (CurrentPosition == 0 and isLong[1] and showSignals and useStops) then 1 else 0;
###
BuyStpSig.SetPaintingStrategy(if showSignalLines then PaintingStrategy.dASHES else PaintingStrategy.BOOLEAN_ARROW_DOWN);

###

# If short and get a SellStop
plot SellStpSig = if (CurrentPosition == 0 and isShort[1] and showSignals and useStops) then 1 else 0;
###
SellStpSig.SetPaintingStrategy(if showSignalLines then PaintingStrategy.dASHES else PaintingStrategy.BOOLEAN_ARROW_UP);
to:
Code:
# If long and get a BuyStop
plot BuyStpSig = if (CurrentPosition == 0 and isLong[1] and showSignals and useStops and showSignalLines) then 1 else 0;
###
BuyStpSig.SetPaintingStrategy(PaintingStrategy.BOOLEAN_ARROW_DOWN);

###

# If short and get a SellStop
plot SellStpSig = if (CurrentPosition == 0 and isShort[1] and showSignals and useStops and showSignalLines) then 1 else 0;
###
SellStpSig.SetPaintingStrategy(PaintingStrategy.BOOLEAN_ARROW_UP);
You are correct the issue is with the showSignalLines and it should be removed.
something I was testing last and it got into this version...the idea was to alternate within the same plot the arrow with a line based on a user preference . ( any ideas on how to make that work? )

Thank you.
 
GandalfTrendOnset Strategy

Combining 2 strategies (available in TOS) with signal filters and modified exit logic.

The Onset Trend strategy is based upon the Onset Trend Detector study, a zero-lag trend analyzing oscillator. This oscillator incorporates two filters, the Super Smoother Filter and the Roofing Filter, both developed by John F. Ehlers. Data derived from these two filters is processed by automatic gain control algorithm and then subjected to the quotient transform. The quotient transform, controlled by the K coefficient, collapses small oscillator values while keeping higher values high.
The strategy uses the oscillator twice, with different values of K coefficient. This ensures more precise trend detection. Suggested values for the coefficient are 0.8 and 0.4, customizable via input parameters. The strategy adds a simulated Buy order when the first oscillator crosses above zero (which corresponds to uptrend detection) and a Sell to close order when the second oscillator crosses below zero (which signifies that the uptrend is over).
GandalfProjectResearchSystem is a trading strategy developed by Domenico D'Errico and Giovanni Trombetta. This strategy uses such data as candle average price (ohlc4), median price, and mid-body value to spot the points of price weakness to add entry signals. Sell signals are added after a certain time or price condition is met.


uFTAcq80bcj4bDvfZ5jfLik6nJCCzDOnF0Y_m-61aQUq2B0OcvVRYWmBxUmSqBFRK2HZ8thAal0X7hdTPagqHHlfqBW24bcEBdjzzJX4lVmMii4wd45u406ZGubCAMtKdKWAwA6ypMag4NKxS008c-E


Code:
input TrendDetectorPrice = close;

input TrendDetectorCutoffLength = 10;

input TrendDetectorRoofCutoffLength = 100;

input TrendDetectorK1 = 0.8;

input TrendDetectorK2 = 0.4;

def quotient1 = reference OnsetTrendDetector(TrendDetectorprice, TrendDetectorCutoffLength, TrendDetectorRoofCutoffLength, TrendDetectork1).Quotient;

def quotient2 = reference OnsetTrendDetector(TrendDetectorprice, TrendDetectorCutoffLength, TrendDetectorRoofCutoffLength, TrendDetectork2).Quotient;


def averagePrice = ohlc4;

def medianPrice = hl2;

def medianBodyPrice = MidBodyVal();


def entryGandaldfPattern = (averagePrice[1] < medianPrice[1] and

    medianPrice[2] <= averagePrice[1] and

    medianBodyPrice[2] <= averagePrice[3]) or

    (averagePrice[1] < medianPrice[3] and

    medianBodyPrice < medianPrice[2] and

    medianBodyPrice[1] < medianBodyPrice[2]);


def exitGandalfPattern = (averagePrice[1] < medianBodyPrice[1] and

    medianPrice[2] == medianBodyPrice[3] and

    medianBodyPrice[1] <= medianBodyPrice[4]) or

    (averagePrice[2] < medianBodyPrice and

    medianPrice[4] <= averagePrice[3] and

    medianBodyPrice[1] <= averagePrice[1]);


def BuyCond =   entryGandaldfPattern or (quotient1 > 0);

def sellcond =  quotient2 < 0 or (!entryGandaldfPattern or exitGandalfPattern);


def orderAuto;

orderAuto = CompoundValue(1, 

  if IsNaN(close) then orderAuto[1]

  else if BuyCond then 1

  else if sellcond then 0

  else orderAuto[1]

, 0);


def BuyCondPrice = if orderAuto crosses above 0 then open[-1] else BuyCondprice[1];

def PrevBuyCondPrice = if BuyCondPrice <> BuyCondPrice[1] then BuyCondPrice[1] else PrevBuyCondPrice[1];


input EntryOrderSource = low;

input useConservative = no;

def BuyConf = orderAuto and EntryOrderSource crosses above PrevBuyCondPrice and if useConservative then BuyCondPrice > PrevBuyCondPrice else 1 ;

AddOrder(OrderType.BUY_AUTO, BuyConf, tickcolor = GetColor(1), arrowcolor = GetColor(1), name = "B@"+open[-1]);

AddOrder(OrderType.SELL_TO_CLOSE,orderAuto == 0 , tickcolor = GetColor(2), arrowcolor = GetColor(2), name = "LX@ "+open[-1]);
 

Join useThinkScript to post your question to a community of 21,000+ developers and traders.

Not the exact question you're looking for?

Start a new thread and receive assistance from our community.

87k+ Posts
200 Online
Create Post

The Market Trading Game Changer

Join 2,500+ subscribers inside the useThinkScript VIP Membership Club
  • Exclusive indicators
  • Proven strategies & setups
  • Private Discord community
  • ‘Buy The Dip’ signal alerts
  • Exclusive members-only content
  • Add-ons and resources
  • 1 full year of unlimited support

Frequently Asked Questions

What is useThinkScript?

useThinkScript is the #1 community of stock market investors using indicators and other tools to power their trading strategies. Traders of all skill levels use our forums to learn about scripting and indicators, help each other, and discover new ways to gain an edge in the markets.

How do I get started?

We get it. Our forum can be intimidating, if not overwhelming. With thousands of topics, tens of thousands of posts, our community has created an incredibly deep knowledge base for stock traders. No one can ever exhaust every resource provided on our site.

If you are new, or just looking for guidance, here are some helpful links to get you started.

What are the benefits of VIP Membership?
VIP members get exclusive access to these proven and tested premium indicators: Buy the Dip, Advanced Market Moves 2.0, Take Profit, and Volatility Trading Range. In addition, VIP members get access to over 50 VIP-only custom indicators, add-ons, and strategies, private VIP-only forums, private Discord channel to discuss trades and strategies in real-time, customer support, trade alerts, and much more. Learn all about VIP membership here.
How can I access the premium indicators?
To access the premium indicators, which are plug and play ready, sign up for VIP membership here.
Back
Top