Inspired by the post https://usethinkscript.com/threads/...acktesting-data-utility-for-thinkorswim.1624/
I came up with this solution when I wanted to backtest the indicators combined with other strategies, multiple positions, reentries and risk management..
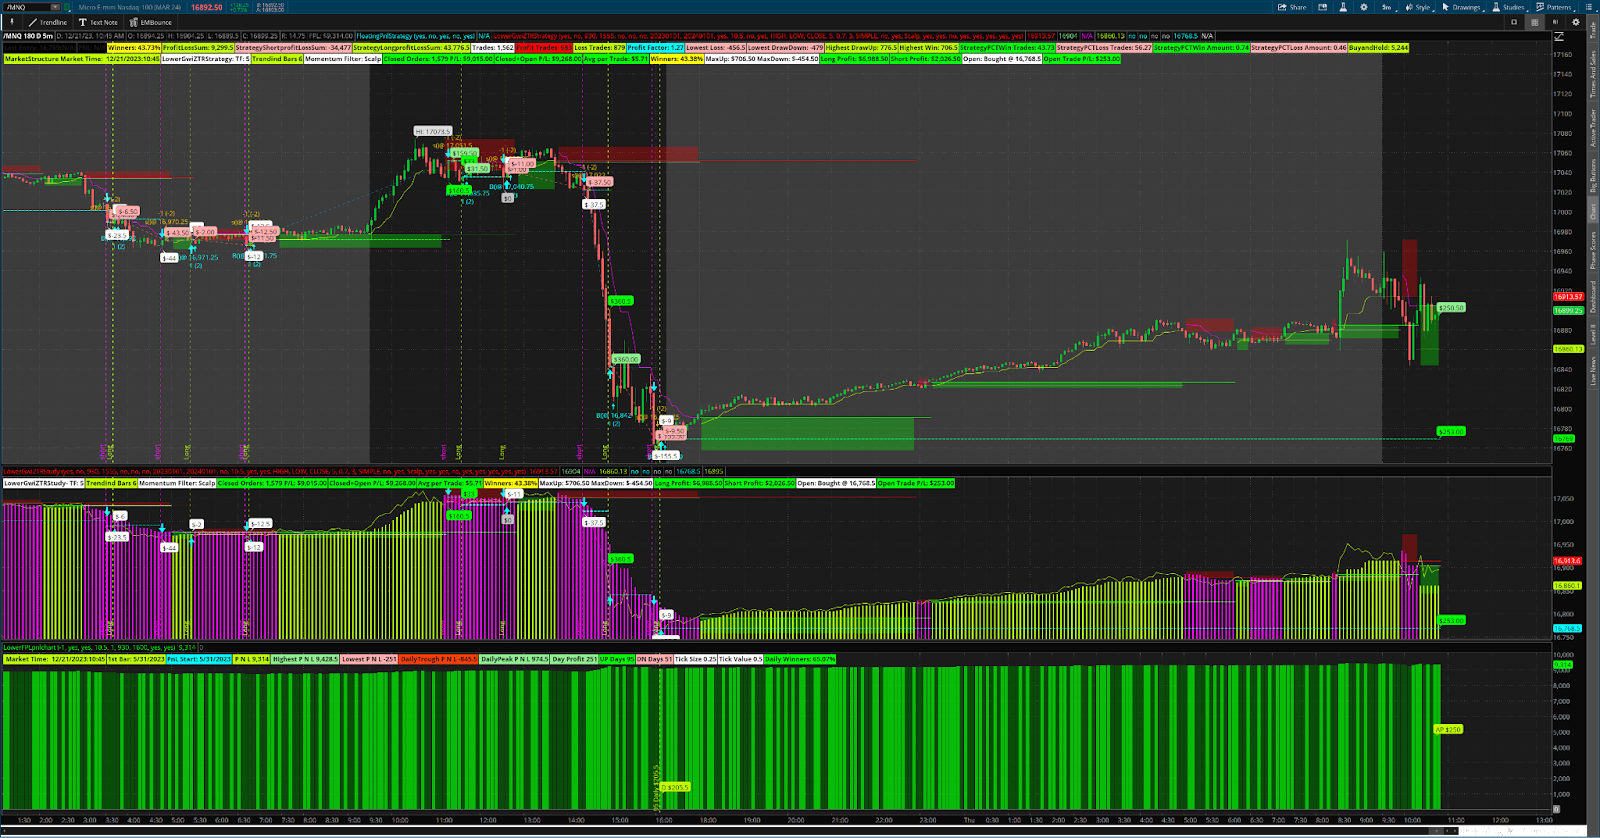
All strategies combined on the chart with stops and or multiple contracts are calculated and are all in sync with the strategy reports.
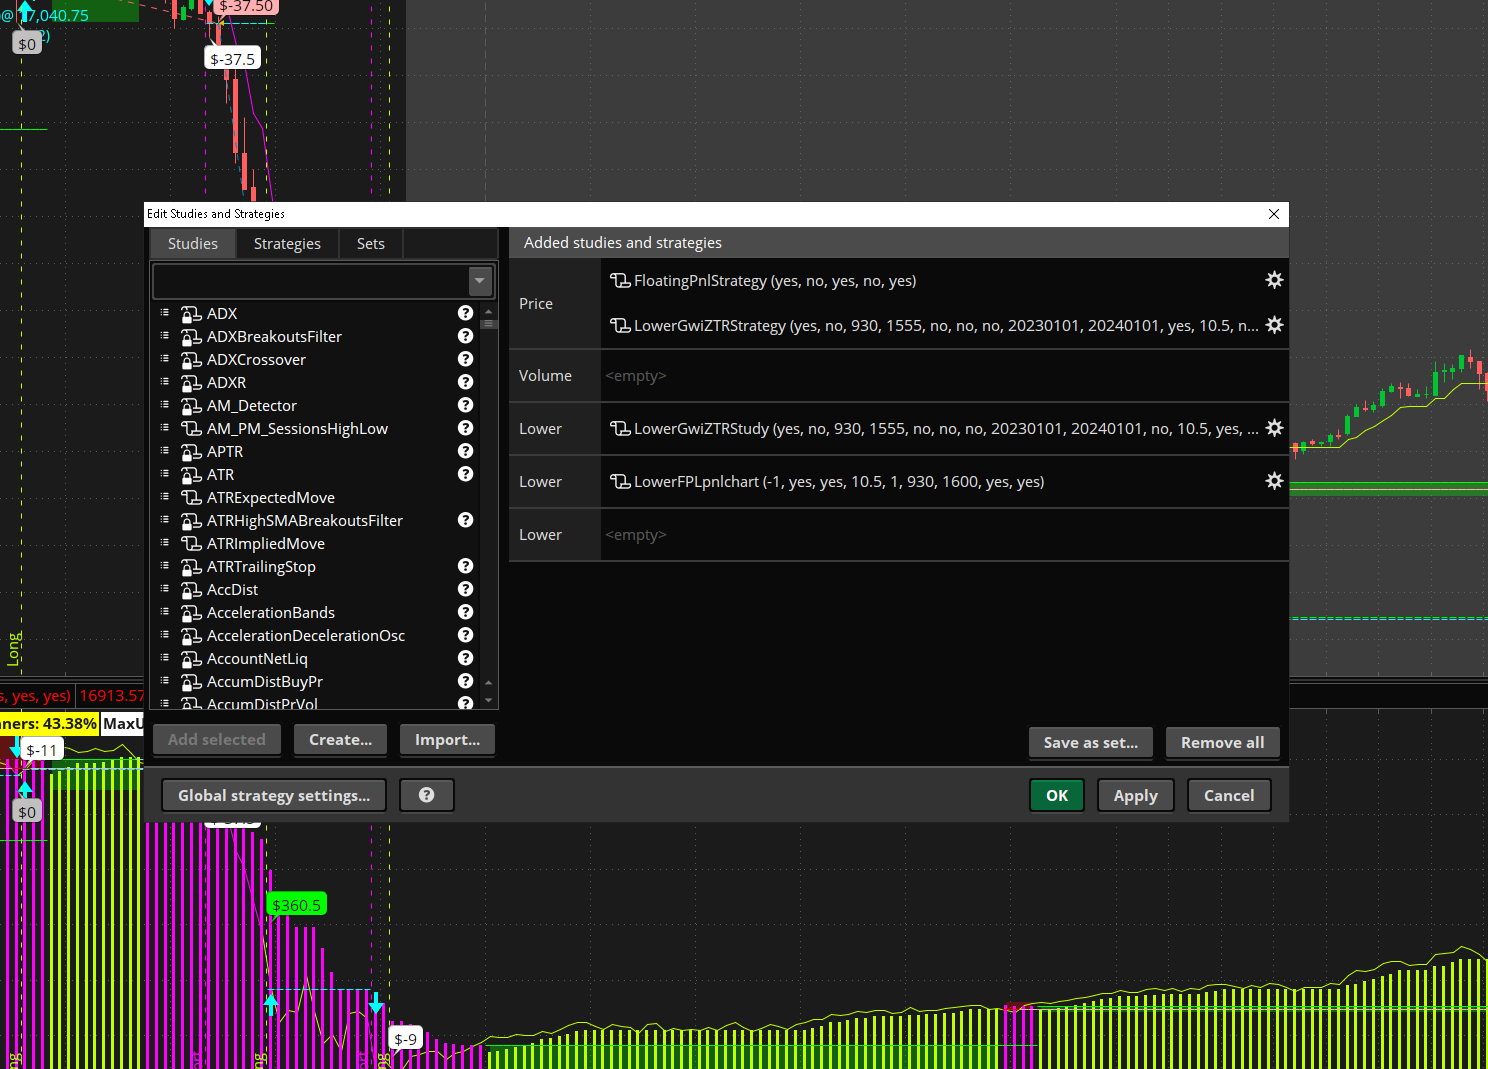
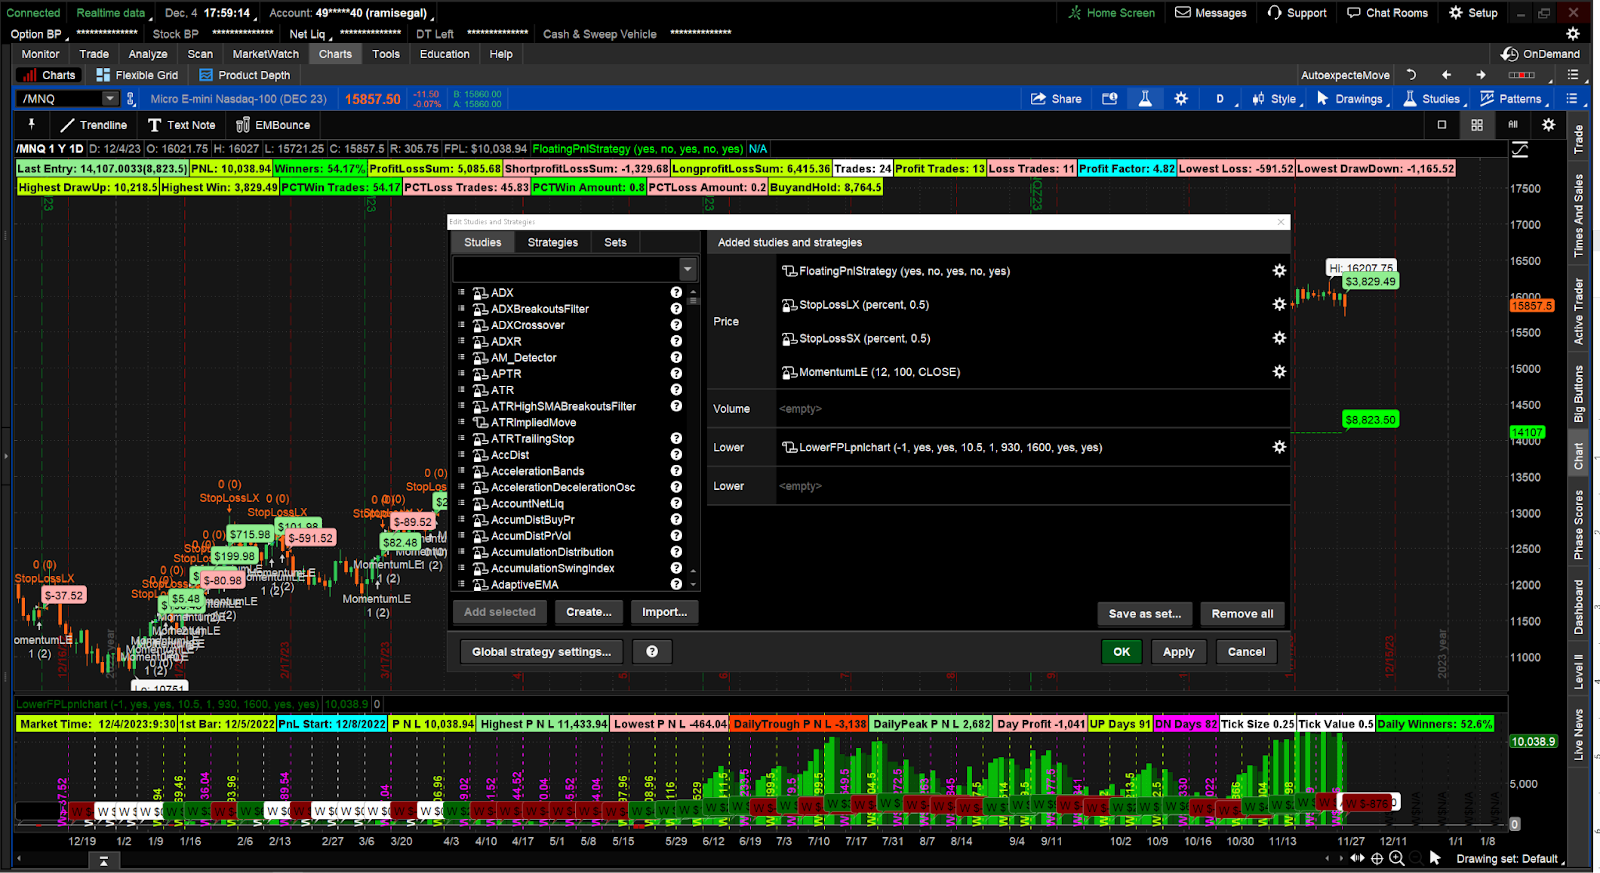
The code below is a standalone/decoupled “strategy dashboard”, It seems that a script compiled as a study vs strategy is contained in differently, the key is that it must and should be created as a “Dummy” strategy in TOS, saved and named as your dashboard than add to the chart combined with all other strategies and studies.
View attachment 20387View attachment 20387
Example below: is a predefined strategy in TOS
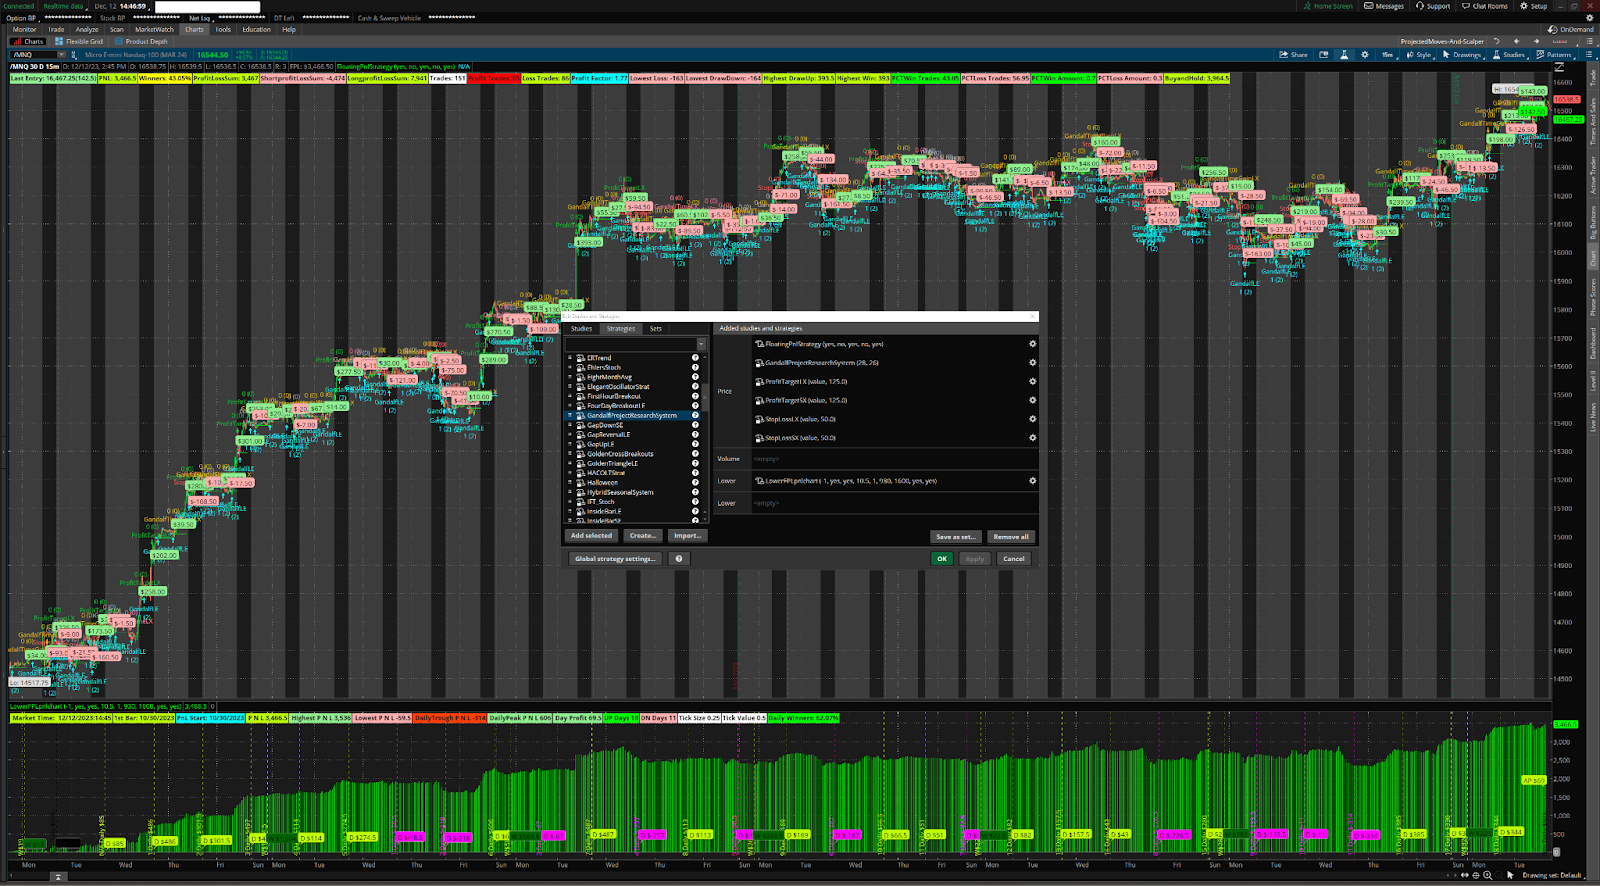
Paste the script below and save as a strategy: FloatingPnlStrategy or any name...
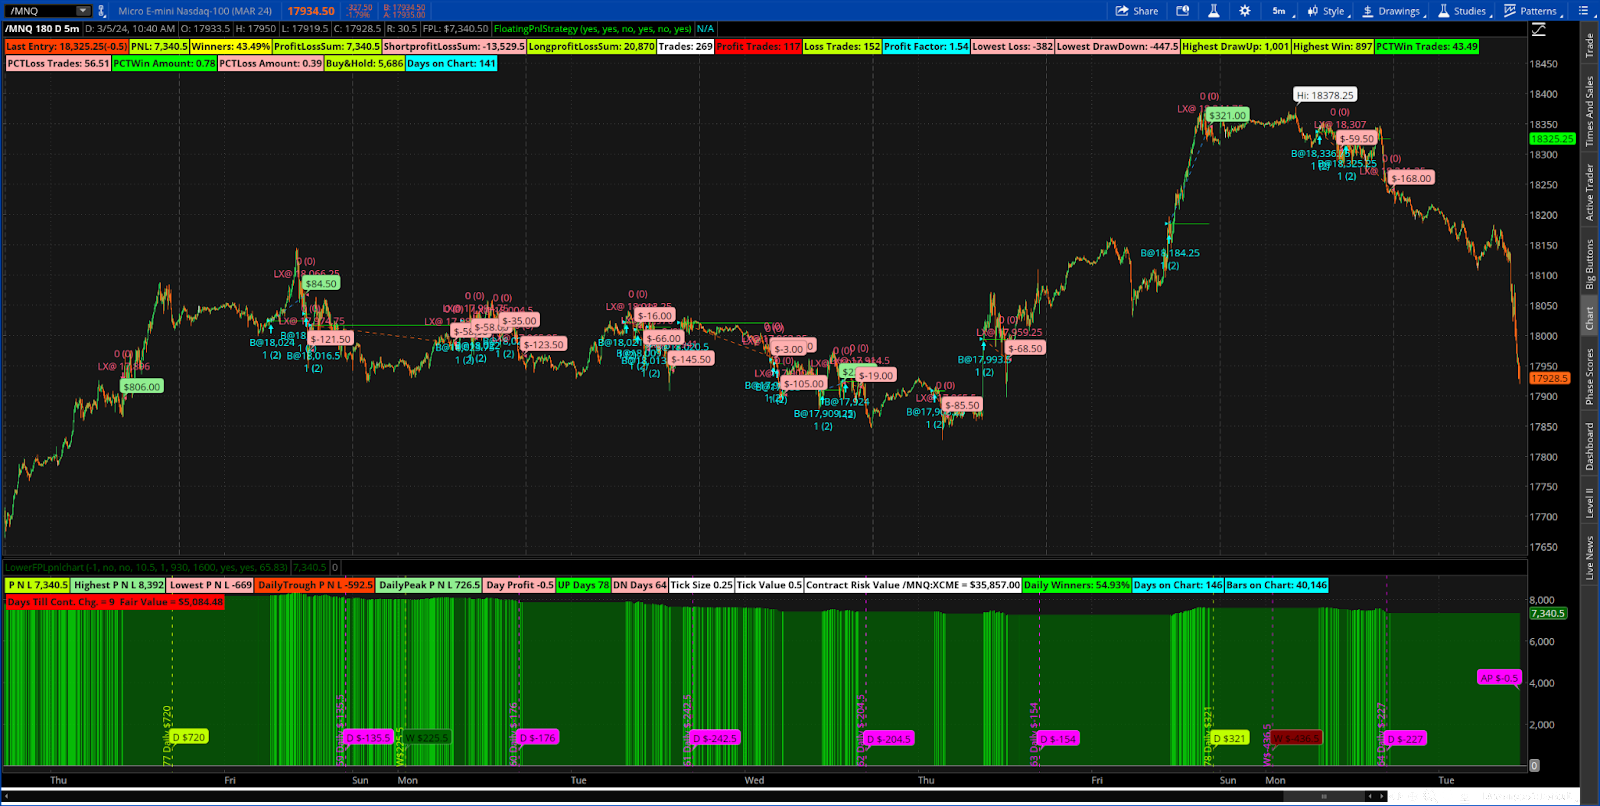
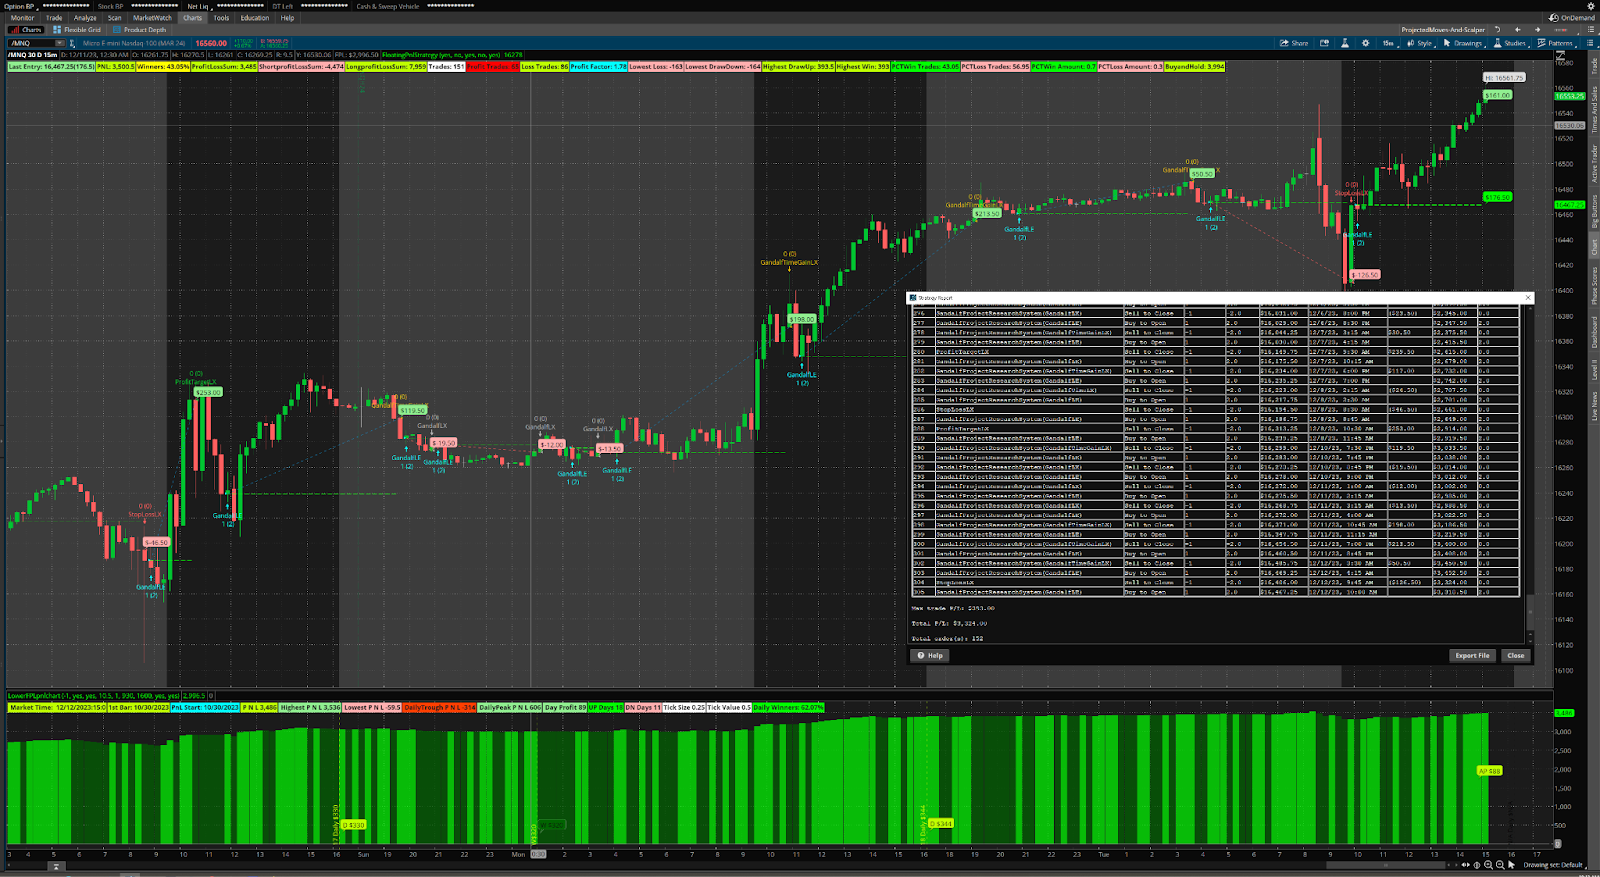
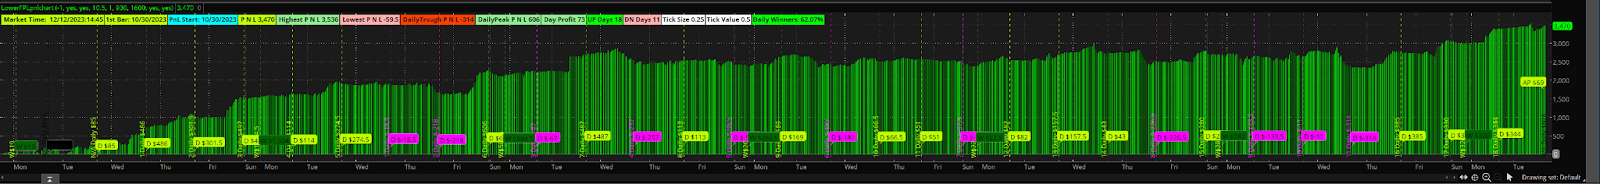
The Lower study dashboard is an extended P&L with daily and weekly subtotals and also to monitor the progress of the computation stream by checking the total up and down days vs the number of days selected for the chart. Sometimes TOS performance is so slow it seems it's compiling on a 286
Paste the script below and save as a study: LowerFPLpnlchart
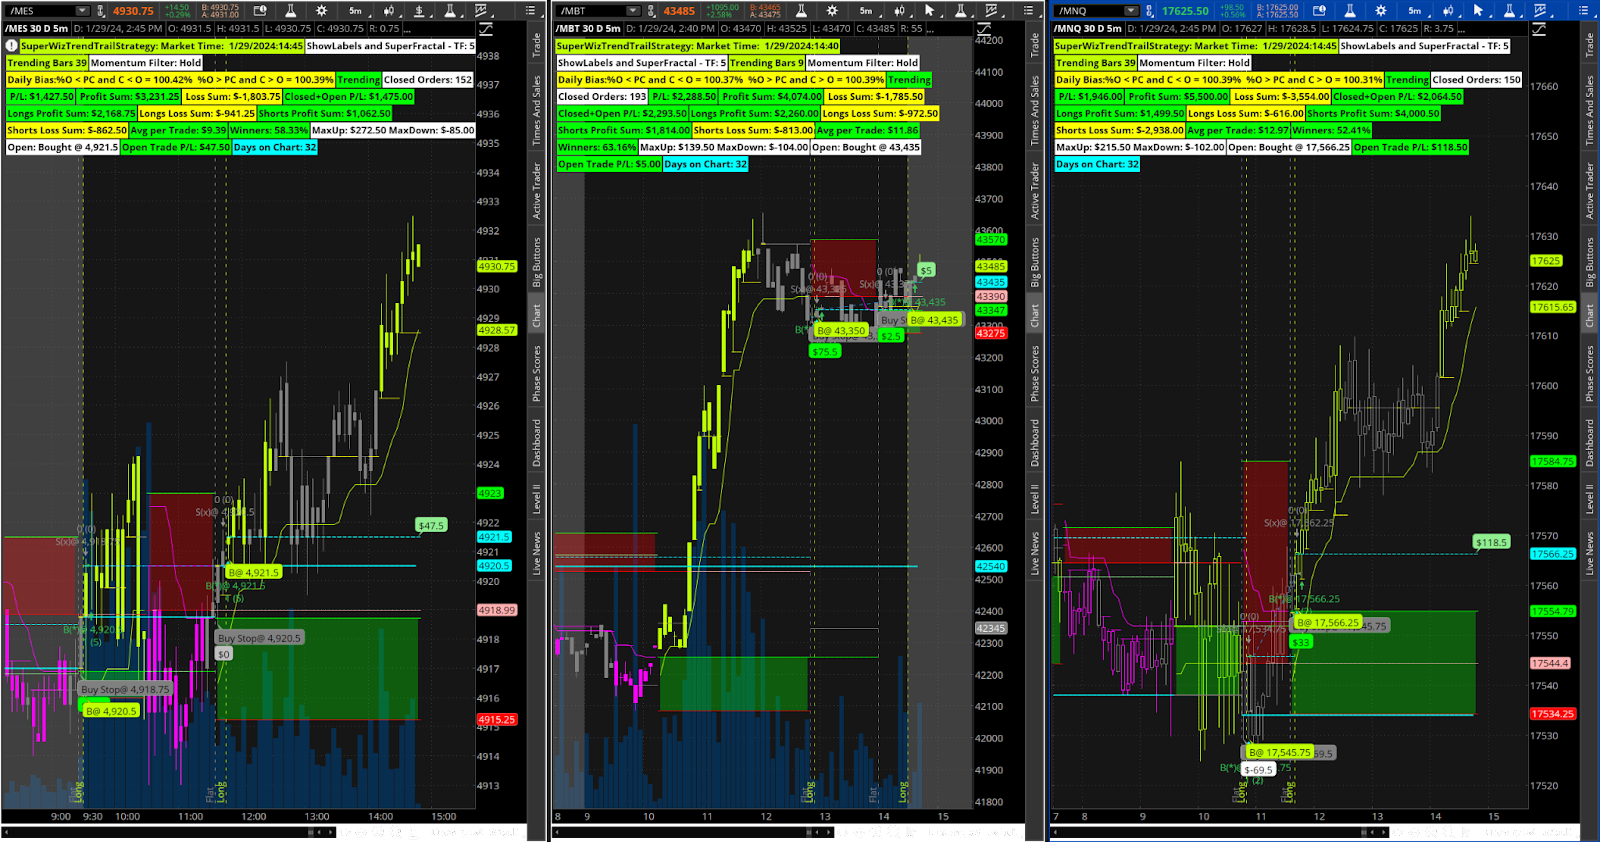
Example of a random selection TOS pre defined strategy (combine as many strategies to all be calculated together in the dashboard)
This tool helped me develop my strategies. I debugged it over time. Let me know if you find any issues.
I came up with this solution when I wanted to backtest the indicators combined with other strategies, multiple positions, reentries and risk management..
All strategies combined on the chart with stops and or multiple contracts are calculated and are all in sync with the strategy reports.
The code below is a standalone/decoupled “strategy dashboard”, It seems that a script compiled as a study vs strategy is contained in differently, the key is that it must and should be created as a “Dummy” strategy in TOS, saved and named as your dashboard than add to the chart combined with all other strategies and studies.
View attachment 20387View attachment 20387
Example below: is a predefined strategy in TOS
GandalfProjectResearchSystem
Paste the script below and save as a strategy: FloatingPnlStrategy or any name...
Python:
#######################################
##  START of Strategies DashBoard
#######################################
addOrder(OrderType.BUY_AUTO, no);

input ShowStrategyCurrentPnlBubble = yes;
input ShowStrategyPnlBubble = no;
input ShowStrategyPnlEntryBubble = yes;
input ShowStrategyPnlVertical = no;
Input ShowStrategyProfitLossLabels = yes;
def fpl = FPL();
def StrategyEntryprice = if IsNaN(EntryPrice())  then 0 else EntryPrice();
def ep = entryprice();
def poschange = ( StrategyEntryprice <> StrategyEntryprice[1] and StrategyEntryprice == 0 ) or (  StrategyEntryprice <> StrategyEntryprice[1] and StrategyEntryprice[1] == 0  )   or (  StrategyEntryprice <> StrategyEntryprice[1] and StrategyEntryprice[1] > 0   and StrategyEntryprice[0] > 0 );
def pnlentry =  if  poschange  then  fpl[1] else pnlentry[1];
def currentprofit = fpl() - pnlentry[1];
def pnlprofit =  if pnlentry <> pnlentry[1] then  fpl()[1] - pnlentry[1] else 0  ;
def entryprofit = (if pnlprofit> 0 then 1 else -1 )  * absValue( if  poschange  then if StrategyEntryprice == 0 then open[0] - ep[1] else ep-ep[1] else 0) ;
def dollarentryprofitloss = Round(((entryprofit ) / TickSize()) * TickValue());

AddChartBubble(ShowStrategyPnlEntryBubble and poschange and absValue(dollarentryprofitloss  )>0, open[0], AsDollars(dollarentryprofitloss[0]), if dollarentryprofitloss[0] > 0 then Color.light_GREEN else if  dollarentryprofitloss[0] < 0 then Color.pink else Color.BLUE);
AddVerticalLine(ShowStrategyPnlVertical and ShowStrategyPnlEntryBubble and poschange, AsDollars(fpl) + " (" + dollarentryprofitloss + ")" ,  if dollarentryprofitloss > 0 then Color.GREEN else if dollarentryprofitloss < 0 then Color.RED else if pnlentry == 0 then Color.WHITE else Color.CYAN);

def fplpnlprofit = pnlprofit;
AddChartBubble(ShowStrategyPnlBubble and poschange[0] and absValue(fplpnlprofit  )>0, open[0], AsDollars(fplpnlprofit[0]), if fplpnlprofit[0] > 0 then Color.GREEN else if  fplpnlprofit[0] < 0 then Color.RED else Color.BLUE);
AddVerticalLine(ShowStrategyPnlVertical and ShowStrategyPnlBubble and poschange, AsDollars(fpl) + " (" + pnlprofit + ")" ,  if pnlprofit > 0 then Color.GREEN else if pnlprofit < 0 then Color.RED else if pnlentry == 0 then Color.WHITE else Color.CYAN);
def lastentry =if isnan( entryprice()) then lastentry[1] else entryprice() ;
AddChartBubble(ShowStrategyCurrentPnlBubble  and !IsNaN(close) and IsNaN(close [-1] ) and HighestAll(BarNumber()) and absValue(currentprofit)> 0, lastentry, AsDollars(currentprofit[0]), if currentprofit[0] > 0 then Color.green else if  currentprofit[0] < 0 then Color.red else Color.BLUE);

def pl = if ShowStrategyPnlEntryBubble then if isnan( dollarentryprofitloss) then 0 else dollarentryprofitloss else if isnan(fplpnlprofit) then 0 else fplpnlprofit;
def StrategyLongprofitLossSum = CompoundValue(1, if BarNumber() == 1 then 0 else if pl > 0 then StrategyLongprofitLossSum[1] + pl[0] else StrategyLongprofitLossSum[1], 0);
def StrategyShortprofitLossSum = CompoundValue(1, if BarNumber() == 1 then 0 else if pl < 0 then StrategyShortprofitLossSum[1] + pl[0] else StrategyShortprofitLossSum[1], 0);
def StrategyProfittradecnt = if  BarNumber() == 1 then 0 else if pl > 0 then StrategyProfittradecnt[1] + 1 else StrategyProfittradecnt[1] ;
def Strategylosstradecnt = if  BarNumber() == 1 then 0 else if pl < 0 then Strategylosstradecnt[1] + 1 else Strategylosstradecnt[1] ;
def Strategytradecnt = StrategyProfittradecnt + Strategylosstradecnt;

# What percent were winners
def StrategyPCTWin = Round(((StrategyProfittradecnt) / (Strategytradecnt)) * 100, 2) ;
def StrategyPCTLoss = Round(((Strategylosstradecnt) / (Strategytradecnt)) * 100, 2) ;
def StrategyPCTWinamt = Round(((absValue(StrategyLongprofitLossSum/StrategyProfittradecnt)) /absValue( (StrategyLongprofitLossSum/StrategyProfittradecnt) + absValue(StrategyShortprofitLossSum/Strategytradecnt))) * 1, 2) ;
def PCTLossamt =  Round(((absValue(StrategyShortprofitLossSum/Strategylosstradecnt)) /absValue( (StrategyLongprofitLossSum/StrategyProfittradecnt) + absValue(StrategyShortprofitLossSum/Strategytradecnt))) * 1, 2) ;
plot PltEntryPrice = ep;
PltEntryPrice.SetPaintingStrategy(PaintingStrategy.DASHES);
PltEntryPrice.SetdefaultColor(color.cyan);
PltEntryPrice.assignValueColor(if currentprofit then color.green else
if entryprofit < 0 then color.red else color.cyan );


def Strategylowestdrawdown =  min(if isnan(currentprofit) then 0 else currentprofit,Strategylowestdrawdown[1]);
def StrategyHigestdrawUp =  max(if isnan(currentprofit) then 0 else currentprofit,StrategyHigestdrawUp[1]);
def Strategylowestloss = min(pl,Strategylowestloss[1]);
def highestwin = max(pl,highestwin[1]);
AddLabel(ShowStrategyProfitLossLabels ,  "Last Entry: "+lastentry +"("+currentprofit +")" ,if currentprofit > 0 then color.light_green else if currentprofit < 0 then color.light_red else color.cyan );
AddLabel(ShowStrategyProfitLossLabels, "PNL: " + (FPL()), if FPL() > 0 then Color.LIME else Color.RED);
AddLabel(ShowStrategyProfitLossLabels, "Winners: " + StrategyPCTWin + "%", if StrategyPCTWin > 50 then Color.GREEN else if StrategyPCTWin > 40 then Color.YELLOW else Color.GRAY);
AddLabel(ShowStrategyProfitLossLabels, "ProfitLossSum: " + (StrategyLongprofitLossSum + StrategyShortprofitLossSum), if (StrategyLongprofitLossSum + StrategyShortprofitLossSum) > 0 then Color.LIME else Color.RED);
AddLabel(ShowStrategyProfitLossLabels, "StrategyShortprofitLossSum: " + (StrategyShortprofitLossSum), Color.pink);
AddLabel(ShowStrategyProfitLossLabels, "StrategyLongprofitLossSum: " + (StrategyLongprofitLossSum), Color.LIME);
AddLabel(ShowStrategyProfitLossLabels, "Trades: " + (Strategytradecnt), Color.WHITE);
AddLabel(ShowStrategyProfitLossLabels, "Profit Trades: " + (StrategyProfittradecnt), if StrategyProfittradecnt > Strategylosstradecnt then Color.LIME else Color.RED);
AddLabel(ShowStrategyProfitLossLabels, "Loss Trades: " + (Strategylosstradecnt), if StrategyProfittradecnt < Strategylosstradecnt then Color.LIME else Color.pink);
AddLabel(ShowStrategyProfitLossLabels, "Profit Factor: " +round(absvalue (StrategyLongprofitLossSum/StrategyShortprofitLossSum)),color.cyan);
AddLabel(ShowStrategyProfitLossLabels, "Lowest Loss: " + (Strategylowestloss), Color.pink);
AddLabel(ShowStrategyProfitLossLabels, "Lowest DrawDown: " + (Strategylowestdrawdown), Color.pink);
AddLabel(ShowStrategyProfitLossLabels, "Highest DrawUp: " + (StrategyHigestdrawUp), Color.LIME);
AddLabel(ShowStrategyProfitLossLabels, "Highest Win: " + (highestwin), Color.LIME);
AddLabel(ShowStrategyProfitLossLabels, "StrategyPCTWin Trades: " + (StrategyPCTWin), Color.GREEN);
AddLabel(ShowStrategyProfitLossLabels, "StrategyPCTLoss Trades: " + (StrategyPCTLoss), Color.PINK);
AddLabel(ShowStrategyProfitLossLabels, "StrategyPCTWin Amount: " + (StrategyPCTWinamt), Color.GREEN);
AddLabel(ShowStrategyProfitLossLabels, "StrategyPCTLoss Amount: " + (PCTLossamt), Color.PINK);

def firstentry = if Strategytradecnt ==1 then close[1] else firstentry[1];
def buyandhold = Round(((close - firstentry ) / TickSize()) * TickValue());
AddLabel(ShowStrategyProfitLossLabels, "BuyandHold: " + (buyandhold), if buyandhold > 0 then Color.LIME else Color.RED);


#######################################
##  END of Strategy DashBoard
#######################################
#endofcode
The Lower study dashboard is an extended P&L with daily and weekly subtotals and also to monitor the progress of the computation stream by checking the total up and down days vs the number of days selected for the chart. Sometimes TOS performance is so slow it seems it's compiling on a 286
Paste the script below and save as a study: LowerFPLpnlchart
Python:
declare lower;
input Offset = -1;
def LastBar = !IsNaN(open) and IsNaN(open [-1] ) ;
def lastBubbleLocation = LastBar[Offset];
input ShowTime = no;
input ShowFromDate = no;
input TimeZone = 10.5;
def Hours = Floor(TimeZone + SecondsFromTime(0930) / 60 / 60) - 1;
def Minutes = ((TimeZone + SecondsFromTime(930) / 60 / 60) % 1) * 60;
AddLabel(ShowTime, " Market Time:  " + GetMonth() + "/" +  GetDayOfMonth(GetYYYYMMDD()) + "/"  + (AsPrice(GetYear()))  + ":" + Hours + ":" + Minutes ,
             if !IsNaN(GetTime())
             then Color.LIME
             else if IsNaN(GetTime())
                  then Color.PINK
                  else Color.WHITE);
# Defines the hours from last bar till end-of-day (midnight) on an intra-day chart
input time = 0001;# Is midnight which is the start of counting seconds in the functions below.
def TimeFrom = SecondsFromTime(time);# Returns the seconds from 'time'. If not an intra-day chart, returns 0.

def TimeLeft = SecondsTillTime(time);# Returns the seconds till input 'time'. If not an intra-day chart, returns 0.

#AddLabel(1, "Time from last bar till end-of-day (midnight) = " + (Round( (24 + (TimeLeft / 3600)), 1)) + " Hours", Color.WHITE);
def startdate = if   TOTALSUM(FPL()) <>  0 == 0 and TOTALSUM(FPL())[1]== 0 then 1 else 0;;
def startmonth = if startdate then GetMonth() else startmonth[1];
def startday = if startdate then GetDayOfMonth(GetYYYYMMDD()) else startday[1];
def startyear = if startdate then GetYear() else startyear[1];
def from_dayofmonth = if BarNumber() == 1 then GetDayOfMonth(GetYYYYMMDD()) else from_dayofmonth[1];
def from_month = if BarNumber() == 1 then GetMonth() else from_month[1];
def from_year  = if BarNumber() == 1 then GetYear() else from_year[1];
AddLabel(ShowFromDate, "1st Bar: " + from_month  + "/" + from_dayofmonth + "/"  + (AsPrice(from_year)),
             if !IsNaN(GetTime())
             then Color.LIME
             else if IsNaN(GetTime())
                  then Color.PINK
                  else Color.WHITE);
AddLabel(ShowFromDate, "PnL Start: " +asprice(startmonth) +"/" +asprice(startday) +"/" +asprice(startyear)  , color.cyan);
plot FPL = FPL();
plot ZeroLine = 0;
FPL.SetPaintingStrategy(PaintingStrategy.SQUARED_HISTOGRAM);
FPL.DefineColor("Positive and Up", Color.GREEN);
FPL.DefineColor("Positive and Down", Color.DARK_GREEN);
FPL.DefineColor("Negative and Down", Color.RED);
FPL.DefineColor("Negative and Up", Color.DARK_RED);
FPL.AssignValueColor(if FPL >= 0 then if FPL > FPL[1] then FPL.Color("Positive and Up") else FPL.Color("Positive and Down") else if FPL < FPL[1] then FPL.Color("Negative and Down") else FPL.Color("Negative and Up"));
ZeroLine.SetDefaultColor(Color.GRAY);
input TradeTimeStart = 0930;
input TradeTimeEnd = 1600;
input UseMarketTime = yes;
#################################################################################
##################################################################################
##################################################################################
def Active = if UseMarketTime then if SecondsTillTime(TradeTimeStart) <= 0 and
                           SecondsTillTime(TradeTimeEnd) >= 0  then 1 else 0
                    else if GetAggregationPeriod() == AggregationPeriod.DAY then 1 else 0;
##################################################################################
input showverticalprofits = yes;
def weeklybalance  =  if GetWeek()[1] != GetWeek() and GetLastWeek() != GetWeek()[1] then FPL() else weeklybalance[1] ;
def weeklyprofit = if GetWeek()[1] != GetWeek() and  GetLastWeek() != GetWeek()[1] then FPL() - weeklybalance[1] else weeklyprofit[1];
AddVerticalLine(showverticalprofits  and  GetWeek()[1] <> GetWeek() and GetLastWeek() != GetWeek()[1], "W$" + weeklyprofit , if weeklyprofit > 0 then Color.LIME else if weeklyprofit < 0 then Color.MAGENTA else Color.WHITE);
def dailybalance = if GetAggregationPeriod() < AggregationPeriod.DAY and Active[1] and !Active[0] then FPL() else if GetAggregationPeriod() == AggregationPeriod.DAY and GetDay() <> GetDay()[1] then FPL() else  dailybalance[1];
def dailyprofit = if Active[1] and !Active[0] and GetAggregationPeriod() < AggregationPeriod.DAY  then dailybalance - dailybalance[1] else if GetAggregationPeriod() == AggregationPeriod.DAY and GetDay() <> GetDay()[1]  then FPL() - FPL()[1] else   dailyprofit[1];
def activeprofit = if GetDay() == GetLastDay()  then FPL() - dailybalance[1] else activeprofit[1] ;
AddChartBubble(showverticalprofits and  GetAggregationPeriod() < AggregationPeriod.DAY  and Active[1] and !Active[0] , FPL() / 10, "D $" + dailyprofit  , if dailyprofit > 0 then Color.LIME else if dailyprofit < 0 then Color.MAGENTA else Color.WHITE, yes);
AddChartBubble(showverticalprofits and  GetAggregationPeriod() < AggregationPeriod.week and GetWeek()[1] != GetWeek() and GetLastWeek() != GetWeek()[1], FPL() / 10, "W $" + weeklyprofit  , if weeklyprofit > 0 then Color.dark_green else if weeklyprofit < 0 then Color.dark_red else Color.WHITE, yes);
AddChartBubble(showverticalprofits and lastBubbleLocation and  GetAggregationPeriod() == AggregationPeriod.DAY   , FPL() / 10, "Active D $" + activeprofit  , if activeprofit > 0 then Color.LIME else if activeprofit < 0 then Color.MAGENTA else Color.WHITE, yes);
AddChartBubble(showverticalprofits and  lastBubbleLocation and GetAggregationPeriod() < AggregationPeriod.DAY  , FPL() / 2, "AP $" + activeprofit  , if activeprofit > 0 then Color.LIME else if activeprofit < 0 then Color.MAGENTA else Color.WHITE, yes);
AddLabel(1, " P N L " + Round( FPL()) , if FPL() > 0 then  Color.lime else if FPL() < 0 then Color.magenta else Color.WHITE) ;
AddLabel(1, " Highest P N L " + Round( HighestAll(FPL())) , if HighestAll(FPL()) > 0 then  Color.light_GREEN else if HighestAll(FPL()) < 0 then Color.pink else Color.WHITE) ;
AddLabel(1, " Lowest P N L " + Round( LowestAll(FPL())) , if LowestAll(FPL()) > 0 then  Color.light_GREEN else if LowestAll(FPL()) < 0 then Color.pink else Color.WHITE) ;
AddLabel(1, " DailyTrough P N L " + Round( LowestAll(dailyprofit)) , if LowestAll(dailyprofit) > 0 then  Color.light_GREEN else if LowestAll(dailyprofit) < 0 then Color.light_RED else Color.WHITE) ;
AddLabel(1, " DailyPeak P N L " + Round( HighestAll(dailyprofit)) , if HighestAll(dailyprofit) > 0 then  Color.light_GREEN else if HighestAll(dailyprofit) < 0 then Color.light_RED else Color.WHITE) ;
AddLabel(1, " Day Profit " + activeprofit, if activeprofit > 0 then Color.light_GREEN else if activeprofit < 0 then Color.pink else Color.WHITE);
def dayupdays = if dailyprofit > 0 and GetDay()[1] != GetDay() and  GetLastDay() != GetDay()[1] and GetAggregationPeriod() == AggregationPeriod.DAY  then dayupdays[1] + 1 else if IsNaN(dayupdays[1]) then 0 else dayupdays[1] ;
def daydndays = if dailyprofit < 0 and GetDay()[1] != GetDay() and  GetLastDay() != GetDay()[1] and GetAggregationPeriod() == AggregationPeriod.DAY  then  daydndays[1] + 1 else if IsNaN(daydndays[1]) then 0 else daydndays[1];
def dp = dailyprofit;
def updays = if dp > 0 and Active[1] and !Active[0] and GetAggregationPeriod() < AggregationPeriod.DAY  then updays[1] + 1 else if IsNaN(updays[1]) then 0 else updays[1] ;
def dndays = if dp < 0 and Active[1] and !Active[0] and GetAggregationPeriod() < AggregationPeriod.DAY  then  dndays[1] + 1 else if IsNaN(dndays[1]) then 0 else dndays[1];
def updndays =  if dailyprofit > 0 then (updays) else if dailyprofit < 0 then (dndays) else 0;
AddVerticalLine(showverticalprofits and Active[1] and !Active[0] and GetAggregationPeriod() < AggregationPeriod.DAY , updndays +" Daily $" + (dailyprofit) , if dailyprofit > 0 then Color.LIME else if dailyprofit < 0 then Color.MAGENTA else Color.WHITE);
AddLabel(GetAggregationPeriod() < AggregationPeriod.DAY, "UP Days " + updays, if updays  > 0 then  Color.GREEN  else Color.WHITE) ;
AddLabel(GetAggregationPeriod() < AggregationPeriod.DAY, "DN Days " + dndays, if dndays  > 0 then  Color.PINK  else Color.WHITE) ;
AddLabel(GetAggregationPeriod() == AggregationPeriod.DAY, "UP Days " + dayupdays, Color.LIME);
AddLabel(GetAggregationPeriod() == AggregationPeriod.DAY, "DN Days " + daydndays, Color.MAGENTA);
AddLabel(1, "Tick Size " + TickSize(), Color.WHITE);
AddLabel(1, "Tick Value " + TickValue(), Color.WHITE);
def PCTWin = if GetAggregationPeriod() < AggregationPeriod.DAY then Round((updays / (updays + dndays)) * 100, 2) else Round((dayupdays / (dayupdays + daydndays)) * 100, 2);
AddLabel(GetAggregationPeriod() <= AggregationPeriod.DAY, "Daily Winners: " + PCTWin + "%", if PCTWin > 50 then Color.GREEN else if PCTWin > 40 then Color.YELLOW else Color.GRAY);
###endofcode
Example of a random selection TOS pre defined strategy (combine as many strategies to all be calculated together in the dashboard)
This tool helped me develop my strategies. I debugged it over time. Let me know if you find any issues.
Last edited: