


mod note:
This indicator does not attempt to forecast price. Instead, it quantifies the historical relationship between markets. Because intermarket correlations are generally persistent over time, it helps traders learn which markets typically move together, which move inversely, and when those relationships are strengthening or weakening.
Its greatest value is educational—developing an understanding of market structure and intermarket behavior, which is a foundational skill of consistently profitable traders.
This indicator plot a lower study that shows level of correlation between different futures market such as /ES, /NQ, and /YM. You can adjust these futures indexes based on your liking.
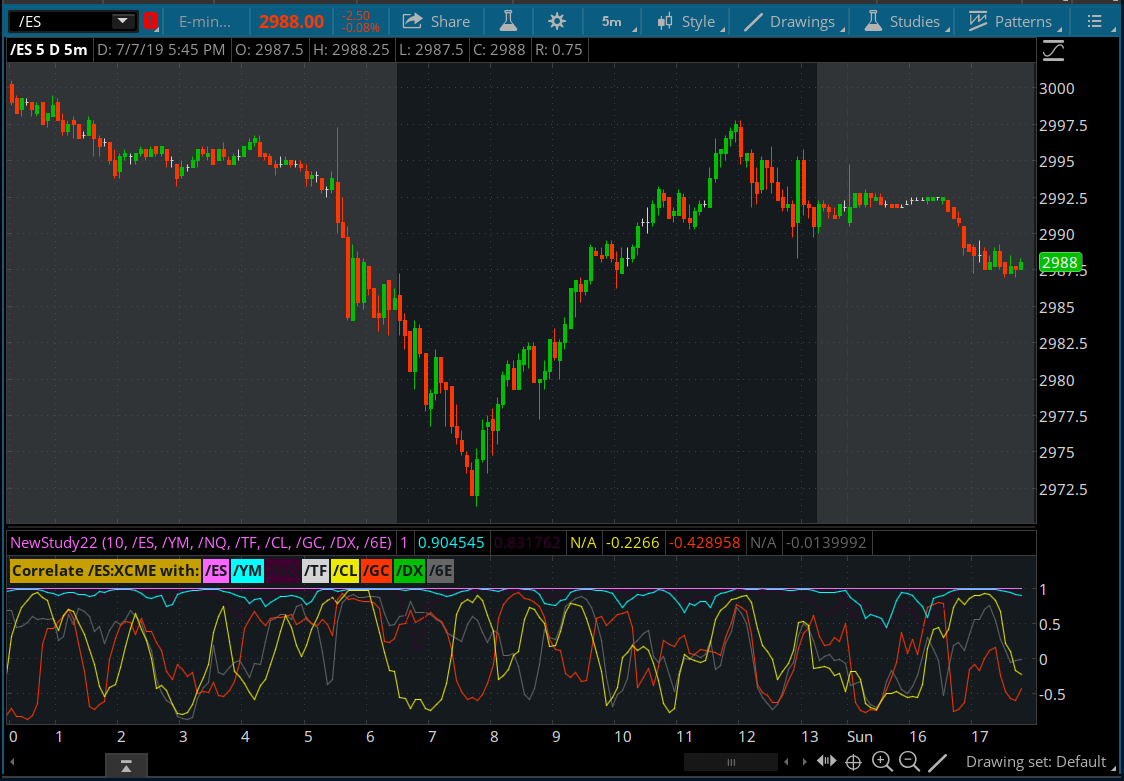
This indicator does not attempt to forecast price. Instead, it quantifies the historical relationship between markets. Because intermarket correlations are generally persistent over time, it helps traders learn which markets typically move together, which move inversely, and when those relationships are strengthening or weakening.
Its greatest value is educational—developing an understanding of market structure and intermarket behavior, which is a foundational skill of consistently profitable traders.
This indicator plot a lower study that shows level of correlation between different futures market such as /ES, /NQ, and /YM. You can adjust these futures indexes based on your liking.
thinkScript Code
Code:
# Correlate with others futures
declare lower;

input length    = 10;
input sym1      = "/ES";
input sym2      = "/YM";
input sym3      = "/NQ";
input sym4      = "/TF";
input sym5      = "/CL";
input sym6      = "/GC";
input sym7      = "/DX";
input sym8      = "/6E";

plot Symbol_1   = correlation(close, close( sym1 ), length);
plot Symbol_2 = correlation(close, close( sym2 ), length);
plot Symbol_3   = correlation(close, close( sym3 ), length);
plot Symbol_4   = correlation(close, close( sym4 ), length);
plot Symbol_5   = correlation(close, close( sym5 ), length);
plot Symbol_6   = correlation(close, close( sym6 ), length);
plot Symbol_7   = correlation(close,! close( sym7 ), length);
plot Symbol_8   = correlation(close, close( sym8 ), length);

Symbol_1.DefineColor( "sym1", GetColor( 0 ) );
Symbol_1.AssignValueColor( Symbol_1.Color( "sym1" ) );
Symbol_1.HideBubble();
Symbol_2.DefineColor( "sym2", GetColor( 1 ) );
Symbol_2.AssignValueColor( Symbol_2.Color( "sym2" ) );
Symbol_2.HideBubble();
Symbol_3.DefineColor( "sym3", GetColor( 2 ) );
Symbol_3.AssignValueColor( Symbol_3.Color( "sym3" ) );
Symbol_3.HideBubble();
Symbol_4.DefineColor( "sym4", GetColor( 3 ) );
Symbol_4.AssignValueColor( Symbol_4.Color( "sym4" ) );
Symbol_4.HideBubble();
Symbol_5.DefineColor( "sym5", GetColor( 4 ) );
Symbol_5.AssignValueColor( Symbol_5.Color( "sym5" ) );
Symbol_5.HideBubble();
Symbol_6.DefineColor( "sym6", GetColor( 5 ) );
Symbol_6.AssignValueColor( Symbol_6.Color( "sym6" ) );
Symbol_6.HideBubble();
Symbol_7.DefineColor( "sym7", GetColor( 6 ) );
Symbol_7.AssignValueColor( Symbol_7.Color( "sym7" ) );
Symbol_7.HideBubble();
Symbol_8.DefineColor( "sym8", GetColor( 7 ) );
Symbol_8.AssignValueColor( Symbol_8.Color( "sym8" ) );
Symbol_8.HideBubble();

AddLabel( yes, "Correlate " + GetSymbol() + " with:", GetColor( 8 ) );
AddLabel( yes, sym1, Symbol_1.Color( "sym1" ) );
AddLabel( yes, sym2, Symbol_2.Color( "sym2" ) );
AddLabel( yes, sym3, Symbol_3.Color( "sym3" ) );
AddLabel( yes, sym4, Symbol_4.Color( "sym4" ) );
AddLabel( yes, sym5, Symbol_5.Color( "sym5" ) );
AddLabel( yes, sym6, Symbol_6.Color( "sym6" ) );
AddLabel( yes, sym7, Symbol_7.Color( "sym7" ) );
AddLabel( yes, sym8, Symbol_8.Color( "sym8" ) );
Shareable Link
https://tos.mx/hlT3W5Attachments
Last edited by a moderator:


