FTR (Failed to Return) Candles Indicator for ThinkorSwim

BenTen

Administrative
Staff member
Staff
VIP
Lifetime
So this candle pattern was recently introduced to me via a weblog called A Teen Trader.

eHjK41M.png


@Korinek_Trades, the trader behind ateentrader.com describe it perfectly.

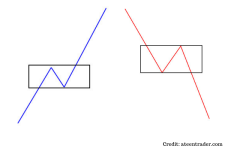
An FTR or Failed To Return, is a candle pattern in trading. What this pattern shows is that as price is in an up/down trend, price will push back and collect orders (causing a candle close of the opposite direction) before continuing the current trend.

I followed that concept and some of the illustrations on his blog and made a similar indicator for ThinkorSwim.

rM1NpfH.png

kPkc4wJ.png

YFVroxC.png


Before you start trading with the FTR indicator, be sure to read through this blog post so you understand clearly and know where to put your stop loss and profit target.

thinkScript Code

Code:
# Failed to Return Candles
# Inspired by Forex Trading Pattern as Described at https://ateentrader.com/ftr/
# Candles built from the ThinkorSwim's Candlestick Pattern Editor
# Assembled by BenTen at useThinkScript.com

# You are free to use this code for personal use, and make derivative works from it.
# You are NOT GRANTED permission to use this code (or derivative works) for commercial
# purposes which includes and is not limited to selling, reselling, or packaging with
# other commercial indicators. Headers and attribution in this code should remain as provided,
# and any derivative works should extend the existing headers.

# Define Bullish FTR Candle
def IsUp = close > open;
def IsDown = close < open;
plot Bullish_FTR =
    IsUp[4] and
    IsUp[3] and
    IsUp[2] and
    IsDown[1] and
    IsUp[0] and
    high[2] > high[1] and
    close[3] < close[2] and
    open[1] < close[0] and
    low[2] < low[1] and
    open[4] < open[3] and
    close[4] < high[3] and
    open[3] < open[2];

Bullish_FTR.SetPaintingStrategy(PaintingStrategy.BOOLEAN_ARROW_UP);
Bullish_FTR.SetDefaultColor(GetColor(0));

# Define Bearish FTR Candle
plot Bearish_FTR =
    IsDown[4] and
    IsDown[3] and
    IsDown[2] and
    IsUp[1] and
    IsDown[0] and
    close[4] > close[3] and
    open[1] > close[0] and
    close[1] > open[0] and
    open[2] > close[1] and
    open[4] > open[3] and
    open[3] > open[2] and
    close[3] > close[2] and
    close[2] < open[1];

Bearish_FTR.SetPaintingStrategy(PaintingStrategy.BOOLEAN_ARROW_DOWN);
Bearish_FTR.SetDefaultColor(GetColor(0));

# Alerts
Alert(Bullish_FTR, " ", Alert.Bar, Sound.Chimes);
Alert(Bearish_FTR, " ", Alert.Bar, Sound.Bell);

Shareable Link

https://tos.mx/Gl5L5a
 

Attachments

  • eHjK41M.png
    eHjK41M.png
    38.6 KB · Views: 171
  • rM1NpfH.png
    rM1NpfH.png
    39 KB · Views: 164
  • kPkc4wJ.png
    kPkc4wJ.png
    31.3 KB · Views: 168
  • YFVroxC.png
    YFVroxC.png
    40.6 KB · Views: 182
Last edited:

Join useThinkScript to post your question to a community of 21,000+ developers and traders.

I just want to emphasize how important it is to use this on 30min/1hr timeframes rather than short timeframes. This should totally NOT be used for day trading, lol. 5m chart is riddled with false signals.
 
hey @BenTen for some reason i'm not able to get any signal on any timeframe can you double check the script?? thank you
 
how can i use this indicator in tradingview
or
Can it be converted for tradingview
 
Last edited by a moderator:
Scripts on this forum are written in ThinkScript, which the proprietary language of the ToS platform and thus cannot be used on the Tradingview platform.

Given that there is no automated process to convert code from Thinkscript into Pinescript and given we are a forum of Thinkscripters.
You would have to find someone on Tradingview, who also is versed in Thinkscript to convert it for you.
 
Last edited:
Hey! Is there a way to have that arrow on the bar draw a rectangle on the wick, which... then actually makes the zone that he talks about. :)


Is there's no way to automatically draw what would be * right click, rectangle tool*
 
Last edited by a moderator:
Hey! Is there a way to have that arrow on the bar draw a rectangle on the wick, which... then actually makes the zone that he talks about. :)
ToS signals comprise arrows, wedges, and circular, triangular, and square dots

The ToS platform has manual rectangle drawing tool:
https://tlc.thinkorswim.com/center/reference/Drawings/Basic/Rectangle

By defining ranges, you could possibly draw something.
See example here:
https://usethinkscript.com/threads/os-ob-oscillator-boxes-on-upper-chart-for-thinkorswim.10425/
@vro3
 
Last edited:

Not the exact question you're looking for?

Start a new thread and receive assistance from our community.

87k+ Posts
245 Online
Create Post

The Market Trading Game Changer

Join 2,500+ subscribers inside the useThinkScript VIP Membership Club
  • Exclusive indicators
  • Proven strategies & setups
  • Private Discord community
  • ‘Buy The Dip’ signal alerts
  • Exclusive members-only content
  • Add-ons and resources
  • 1 full year of unlimited support

Frequently Asked Questions

What is useThinkScript?

useThinkScript is the #1 community of stock market investors using indicators and other tools to power their trading strategies. Traders of all skill levels use our forums to learn about scripting and indicators, help each other, and discover new ways to gain an edge in the markets.

How do I get started?

We get it. Our forum can be intimidating, if not overwhelming. With thousands of topics, tens of thousands of posts, our community has created an incredibly deep knowledge base for stock traders. No one can ever exhaust every resource provided on our site.

If you are new, or just looking for guidance, here are some helpful links to get you started.

What are the benefits of VIP Membership?
VIP members get exclusive access to these proven and tested premium indicators: Buy the Dip, Advanced Market Moves 2.0, Take Profit, and Volatility Trading Range. In addition, VIP members get access to over 50 VIP-only custom indicators, add-ons, and strategies, private VIP-only forums, private Discord channel to discuss trades and strategies in real-time, customer support, trade alerts, and much more. Learn all about VIP membership here.
How can I access the premium indicators?
To access the premium indicators, which are plug and play ready, sign up for VIP membership here.
Back
Top