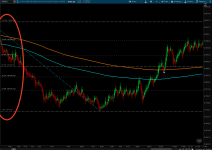
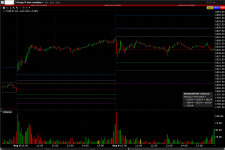
This is what it looks like on the thinkorswim chart
The code is the fibs based on prev day close (could change to weekly, monthly if desired with some modification).
Pivot point studies highlight prices considered to be a likely turning point when looking at values from a previous period, whether it be daily, weekly, quarterly or annual. Each pivot point study has its own characteristics on how these points are calculated. The formula applied for the Fibonacci Pivot Points is:
Pivot Point (P) = (High + Low + Close)/3
Support 1 (S1) = P - {.382 * (High - Low)}
Support 2 (S2) = P - {.618 * (High - Low)}
Support 3 (S3) = P - {1 * (High - Low)}
Resistance 1 (R1) = P + {.382 * (High - Low)}
Resistance 2 (R2) = P + {.618 * (High - Low)}
Resistance 3 (R3) = P + {1 * (High - Low)}
thinkScript code
Code:
# IB_Fib_Pivots
# Author: Kory Gill, @korygill
#
# VERSION HISTORY (sortable date and time (your local time is fine), and your initials
# 20190906-1900-KG    - Created.
# ...
# ...

declare hide_on_daily;
declare once_per_bar;

input AggregationPeriod = AggregationPeriod.DAY;

#
# logic
#
def nan = Double.NaN;
def isRollover = GetYYYYMMDD() != GetYYYYMMDD()[1];
def beforeStart = GetTime() < RegularTradingStart(GetYYYYMMDD());
def afterEnd = GetTime() > RegularTradingEnd(GetYYYYMMDD());
def firstBarOfDay = if (beforeStart[1] == 1 and beforeStart == 0) or (isRollover and beforeStart == 0) then 1 else 0;
def lastBarOfDay = if
    (afterEnd[-1] == 1 and afterEnd == 0) or
    (isRollover[-1] and firstBarOfDay[-1])
    then 1
    else 0;

#
# See this page for how to calculate the indicator
# https://www.interactivebrokers.com/en/software/tws/usersguidebook/technicalanalytics/fibonaccipivotpoints.htm
# Pivot Point (P) = (High + Low + Close)/3
# Support 1 (S1) = P - {.382 * (High - Low)}
# Support 2 (S2) = P - {.618 * (High - Low)}
# Support 3 (S3) = P - {1 * (High - Low)}
# Resistance 1 (R1) = P + {.382 * (High - Low)}
# Resistance 2 (R2) = P + {.618 * (High - Low)}
# Resistance 3 (R3) = P + {1 * (High - Low)}
#

def pc = close(period = AggregationPeriod)[1];
def ph = high(period = AggregationPeriod)[1];
def pl = low(period = AggregationPeriod)[1];

#Pivot Point (P) = (High + Low + Close)/3
#Support 1 (S1) = P - {.382 * (High - Low)}
#Support 2 (S2) = P - {.618 * (High - Low)}
#Support 3 (S3) = P - {1 * (High - Low)}
#Resistance 1 (R1) = P + {.382 * (High - Low)}
#Resistance 2 (R2) = P + {.618 * (High - Low)}
#Resistance 3 (R3) = P + {1 * (High - Low)}

def delta = ph - pl;
def pp = if firstBarOfDay then (pc+ph+pl)/3 else if lastBarOfDay then nan else pp[1];
def s1 = if firstBarOfDay then pp - (.382 * delta) else if lastBarOfDay then nan else s1[1];
def s2 = if firstBarOfDay then pp - (.618 * delta) else if lastBarOfDay then nan else s2[1];
def s3 = if firstBarOfDay then pp - (1 * delta) else if lastBarOfDay then nan else s3[1];
def r1 = if firstBarOfDay then pp + (.382 * delta) else if lastBarOfDay then nan else r1[1];
def r2 = if firstBarOfDay then pp + (.618 * delta) else if lastBarOfDay then nan else r2[1];
def r3 = if firstBarOfDay then pp + (1 * delta) else if lastBarOfDay then nan else r3[1];

plot ppp = pp;
plot ps1 = s1;
plot ps2 = s2;
plot ps3 = s3;
plot pr1 = r1;
plot pr2 = r2;
plot pr3 = r3;

ppp.SetDefaultColor(Color.Red);
ps1.SetDefaultColor(Color.Green);
ps2.SetDefaultColor(Color.White);
ps3.SetDefaultColor(Color.Magenta);
pr1.SetDefaultColor(Color.Yellow);
pr2.SetDefaultColor(Color.Violet);
pr3.SetDefaultColor(Color.Blue);
@RDMercer are you saying the two screenshots I included in the original post do not work for you, or you found some condition where the study does not work? Your post gives no insight into what does not work for you.
@RDMercer are you saying the two screenshots I included in the original post do not work for you, or you found some condition where the study does not work? Your post gives no insight into what does not work for you.
The study seems not to function over all time frames other than intra day or short time frame integration. (1min, 5min, etc) It doesn't work for a 1 y 1d or Wk or larger time frame. Granted, this mat be as designed / intended, might not have every setting 100% correct, or perhaps I misunderstood the study functionality to start with.
Hello, does anyone know where i can find the fibonacci pivot point indicator?
I found it for tradingview. The indicator shows on the chart the monthly fibonacci level and
three support and resistance levels as a line. I find the indicator very useful.
Thanks
Hello, does anyone know where i can find the fibonacci pivot point indicator?
I found it for tradingview. The indicator shows on the chart the monthly fibonacci level and
three support and resistance levels as a line. I find the indicator very useful.
Thanks
Hi, I found this indicator in the forum, I would like to add color painted area between 0,5-0.618 fib and 1.00-1.38 fib (the same with -0,5- to 0,618 and -1.00 to -1.382).
Can anyone help me please?
This will do one of them, the rest can be copied and pasted, and easily edited.
Code:
#this can be used for everything, don't repeat it.
Def Toggle =
    if !Toggle[1] and R1 != R1[1] then Yes
    else if Toggle[1] and R1 != R1[1] then No
    else Toggle[1]
;

#This will create one of the levels, repeat this for other levels.
#Change top1a to top2a, etc. Change R1 and R2 to what ever you want.

Def Top1a; Def Bot1a;
Def Top1b; Def Bot1b;

if Toggle {
    Top1a = R1;
    Top1b = Double.NaN;
    Bot1a = R2;
    Bot1b = Double.NaN;
} else {
    Top1a = Double.NaN;
    Top1b = R1;
    Bot1a = Double.NaN;
    Bot1b = R2;

}
AddCloud(Top1a,Bot1a);
AddCloud(Top1b,Bot1b);
The code is the fibs based on prev day close (could change to weekly, monthly if desired with some modification).
Pivot point studies highlight prices considered to be a likely turning point when looking at values from a previous period, whether it be daily, weekly, quarterly or annual. Each pivot point study has its own characteristics on how these points are calculated. The formula applied for the Fibonacci Pivot Points is:
Pivot Point (P) = (High + Low + Close)/3
Support 1 (S1) = P - {.382 * (High - Low)}
Support 2 (S2) = P - {.618 * (High - Low)}
Support 3 (S3) = P - {1 * (High - Low)}
Resistance 1 (R1) = P + {.382 * (High - Low)}
Resistance 2 (R2) = P + {.618 * (High - Low)}
Resistance 3 (R3) = P + {1 * (High - Low)}
thinkScript code
Code:
# IB_Fib_Pivots
# Author: Kory Gill, @korygill
#
# VERSION HISTORY (sortable date and time (your local time is fine), and your initials
# 20190906-1900-KG    - Created.
# ...
# ...

declare hide_on_daily;
declare once_per_bar;

input AggregationPeriod = AggregationPeriod.DAY;

#
# logic
#
def nan = Double.NaN;
def isRollover = GetYYYYMMDD() != GetYYYYMMDD()[1];
def beforeStart = GetTime() < RegularTradingStart(GetYYYYMMDD());
def afterEnd = GetTime() > RegularTradingEnd(GetYYYYMMDD());
def firstBarOfDay = if (beforeStart[1] == 1 and beforeStart == 0) or (isRollover and beforeStart == 0) then 1 else 0;
def lastBarOfDay = if
    (afterEnd[-1] == 1 and afterEnd == 0) or
    (isRollover[-1] and firstBarOfDay[-1])
    then 1
    else 0;

#
# See this page for how to calculate the indicator
# https://www.interactivebrokers.com/en/software/tws/usersguidebook/technicalanalytics/fibonaccipivotpoints.htm
# Pivot Point (P) = (High + Low + Close)/3
# Support 1 (S1) = P - {.382 * (High - Low)}
# Support 2 (S2) = P - {.618 * (High - Low)}
# Support 3 (S3) = P - {1 * (High - Low)}
# Resistance 1 (R1) = P + {.382 * (High - Low)}
# Resistance 2 (R2) = P + {.618 * (High - Low)}
# Resistance 3 (R3) = P + {1 * (High - Low)}
#

def pc = close(period = AggregationPeriod)[1];
def ph = high(period = AggregationPeriod)[1];
def pl = low(period = AggregationPeriod)[1];

#Pivot Point (P) = (High + Low + Close)/3
#Support 1 (S1) = P - {.382 * (High - Low)}
#Support 2 (S2) = P - {.618 * (High - Low)}
#Support 3 (S3) = P - {1 * (High - Low)}
#Resistance 1 (R1) = P + {.382 * (High - Low)}
#Resistance 2 (R2) = P + {.618 * (High - Low)}
#Resistance 3 (R3) = P + {1 * (High - Low)}

def delta = ph - pl;
def pp = if firstBarOfDay then (pc+ph+pl)/3 else if lastBarOfDay then nan else pp[1];
def s1 = if firstBarOfDay then pp - (.382 * delta) else if lastBarOfDay then nan else s1[1];
def s2 = if firstBarOfDay then pp - (.618 * delta) else if lastBarOfDay then nan else s2[1];
def s3 = if firstBarOfDay then pp - (1 * delta) else if lastBarOfDay then nan else s3[1];
def r1 = if firstBarOfDay then pp + (.382 * delta) else if lastBarOfDay then nan else r1[1];
def r2 = if firstBarOfDay then pp + (.618 * delta) else if lastBarOfDay then nan else r2[1];
def r3 = if firstBarOfDay then pp + (1 * delta) else if lastBarOfDay then nan else r3[1];

plot ppp = pp;
plot ps1 = s1;
plot ps2 = s2;
plot ps3 = s3;
plot pr1 = r1;
plot pr2 = r2;
plot pr3 = r3;

ppp.SetDefaultColor(Color.Red);
ps1.SetDefaultColor(Color.Green);
ps2.SetDefaultColor(Color.White);
ps3.SetDefaultColor(Color.Magenta);
pr1.SetDefaultColor(Color.Yellow);
pr2.SetDefaultColor(Color.Violet);
pr3.SetDefaultColor(Color.Blue);
Can someone add the option to show on expansion yes/no? in addition to have the options to show coefficient left/right and show price left/right. Thank you.
Can someone add the option to show on expansion yes/no? in addition to have the options to show coefficient left/right and show price left/right. Thank you.
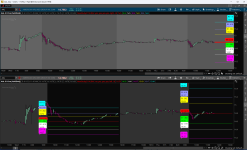
Added Onexpansion option and bubbles with left/right, price and coefficient options
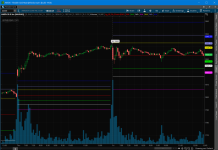
Image shows Onexpansion in upper chart and Display_Left in lower chart
Code:
# IB_Fib_Pivots
# Author: Kory Gill, @korygill
#
# VERSION HISTORY (sortable date and time (your local time is fine), and your initials
# 20190906-1900-KG    - Created.
# 20230601 Sleepyz - Added Onexpansion and Bubbles
# ...

declare hide_on_daily;
declare once_per_bar;

input AggregationPeriod = AggregationPeriod.DAY;

#
# logic
#
def nan = Double.NaN;
def isRollover = GetYYYYMMDD() != GetYYYYMMDD()[1];
def beforeStart = GetTime() < RegularTradingStart(GetYYYYMMDD());
def afterEnd = GetTime() > RegularTradingEnd(GetYYYYMMDD());
def firstBarOfDay = if (beforeStart[1] == 1 and beforeStart == 0) or (isRollover and beforeStart == 0) then  1 else 0;

def lastBarOfDay = if
    (afterEnd[-1] == 1 and afterEnd == 0) or
    (isRollover[-1] and firstBarOfDay[-1])
    then 1
    else 0;

input onexpansion = yes;
def pc = close(period = AggregationPeriod)[1];
def ph = high(period = AggregationPeriod)[1];
def pl = low(period = AggregationPeriod)[1];

def pcext = if IsNaN(close) then pcext[1] else pc;
def phext = if IsNaN(close) then phext[1] else ph;
def plext = if IsNaN(close) then plext[1] else pl;

def delta = if onexpansion then phext - plext else ph - pl;
def pp = if onexpansion then (pcext[1] + phext[1] + plext[1]) / 3 else if firstBarOfDay then (pc + ph + pl) / 3 else if lastBarOfDay then nan else pp[1];
def s1 = if onexpansion then  pp - (.382 * delta) else if firstBarOfDay then pp - (.382 * delta) else if lastBarOfDay then nan else s1[1];
def s2 = if onexpansion then  pp - (.618 * delta) else if firstBarOfDay then pp - (.618 * delta) else if lastBarOfDay then nan else s2[1];
def s3 = if onexpansion then  pp - (1 * delta) else if firstBarOfDay then pp - (1 * delta) else if lastBarOfDay then nan else s3[1];
def r1 = if onexpansion then  pp + (.382 * delta) else if firstBarOfDay then pp + (.382 * delta) else if lastBarOfDay then nan else r1[1];
def r2 = if onexpansion then  pp + (.618 * delta) else if firstBarOfDay then pp + (.618 * delta) else if lastBarOfDay then nan else r2[1];
def r3 = if onexpansion then  pp + (1 * delta) else if firstBarOfDay then pp + (1 * delta) else if lastBarOfDay then nan else r3[1];

plot ppp = if onexpansion and !IsNaN(close) then Double.NaN else pp;
plot ps1 = if onexpansion and !IsNaN(close) then Double.NaN else s1;
plot ps2 = if onexpansion and !IsNaN(close) then Double.NaN else s2;
plot ps3 = if onexpansion and !IsNaN(close) then Double.NaN else s3;
plot pr1 = if onexpansion and !IsNaN(close) then Double.NaN else r1;
plot pr2 = if onexpansion and !IsNaN(close) then Double.NaN else r2;
plot pr3 = if onexpansion and !IsNaN(close) then Double.NaN else r3;

ppp.SetDefaultColor(Color.RED);
ps1.SetDefaultColor(Color.GREEN);
ps2.SetDefaultColor(Color.WHITE);
ps3.SetDefaultColor(Color.MAGENTA);
pr1.SetDefaultColor(Color.YELLOW);
pr2.SetDefaultColor(Color.VIOLET);
pr3.SetDefaultColor(Color.CYAN);

input show_bubble = yes;
input show_price  = yes;
input show_coeff  = yes;
input bubble_display = {default right, left, none};

input left_bubblemover = -9;
def   b  = left_bubblemover;
def   b1 = b + 1;

AddChartBubble(
(if show_bubble and !onexpansion
then if bubble_display == bubble_display.left
then if IsNaN(close) then Double.NaN else IsNaN(ppp[b1]) and !IsNaN(ppp[b])
else if bubble_display == bubble_display.right
then lastBarOfDay == 0 and lastBarOfDay[-1] == 1
else Double.NaN
else if show_bubble and onexpansion
then BarNumber() == HighestAll(BarNumber())
else Double.NaN), if bubble_display == bubble_display.right then ppp else ppp[b], "PP" +
if show_price then " " + if bubble_display == bubble_display.right then AsText(ppp) else AsText(ppp[b]) else ""
, ppp.TakeValueColor() );

AddChartBubble(
(if show_bubble and !onexpansion
then if bubble_display == bubble_display.left
then if IsNaN(close) then Double.NaN else IsNaN(ppp[b1]) and !IsNaN(ppp[b])
else if bubble_display == bubble_display.right
then lastBarOfDay == 0 and lastBarOfDay[-1] == 1
else Double.NaN
else if show_bubble and onexpansion
then BarNumber() == HighestAll(BarNumber())
else Double.NaN), if bubble_display == bubble_display.right then ps1 else ps1[b], "S1 " +
(if show_coeff then "-.382" else "") +
if show_price then "\n" + if bubble_display == bubble_display.right then AsText(ps1) else AsText(ps1[b]) else "", ps1.TakeValueColor());

AddChartBubble(
(if show_bubble and !onexpansion
then if bubble_display == bubble_display.left
then if IsNaN(close) then Double.NaN else IsNaN(ppp[b1]) and !IsNaN(ppp[b])
else if bubble_display == bubble_display.right
then lastBarOfDay == 0 and lastBarOfDay[-1] == 1
else Double.NaN
else if show_bubble and onexpansion
then BarNumber() == HighestAll(BarNumber())
else Double.NaN), if bubble_display == bubble_display.right then ps2 else ps2[b], "S2 " +
(if show_coeff then "-.618" else "") +
if show_price then "\n" + if bubble_display == bubble_display.right then AsText(ps2) else AsText(ps2[b]) else "", ps2.TakeValueColor());

AddChartBubble(
(if show_bubble and !onexpansion
then if bubble_display == bubble_display.left
then if IsNaN(close) then Double.NaN else IsNaN(ppp[b1]) and !IsNaN(ppp[b])
else if bubble_display == bubble_display.right
then lastBarOfDay == 0 and lastBarOfDay[-1] == 1
else Double.NaN
else if show_bubble and onexpansion
then BarNumber() == HighestAll(BarNumber())
else Double.NaN), if bubble_display == bubble_display.right then ps3 else ps3[b], "S3 " +
(if show_coeff then "-1.0" else "") +
if show_price then "\n" + if bubble_display == bubble_display.right then AsText(ps3) else AsText(ps3[b]) else "", ps3.TakeValueColor());

AddChartBubble(
(if show_bubble and !onexpansion
then if bubble_display == bubble_display.left
then if IsNaN(close) then Double.NaN else IsNaN(ppp[b1]) and !IsNaN(ppp[b])
else if bubble_display == bubble_display.right
then lastBarOfDay == 0 and lastBarOfDay[-1] == 1
else Double.NaN
else if show_bubble and onexpansion
then BarNumber() == HighestAll(BarNumber())
else Double.NaN), if bubble_display == bubble_display.right then pr1 else pr1[b], "R1 " +
(if show_coeff then ".382" else "") +
if show_price then "\n" + if bubble_display == bubble_display.right then AsText(pr1) else AsText(pr1[b]) else "", pr1.TakeValueColor());

AddChartBubble(
(if show_bubble and !onexpansion
then if bubble_display == bubble_display.left
then if IsNaN(close) then Double.NaN else IsNaN(ppp[b1]) and !IsNaN(ppp[b])
else if bubble_display == bubble_display.right
then lastBarOfDay == 0 and lastBarOfDay[-1] == 1
else Double.NaN
else if show_bubble and onexpansion
then BarNumber() == HighestAll(BarNumber())
else Double.NaN), if bubble_display == bubble_display.right then pr2 else pr2[b], "R2 " +
(if show_coeff then ".618" else "") +
if show_price then "\n" + if bubble_display == bubble_display.right then AsText(pr2) else AsText(pr2[b]) else "", pr2.TakeValueColor());

AddChartBubble(
(if show_bubble and !onexpansion
then if bubble_display == bubble_display.left
then if IsNaN(close) then Double.NaN else IsNaN(ppp[b1]) and !IsNaN(ppp[b])
else if bubble_display == bubble_display.right
then lastBarOfDay == 0 and lastBarOfDay[-1] == 1
else Double.NaN
else if show_bubble and onexpansion
then BarNumber() == HighestAll(BarNumber())
else Double.NaN), if bubble_display == bubble_display.right then pr3 else pr3[b], "R3 " +
(if show_coeff then "1.0" else "") +
if show_price then "\n" + if bubble_display == bubble_display.right then AsText(pr3) else AsText(pr3[b]) else "", pr3.TakeValueColor());

ppp.HideBubble();
ps1.HideBubble();
ps2.HideBubble();
ps3.HideBubble();
pr1.HideBubble();
pr2.HideBubble();
pr3.HideBubble();

#
Hi SleepyZ!
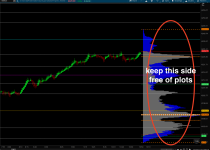
The show on expansion side of this script works perfectly fine and I love it! I just have some additional requests to fix the plots for the non expansion side of the chart if possible.
1. Can you change this so when choosing "show no" on expansion the plots does not go over the expansion side? the plots can stop with the very last candle on the chart. I need to keep the expansion side clean to avoid overlapping studies.
2. Is there anyway possible the coefficient and price info are not a fixed bubble to the left side of the screen when choosing "show values on left" but follows the current chart just like the actual Fibonacci Retracements tool does in TOS?
Hi SleepyZ!
The show on expansion side of this script works perfectly fine and I love it! I just have some additional requests to fix the plots for the non expansion side of the chart if possible.
1. Can you change this so when choosing "show no" on expansion the plots does not go over the expansion side? the plots can stop with the very last candle on the chart. I need to keep the expansion side clean to avoid overlapping studies.
2. Is there anyway possible the coefficient and price info are not a fixed bubble to the left side of the screen when choosing "show values on left" but follows the current chart just like the actual Fibonacci Retracements tool does in TOS?
1. This should keep the plot of the lines within the active bars. The bubbles will work for left and onexpansion before the lastbaroftheday. The right will only work for lastbarofday occurring.
2. The labels created with drawing tool can only be created in thinkscript with bubbles. I have reformated the bubbles to only include what you depicted in the drawing tool. The left bubbles can be adjusted with the input bubblemover.
Code:
# IB_Fib_Pivots
# Author: Kory Gill, @korygill
#
# VERSION HISTORY (sortable date and time (your local time is fine), and your initials
# 20190906-1900-KG    - Created.
# 20230601 Sleepyz - Added Onexpansion and Bubbles
# ...

declare hide_on_daily;
declare once_per_bar;

input AggregationPeriod = AggregationPeriod.DAY;

#
# logic
#
def nan = Double.NaN;
def isRollover = GetYYYYMMDD() != GetYYYYMMDD()[1];
def beforeStart = GetTime() < RegularTradingStart(GetYYYYMMDD());
def afterEnd = GetTime() > RegularTradingEnd(GetYYYYMMDD());
def firstBarOfDay = if (beforeStart[1] == 1 and beforeStart == 0) or (isRollover and beforeStart == 0) then  1 else 0;

def lastBarOfDay = if
    (afterEnd[-1] == 1 and afterEnd == 0) or
    (isRollover[-1] and firstBarOfDay[-1])
    then 1
    else 0;

input onexpansion = no;
def pc = close(period = AggregationPeriod)[1];
def ph = high(period = AggregationPeriod)[1];
def pl = low(period = AggregationPeriod)[1];

def pcext = if IsNaN(close) then pcext[1] else pc;
def phext = if IsNaN(close) then phext[1] else ph;
def plext = if IsNaN(close) then plext[1] else pl;

def delta = if onexpansion then phext - plext else ph - pl;
def pp = if onexpansion then (pcext[1] + phext[1] + plext[1]) / 3 else if firstBarOfDay then (pc + ph + pl) / 3 else if  lastBarOfDay or IsNaN(close) then nan else pp[1];
def s1 = if onexpansion then  pp - (.382 * delta) else if firstBarOfDay then pp - (.382 * delta) else if lastBarOfDay or IsNaN(close) then nan else s1[1];
def s2 = if onexpansion then  pp - (.618 * delta) else if firstBarOfDay then pp - (.618 * delta) else if lastBarOfDay or IsNaN(close) then nan else s2[1];
def s3 = if onexpansion then  pp - (1 * delta) else if firstBarOfDay then pp - (1 * delta) else if lastBarOfDay or IsNaN(close) then nan else s3[1];
def r1 = if onexpansion then  pp + (.382 * delta) else if firstBarOfDay then pp + (.382 * delta) else if lastBarOfDay or IsNaN(close) then nan else r1[1];
def r2 = if onexpansion then  pp + (.618 * delta) else if firstBarOfDay then pp + (.618 * delta) else if lastBarOfDay or IsNaN(close) then nan else r2[1];
def r3 = if onexpansion then  pp + (1 * delta) else if firstBarOfDay then pp + (1 * delta) else if lastBarOfDay or IsNaN(close) then nan else r3[1];

plot ppp = if onexpansion and !IsNaN(close) then Double.NaN else  pp;
plot ps1 = if onexpansion and !IsNaN(close) then Double.NaN else s1;
plot ps2 = if onexpansion and !IsNaN(close) then Double.NaN else s2;
plot ps3 = if onexpansion and !IsNaN(close) then Double.NaN else s3;
plot pr1 = if onexpansion and !IsNaN(close) then Double.NaN else r1;
plot pr2 = if onexpansion and !IsNaN(close) then Double.NaN else r2;
plot pr3 = if onexpansion and !IsNaN(close) then Double.NaN else r3;

ppp.SetDefaultColor(Color.RED);
ps1.SetDefaultColor(Color.GREEN);
ps2.SetDefaultColor(Color.WHITE);
ps3.SetDefaultColor(Color.MAGENTA);
pr1.SetDefaultColor(Color.YELLOW);
pr2.SetDefaultColor(Color.VIOLET);
pr3.SetDefaultColor(Color.CYAN);

input show_bubble = yes;
input show_price  = yes;
input show_coeff  = yes;
input bubble_display = {default left, right, none};

input left_bubblemover = -19;
def   b  = left_bubblemover;
def   b1 = b + 1;

AddChartBubble(
(if show_bubble and !onexpansion
then if bubble_display == bubble_display.left
then if IsNaN(close) then Double.NaN else IsNaN(ppp[b1]) and !IsNaN(ppp[b])
else if bubble_display == bubble_display.right
then lastBarOfDay == 0 and lastBarOfDay[-1] == 1
else Double.NaN
else if show_bubble and onexpansion
then BarNumber() == HighestAll(BarNumber())
else Double.NaN), if bubble_display == bubble_display.right then ppp else ppp[b], if show_price then AsPercent(0) + " " + if bubble_display == bubble_display.right then AsText(ppp) else AsText(ppp[b]) else ""
, ppp.TakeValueColor() );

AddChartBubble(
(if show_bubble and !onexpansion
then if bubble_display == bubble_display.left
then if IsNaN(close) then Double.NaN else IsNaN(ppp[b1]) and !IsNaN(ppp[b])
else if bubble_display == bubble_display.right
then lastBarOfDay == 0 and lastBarOfDay[-1] == 1
else Double.NaN
else if show_bubble and onexpansion
then BarNumber() == HighestAll(BarNumber())
else Double.NaN), if bubble_display == bubble_display.right then ps1 else ps1[b],
(if show_coeff then AsPercent(-.382) else "") +
if show_price then "" + if bubble_display == bubble_display.right then AsText(ps1) else AsText(ps1[b]) else "", ps1.TakeValueColor());

AddChartBubble(
(if show_bubble and !onexpansion
then if bubble_display == bubble_display.left
then if IsNaN(close) then Double.NaN else IsNaN(ppp[b1]) and !IsNaN(ppp[b])
else if bubble_display == bubble_display.right
then lastBarOfDay == 0 and lastBarOfDay[-1] == 1
else Double.NaN
else if show_bubble and onexpansion
then BarNumber() == HighestAll(BarNumber())
else Double.NaN), if bubble_display == bubble_display.right then ps2 else ps2[b],
(if show_coeff then AsPercent(-.618) else "") +
if show_price then "" + if bubble_display == bubble_display.right then AsText(ps2) else AsText(ps2[b]) else "", ps2.TakeValueColor());

AddChartBubble(
(if show_bubble and !onexpansion
then if bubble_display == bubble_display.left
then if IsNaN(close) then Double.NaN else IsNaN(ppp[b1]) and !IsNaN(ppp[b])
else if bubble_display == bubble_display.right
then lastBarOfDay == 0 and lastBarOfDay[-1] == 1
else Double.NaN
else if show_bubble and onexpansion
then BarNumber() == HighestAll(BarNumber())
else Double.NaN), if bubble_display == bubble_display.right then ps3 else ps3[b],
(if show_coeff then AsPercent(-1.0) else "") +
if show_price then "" + if bubble_display == bubble_display.right then AsText(ps3) else AsText(ps3[b]) else "", ps3.TakeValueColor());

AddChartBubble(
(if show_bubble and !onexpansion
then if bubble_display == bubble_display.left
then if IsNaN(close) then Double.NaN else IsNaN(ppp[b1]) and !IsNaN(ppp[b])
else if bubble_display == bubble_display.right
then lastBarOfDay == 0 and lastBarOfDay[-1] == 1
else Double.NaN
else if show_bubble and onexpansion
then BarNumber() == HighestAll(BarNumber())
else Double.NaN), if bubble_display == bubble_display.right then pr1 else pr1[b],
(if show_coeff then AsPercent(.382) else "") +
if show_price then "" + if bubble_display == bubble_display.right then AsText(pr1) else AsText(pr1[b]) else "", pr1.TakeValueColor());

AddChartBubble(
(if show_bubble and !onexpansion
then if bubble_display == bubble_display.left
then if IsNaN(close) then Double.NaN else IsNaN(ppp[b1]) and !IsNaN(ppp[b])
else if bubble_display == bubble_display.right
then lastBarOfDay == 0 and lastBarOfDay[-1] == 1
else Double.NaN
else if show_bubble and onexpansion
then BarNumber() == HighestAll(BarNumber())
else Double.NaN), if bubble_display == bubble_display.right then pr2 else pr2[b],
(if show_coeff then AsPercent(.618) else "") +
if show_price then "" + if bubble_display == bubble_display.right then AsText(pr2) else AsText(pr2[b]) else "", pr2.TakeValueColor());

AddChartBubble(
(if show_bubble and !onexpansion
then if bubble_display == bubble_display.left
then if IsNaN(close) then Double.NaN else IsNaN(ppp[b1]) and !IsNaN(ppp[b])
else if bubble_display == bubble_display.right
then lastBarOfDay == 0 and lastBarOfDay[-1] == 1
else Double.NaN
else if show_bubble and onexpansion
then BarNumber() == HighestAll(BarNumber())
else Double.NaN), if bubble_display == bubble_display.right then pr3 else pr3[b],
(if show_coeff then AsPercent(1.0) else "") +
if show_price then "" + if bubble_display == bubble_display.right then AsText(pr3) else AsText(pr3[b]) else "", pr3.TakeValueColor());

ppp.HideBubble();
ps1.HideBubble();
ps2.HideBubble();
ps3.HideBubble();
pr1.HideBubble();
pr2.HideBubble();
pr3.HideBubble();

#
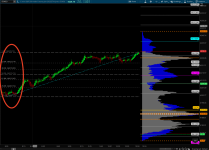
Thanks for the follow up SleepyZ.
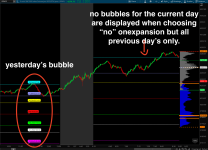
it appears to have a minor glitch when choosing "no" onexpansion where it is plotting all other previous days only except for the current day needed. It will be great if we can also choose to see previous days or only current days bubbles.
Please see the attached for your reference.
Thanks for the follow up SleepyZ.
it appears to have a minor glitch when choosing "no" onexpansion where it is plotting all other previous days only except for the current day needed. It will be great if we can also choose to see previous days or only current days bubbles.
Please see the attached for your reference.
# IB_Fib_Pivots
# Author: Kory Gill, @korygill
#
# VERSION HISTORY (sortable date and time (your local time is fine), and your initials
# 20190906-1900-KG    - Created.
# 20230601 Sleepyz - Added Onexpansion and Bubbles
# ...

declare hide_on_daily;
declare once_per_bar;

input AggregationPeriod = AggregationPeriod.DAY;

#
# logic
#
def nan = Double.NaN;
def isRollover = GetYYYYMMDD() != GetYYYYMMDD()[1];
def beforeStart = GetTime() < RegularTradingStart(GetYYYYMMDD());
def afterEnd = GetTime() > RegularTradingEnd(GetYYYYMMDD());
def firstBarOfDay = if (beforeStart[1] == 1 and beforeStart == 0) or (isRollover and beforeStart == 0) then  1 else 0;

def lastBarOfDay = if
    (afterEnd[-1] == 1 and afterEnd == 0) or
    (isRollover[-1] and firstBarOfDay[-1])
    then 1
    else 0;

input onexpansion = no;
def pc = close(period = AggregationPeriod)[1];
def ph = high(period = AggregationPeriod)[1];
def pl = low(period = AggregationPeriod)[1];

def pcext = if IsNaN(close) then pcext[1] else pc;
def phext = if IsNaN(close) then phext[1] else ph;
def plext = if IsNaN(close) then plext[1] else pl;

def delta = if onexpansion then phext - plext else ph - pl;
def pp = if onexpansion then (pcext[1] + phext[1] + plext[1]) / 3 else if firstBarOfDay then (pc + ph + pl) / 3 else if  lastBarOfDay or IsNaN(close) then nan else pp[1];
def s1 = if onexpansion then  pp - (.382 * delta) else if firstBarOfDay then pp - (.382 * delta) else if lastBarOfDay or IsNaN(close) then nan else s1[1];
def s2 = if onexpansion then  pp - (.618 * delta) else if firstBarOfDay then pp - (.618 * delta) else if lastBarOfDay or IsNaN(close) then nan else s2[1];
def s3 = if onexpansion then  pp - (1 * delta) else if firstBarOfDay then pp - (1 * delta) else if lastBarOfDay or IsNaN(close) then nan else s3[1];
def r1 = if onexpansion then  pp + (.382 * delta) else if firstBarOfDay then pp + (.382 * delta) else if lastBarOfDay or IsNaN(close) then nan else r1[1];
def r2 = if onexpansion then  pp + (.618 * delta) else if firstBarOfDay then pp + (.618 * delta) else if lastBarOfDay or IsNaN(close) then nan else r2[1];
def r3 = if onexpansion then  pp + (1 * delta) else if firstBarOfDay then pp + (1 * delta) else if lastBarOfDay or IsNaN(close) then nan else r3[1];

plot ppp = if onexpansion and !IsNaN(close) then Double.NaN else  pp;
plot ps1 = if onexpansion and !IsNaN(close) then Double.NaN else s1;
plot ps2 = if onexpansion and !IsNaN(close) then Double.NaN else s2;
plot ps3 = if onexpansion and !IsNaN(close) then Double.NaN else s3;
plot pr1 = if onexpansion and !IsNaN(close) then Double.NaN else r1;
plot pr2 = if onexpansion and !IsNaN(close) then Double.NaN else r2;
plot pr3 = if onexpansion and !IsNaN(close) then Double.NaN else r3;

ppp.SetDefaultColor(Color.RED);
ps1.SetDefaultColor(Color.GREEN);
ps2.SetDefaultColor(Color.WHITE);
ps3.SetDefaultColor(Color.MAGENTA);
pr1.SetDefaultColor(Color.YELLOW);
pr2.SetDefaultColor(Color.VIOLET);
pr3.SetDefaultColor(Color.CYAN);

input show_bubble = yes;
input show_price  = yes;
input show_coeff  = yes;
input bubble_display = {default left, right, none};

input left_bubblemover = -27;
def   b  = left_bubblemover;
def   b1 = b + 1;

AddChartBubble(
(if show_bubble and !onexpansion
then if bubble_display == bubble_display.left
then if IsNaN(close) then Double.NaN else IsNaN(ppp[b1]) and !IsNaN(ppp[b])
else if bubble_display == bubble_display.right
then if GetDay() == GetLastDay() and !onexpansion then IsNaN(close[-1]) and !IsNaN(close) else lastBarOfDay == 0 and lastBarOfDay[-1] == 1
else Double.NaN
else if show_bubble and onexpansion
then BarNumber() == HighestAll(BarNumber())
else Double.NaN), if bubble_display == bubble_display.right then ppp else ppp[b], if show_price then AsPercent(0) + " " + if bubble_display == bubble_display.right then AsText(ppp) else AsText(ppp[b]) else ""
, ppp.TakeValueColor() );

AddChartBubble(
(if show_bubble and !onexpansion
then if bubble_display == bubble_display.left
then if IsNaN(close) then Double.NaN else IsNaN(ppp[b1]) and !IsNaN(ppp[b])
else if bubble_display == bubble_display.right
then if GetDay() == GetLastDay() and !onexpansion then IsNaN(close[-1]) and !IsNaN(close) else lastBarOfDay == 0 and lastBarOfDay[-1] == 1
else Double.NaN
else if show_bubble and onexpansion
then BarNumber() == HighestAll(BarNumber())
else Double.NaN), if bubble_display == bubble_display.right then ps1 else ps1[b],
(if show_coeff then AsPercent(-.382) else "") +
if show_price then " " + if bubble_display == bubble_display.right then AsText(ps1) else AsText(ps1[b]) else "", ps1.TakeValueColor());

AddChartBubble(
(if show_bubble and !onexpansion
then if bubble_display == bubble_display.left
then if IsNaN(close) then Double.NaN else IsNaN(ppp[b1]) and !IsNaN(ppp[b])
else if bubble_display == bubble_display.right
then if GetDay() == GetLastDay() and !onexpansion then IsNaN(close[-1]) and !IsNaN(close) else lastBarOfDay == 0 and lastBarOfDay[-1] == 1
else Double.NaN
else if show_bubble and onexpansion
then BarNumber() == HighestAll(BarNumber())
else Double.NaN), if bubble_display == bubble_display.right then ps2 else ps2[b],
(if show_coeff then AsPercent(-.618) else "") +
if show_price then " " + if bubble_display == bubble_display.right then AsText(ps2) else AsText(ps2[b]) else "", ps2.TakeValueColor());

AddChartBubble(
(if show_bubble and !onexpansion
then if bubble_display == bubble_display.left
then if IsNaN(close) then Double.NaN else IsNaN(ppp[b1]) and !IsNaN(ppp[b])
else if bubble_display == bubble_display.right
then if GetDay() == GetLastDay() and !onexpansion then IsNaN(close[-1]) and !IsNaN(close) else lastBarOfDay == 0 and lastBarOfDay[-1] == 1
else Double.NaN
else if show_bubble and onexpansion
then BarNumber() == HighestAll(BarNumber())
else Double.NaN), if bubble_display == bubble_display.right then ps3 else ps3[b],
(if show_coeff then AsPercent(-1.0) else "") +
if show_price then " " + if bubble_display == bubble_display.right then AsText(ps3) else AsText(ps3[b]) else "", ps3.TakeValueColor());

AddChartBubble(
(if show_bubble and !onexpansion
then if bubble_display == bubble_display.left
then if IsNaN(close) then Double.NaN else IsNaN(ppp[b1]) and !IsNaN(ppp[b])
else if bubble_display == bubble_display.right
then if GetDay() == GetLastDay() and !onexpansion then IsNaN(close[-1]) and !IsNaN(close) else lastBarOfDay == 0 and lastBarOfDay[-1] == 1
else Double.NaN
else if show_bubble and onexpansion
then BarNumber() == HighestAll(BarNumber())
else Double.NaN), if bubble_display == bubble_display.right then pr1 else pr1[b],
(if show_coeff then AsPercent(.382) else "") +
if show_price then " " + if bubble_display == bubble_display.right then AsText(pr1) else AsText(pr1[b]) else "", pr1.TakeValueColor());

AddChartBubble(
(if show_bubble and !onexpansion
then if bubble_display == bubble_display.left
then if IsNaN(close) then Double.NaN else IsNaN(ppp[b1]) and !IsNaN(ppp[b])
else if bubble_display == bubble_display.right
then if GetDay() == GetLastDay() and !onexpansion then IsNaN(close[-1]) and !IsNaN(close) else lastBarOfDay == 0 and lastBarOfDay[-1] == 1
else Double.NaN
else if show_bubble and onexpansion
then BarNumber() == HighestAll(BarNumber())
else Double.NaN), if bubble_display == bubble_display.right then pr2 else pr2[b],
(if show_coeff then AsPercent(.618) else "") +
if show_price then " " + if bubble_display == bubble_display.right then AsText(pr2) else AsText(pr2[b]) else "", pr2.TakeValueColor());

AddChartBubble(
(if show_bubble and !onexpansion
then if bubble_display == bubble_display.left
then if IsNaN(close) then Double.NaN else IsNaN(ppp[b1]) and !IsNaN(ppp[b])
else if bubble_display == bubble_display.right
then if GetDay() == GetLastDay() and !onexpansion then IsNaN(close[-1]) and !IsNaN(close) else lastBarOfDay == 0 and lastBarOfDay[-1] == 1
else Double.NaN
else if show_bubble and onexpansion
then BarNumber() == HighestAll(BarNumber())
else Double.NaN), if bubble_display == bubble_display.right then pr3 else pr3[b],
(if show_coeff then AsPercent(1.0) else "") +
if show_price then " " + if bubble_display == bubble_display.right then AsText(pr3) else AsText(pr3[b]) else "", pr3.TakeValueColor());

ppp.HideBubble();
ps1.HideBubble();
ps2.HideBubble();
ps3.HideBubble();
pr1.HideBubble();
pr2.HideBubble();
pr3.HideBubble();

#
useThinkScript is the #1 community of stock market investors using indicators and other tools to power their trading strategies. Traders of all skill levels use our forums to learn about scripting and indicators, help each other, and discover new ways to gain an edge in the markets.
How do I get started?
We get it. Our forum can be intimidating, if not overwhelming. With thousands of topics, tens of thousands of posts, our community has created an incredibly deep knowledge base for stock traders. No one can ever exhaust every resource provided on our site.
If you are new, or just looking for guidance, here are some helpful links to get you started.
VIP members get exclusive access to these proven and tested premium indicators: Buy the Dip, Advanced Market Moves 2.0, Take Profit, and Volatility Trading Range. In addition, VIP members get access to over 50 VIP-only custom indicators, add-ons, and strategies, private VIP-only forums, private Discord channel to discuss trades and strategies in real-time, customer support, trade alerts, and much more. Learn all about VIP membership here.
How can I access the premium indicators?
To access the premium indicators, which are plug and play ready, sign up for VIP membership here.

")