#fibs_futures_6pm
#https://usethinkscript.com/threads/fib-levels-for-futures.18004/
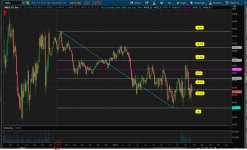
#fib levels for Futures
def na = Double.NaN;
def bn = barnumber();
def d = GetDay();
def dlast = getlastday();
def isprevd = d+1 == dlast;
#def day_first = d[1] != d[0];
def lastbn = highestall(if isnan(close) then 0 else bn);
# bubble offset
def buboff = 6;
def bubbn = (!isnan(close[buboff+1]) and isnan(close[buboff]));
# start at 6pm
input st1 = 1800;
def start = secondstilltime(st1)[1] > 0 and secondsfromtime(st1) >= 0;
def n = 1500;
def big = 99999;
def hi;
def lo;
def hioff;
def looff;
def hibn;
def lobn;
if bn == 1 then {
hi = na;
lo = na;
hioff = na;
looff = na;
hibn = na;
lobn = na;
#} else if day_last then {
} else if isprevd and start then {
hi = fold e = 1 to n
with p
while !isnan(getvalue(close, -e))
do max(p, getvalue(high, -e));
lo = fold f = 1 to n
with q = big
while !isnan(getvalue(close, -f))
do min(q, getvalue(low, -f));
hioff = fold g = 0 to n
with r
while getvalue(high, -g) != hi
do r + 1;
looff = fold h = 0 to n
with s
while getvalue(low, -h) != lo
do s + 1;
hibn = bn + hioff;
lobn = bn + looff;
} else {
hi = hi[1];
lo = lo[1];
hioff = 0;
looff = 0;
hibn = hibn[1];
lobn = lobn[1];
}
def ishifirst = (hibn < lobn);
def oneprice = if ishifirst then hi else lo;
def twoprice = if ishifirst then lo else hi;
def rng = hi - lo;
# 23.6%, 38.2%, 50%, 61.8%, and 78.6%.
def f1 = 23.6;
def f2 = 38.2;
def f3 = 50;
def f4 = 61.8;
def f5 = 78.6;
def fib1 = (rng * f1/100) + lo;
def fib2 = (rng * f2/100) + lo;
def fib3 = (rng * f3/100) + lo;
def fib4 = (rng * f4/100) + lo;
def fib5 = (rng * f5/100) + lo;
# one = first peak/valley , two = second one
def one = min(hibn,lobn);
def two = max(hibn,lobn);
def period = (bn >= one and bn <= two);
#def slope , bar to bar
def slope = (twoprice - oneprice)/(max(hibn,lobn) - min(hibn,lobn));
# slope line
def y = if bn == 1 then na
else if !period[1] and period then oneprice
else if period then (y[1] + slope)
else na;
plot y2 = y;
y2.setdefaultcolor(color.cyan);
def en = hi != 0 and lo != big;
plot z1 = if en then hi else na;
plot z2 = if en then lo else na;
z1.SetPaintingStrategy(PaintingStrategy.HORIZONTAL);
z1.SetDefaultColor(Color.white);
#z1.setlineweight(1);
#z1.hidebubble();
z2.SetPaintingStrategy(PaintingStrategy.HORIZONTAL);
z2.SetDefaultColor(Color.white);
#z2.setlineweight(1);
#z2.hidebubble();
def ispk = (bn == hibn);
def isval = (bn == lobn);
input vert_lines = no;
addverticalline(vert_lines and ispk, "-", color.gray);
addverticalline(vert_lines and isval, "-", color.gray);
plot zf1 = if en then fib1 else na;
plot zf2 = if en then fib2 else na;
plot zf3 = if en then fib3 else na;
plot zf4 = if en then fib4 else na;
plot zf5 = if en then fib5 else na;
zf1.SetDefaultColor(Color.light_gray);
zf2.SetDefaultColor(Color.light_gray);
zf3.SetDefaultColor(Color.magenta);
zf4.SetDefaultColor(Color.light_gray);
zf5.SetDefaultColor(Color.light_gray);
# fib line label data, starting at bottom and going up
def b0 = if ishifirst then 0 else 100;
def b1 = if ishifirst then f1 else f5;
def b2 = if ishifirst then f2 else f4;
def b3 = if ishifirst then f3 else f3;
def b4 = if ishifirst then f4 else f2;
def b5 = if ishifirst then f5 else f1;
def b6 = if ishifirst then 100 else 0;
addchartbubble(bubbn, lo, b0 + "%", color.yellow, no);
addchartbubble(bubbn, fib1, b1 + "%", color.yellow, no);
addchartbubble(bubbn, fib2, b2 + "%", color.yellow, no);
addchartbubble(bubbn, fib3, b3 + "%", color.yellow, no);
addchartbubble(bubbn, fib4, b4 + "%", color.yellow, yes);
addchartbubble(bubbn, fib5, b5 + "%", color.yellow, yes);
addchartbubble(bubbn, hi, b6 + "%", color.yellow, yes);
input test1_labels = no;
addlabel(test1_labels, slope);
addlabel(test1_labels, "hi " + hibn, color.yellow);
addlabel(test1_labels, "lo " + lobn, color.yellow);
# verify last bar
#addverticalline(last1, "-", color.cyan);
#