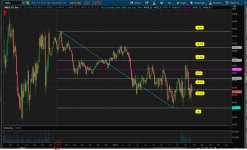
fib levels for Futures

I want a script that automatically draws the fib levels for Futures between the highest to lowest point from market open (6pm to current time). So if ES opened at 5000 at 6pm, had a high of 5100 during overnight session, and a low of 4950 at 10:30am, it should calculate and draw (and keep updating) the FIB levels between the new high and lows. Is that possible? I believe the code above only does fib levels for the overnight session and does not take into account cash market session, correct?
 
Solution
I want a script that automatically draws the fib levels for Futures between the highest to lowest point from market open (6pm to current time). So if ES opened at 5000 at 6pm, had a high of 5100 during overnight session, and a low of 4950 at 10:30am, it should calculate and draw (and keep updating) the FIB levels between the new high and lows. Is that possible? I believe the code above only does fib levels for the overnight session and does not take into account cash market session, correct?


this draws fib lines , from 6pm yesterday.
finds the highest and lowest prices (peak and valley)
then determines which happens first, to determine if fib numbers count up or down.
draws a diagonal line, from peak to valley, that defines...
I want a script that automatically draws the fib levels for Futures between the highest to lowest point from market open (6pm to current time). So if ES opened at 5000 at 6pm, had a high of 5100 during overnight session, and a low of 4950 at 10:30am, it should calculate and draw (and keep updating) the FIB levels between the new high and lows. Is that possible? I believe the code above only does fib levels for the overnight session and does not take into account cash market session, correct?


this draws fib lines , from 6pm yesterday.
finds the highest and lowest prices (peak and valley)
then determines which happens first, to determine if fib numbers count up or down.
draws a diagonal line, from peak to valley, that defines fib range.

for testing, load the futures watchlist and look at a few.

Code:
#fibs_futures_6pm

#https://usethinkscript.com/threads/fib-levels-for-futures.18004/
#fib levels for Futures


def na = Double.NaN;
def bn = barnumber();

def d = GetDay();
def dlast = getlastday();
def isprevd = d+1 == dlast;
#def day_first = d[1] != d[0];

def lastbn = highestall(if isnan(close) then 0 else bn);

# bubble offset
def buboff = 6;
def bubbn = (!isnan(close[buboff+1]) and isnan(close[buboff]));

# start at 6pm
input st1 = 1800;
def start = secondstilltime(st1)[1] > 0 and secondsfromtime(st1) >= 0;


def n = 1500;
def big = 99999;

def hi;
def lo;
def hioff;
def looff;
def hibn;
def lobn;
if bn == 1 then {
  hi = na;
  lo = na;
  hioff = na;
  looff = na;
  hibn = na;
  lobn = na;
#} else if day_last then {
} else if isprevd and start then {
  hi = fold e = 1 to n
  with p
  while !isnan(getvalue(close, -e))
  do max(p, getvalue(high, -e));
  lo = fold f = 1 to n
  with q = big
  while !isnan(getvalue(close, -f))
  do min(q, getvalue(low, -f));
  hioff = fold g = 0 to n
  with r
  while getvalue(high, -g) != hi
  do r + 1;
  looff = fold h = 0 to n
  with s
  while getvalue(low, -h) != lo
  do s + 1;
  hibn = bn + hioff;
  lobn = bn + looff;
} else {
  hi = hi[1];
  lo = lo[1];
  hioff = 0;
  looff = 0;
  hibn = hibn[1];
  lobn = lobn[1];
}


def ishifirst = (hibn < lobn);
def oneprice = if ishifirst then hi else lo;
def twoprice = if ishifirst then lo else hi;
def rng = hi - lo;


# 23.6%, 38.2%, 50%, 61.8%, and 78.6%.
def f1 = 23.6;
def f2 = 38.2;
def f3 = 50;
def f4 = 61.8;
def f5 = 78.6;

def fib1 = (rng * f1/100) + lo;
def fib2 = (rng * f2/100) + lo;
def fib3 = (rng * f3/100) + lo;
def fib4 = (rng * f4/100) + lo;
def fib5 = (rng * f5/100) + lo;


# one = first peak/valley ,   two = second one
def one = min(hibn,lobn);
def two = max(hibn,lobn);
def period = (bn >= one and bn <= two);

#def slope , bar to bar
def slope = (twoprice - oneprice)/(max(hibn,lobn) - min(hibn,lobn));

# slope line
def y = if bn == 1 then na
  else if !period[1] and period then oneprice
  else if period then (y[1] + slope)
  else na;
plot y2 = y;
y2.setdefaultcolor(color.cyan);


def en = hi != 0 and lo != big;
plot z1 = if en then hi else na;
plot z2 = if en then lo else na;
z1.SetPaintingStrategy(PaintingStrategy.HORIZONTAL);
z1.SetDefaultColor(Color.white);
#z1.setlineweight(1);
#z1.hidebubble();

z2.SetPaintingStrategy(PaintingStrategy.HORIZONTAL);
z2.SetDefaultColor(Color.white);
#z2.setlineweight(1);
#z2.hidebubble();

def ispk = (bn == hibn);
def isval = (bn == lobn);
input vert_lines = no;
addverticalline(vert_lines and ispk, "-", color.gray);
addverticalline(vert_lines and isval, "-", color.gray);

plot zf1 = if en then fib1 else na;
plot zf2 = if en then fib2 else na;
plot zf3 = if en then fib3 else na;
plot zf4 = if en then fib4 else na;
plot zf5 = if en then fib5 else na;
zf1.SetDefaultColor(Color.light_gray);
zf2.SetDefaultColor(Color.light_gray);
zf3.SetDefaultColor(Color.magenta);
zf4.SetDefaultColor(Color.light_gray);
zf5.SetDefaultColor(Color.light_gray);

# fib line label data, starting at bottom and going up
def b0 = if ishifirst then 0 else 100;
def b1 = if ishifirst then f1 else f5;
def b2 = if ishifirst then f2 else f4;
def b3 = if ishifirst then f3 else f3;
def b4 = if ishifirst then f4 else f2;
def b5 = if ishifirst then f5 else f1;
def b6 = if ishifirst then 100 else 0;

addchartbubble(bubbn, lo, b0 + "%", color.yellow, no);
addchartbubble(bubbn, fib1, b1 + "%", color.yellow, no);
addchartbubble(bubbn, fib2, b2 + "%", color.yellow, no);
addchartbubble(bubbn, fib3, b3 + "%", color.yellow, no);
addchartbubble(bubbn, fib4, b4 + "%", color.yellow, yes);
addchartbubble(bubbn, fib5, b5 + "%", color.yellow, yes);
addchartbubble(bubbn, hi, b6 + "%", color.yellow, yes);


input test1_labels = no;
addlabel(test1_labels, slope);
addlabel(test1_labels, "hi " + hibn, color.yellow);
addlabel(test1_labels, "lo " + lobn, color.yellow);

# verify last bar
#addverticalline(last1, "-", color.cyan);
#
 

Attachments

  • img1.JPG
    img1.JPG
    169.6 KB · Views: 77
Solution

Join useThinkScript to post your question to a community of 21,000+ developers and traders.

Similar threads

Not the exact question you're looking for?

Start a new thread and receive assistance from our community.

87k+ Posts
380 Online
Create Post

Similar threads

Similar threads

The Market Trading Game Changer

Join 2,500+ subscribers inside the useThinkScript VIP Membership Club
  • Exclusive indicators
  • Proven strategies & setups
  • Private Discord community
  • ‘Buy The Dip’ signal alerts
  • Exclusive members-only content
  • Add-ons and resources
  • 1 full year of unlimited support

Frequently Asked Questions

What is useThinkScript?

useThinkScript is the #1 community of stock market investors using indicators and other tools to power their trading strategies. Traders of all skill levels use our forums to learn about scripting and indicators, help each other, and discover new ways to gain an edge in the markets.

How do I get started?

We get it. Our forum can be intimidating, if not overwhelming. With thousands of topics, tens of thousands of posts, our community has created an incredibly deep knowledge base for stock traders. No one can ever exhaust every resource provided on our site.

If you are new, or just looking for guidance, here are some helpful links to get you started.

What are the benefits of VIP Membership?
VIP members get exclusive access to these proven and tested premium indicators: Buy the Dip, Advanced Market Moves 2.0, Take Profit, and Volatility Trading Range. In addition, VIP members get access to over 50 VIP-only custom indicators, add-ons, and strategies, private VIP-only forums, private Discord channel to discuss trades and strategies in real-time, customer support, trade alerts, and much more. Learn all about VIP membership here.
How can I access the premium indicators?
To access the premium indicators, which are plug and play ready, sign up for VIP membership here.
Back
Top