FDI-Adaptive Supertrend w/ Floating Levels [Loxx] for ThinkOrSwim

samer800

Moderator - Expert
VIP
Lifetime

Check the video to know how to use the indicator.

CODE:

CSS:
# https://www.tradingview.com/v/JAtirpgd/
#// This source code is subject to the terms of the Mozilla Public License
#// © loxx
#indicator("FDI-Adaptive Supertrend w/ Floating Levels [Loxx]"
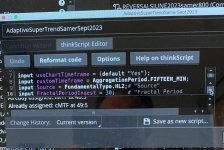
# converted and mod by Sam4Cok@Samer800    - 10 / 2023

input useChartTimeframe = {Default "Yes", "No"};
input customTimeframe = AggregationPeriod.FIFTEEN_MIN;
input Source = FundamentalType.HL2;# "Source"
input FractalPeriodIngest = 30;    # "Fractal Period Ingest"
input speed = 20;                  # "Speed"
input Multiplier = 3.0;            # "Multiplier"
input MakeItAdaptive = yes;        # "Make it adaptive?"
input FloatingLevelLookbackPeriod = 25;    # "Floating Level Lookback Period"
input FloatingUpLevelPercentage   = 80;    # "Floating Levels Up Level %"
input FloatingDownLevelPercentage = 20;    # "Floating Levels Down Level %"
input colorBars = yes;                     # "Color bars?"
input ShowFloatingLevels = yes;            # "Show Floating Levels?"
input FillFloatingLevels = yes;            # "Fill Floating Levels?"
input showSignals = yes;                   # "Show signals?"

def na = Double.NaN;
def per = FractalPeriodIngest;
def flLookBack  = FloatingLevelLookbackPeriod;
def flLevelUp   = FloatingUpLevelPercentage;
def flLevelDown = FloatingDownLevelPercentage;
def showfloat   = ShowFloatingLevels;
def showfill    = FillFloatingLevels;
def src = Fundamental(Source);
def sTF = Fundamental(Source, Period = customTimeframe);
def hTF = Fundamental(FundamentalType.HIGH, Period = customTimeframe);
def lTF = Fundamental(FundamentalType.LOW, Period = customTimeframe);
def cTF = Fundamental(FundamentalType.CLOSE, Period = customTimeframe);
#def lTF = Fundamental(FundamentalType.LOW, Period = customTimeframe);
def sMTF; def hMTF; def lMTF; def cMTF;
Switch (useChartTimeframe) {
Case "No" :
    sMTF = sTF;
    hMTF = hTF;
    lMTF = lTF;
    cMTF = cTF;
Default :
    sMTF = src;
    hMTF = high;
    lMTF = low;
    cMTF = close;
}
#-- Color
DefineGlobalColor("10", CreateColor(0,165,255));
DefineGlobalColor("20", CreateColor(0,232,152));
DefineGlobalColor("80", CreateColor(255,0,56));
DefineGlobalColor("90", CreateColor(255,0,148));

script RMA {
    input x = close;
    input t = 14;
    def ema = CompoundValue(1, (x - EMA[1]) * (1 / t) + EMA[1], x);
    plot out = ema;
}
#fdip(float src, int per, int speedin)=>
script fdip {
    input src = close;
    input per = 14;
    input speedin = 20;
    def fmax = Highest(src, per);
    def fmin = Lowest(src,  per);
    def diff = fold j = 1 to per with q do
              (src[j] - fmin) / (fmax - fmin);
    def length = fold i = 1 to per with p do
          if i > 0 then p +
          Sqrt(Power(diff[i] - GetValue(diff, i + 1), 2) + (1 / Power(per, 2))) else p;
    def fdi = 1 + (Log(length) + Log(2)) / Log(2 * per);
    def traildim = 1 / (2 - fdi);
    def alpha = traildim / 2;
    def speed = Round(speedin * alpha, 0);
    plot out = speed;
}
#pine_supertrend(src, factor, atrPeriod) =>
script SuperTrend {
    input src = hl2;
    input factor = 3;
    input atrPeriod = 14;
    input h = high;
    input l = low;
    input c = close;
    def tr = TrueRange(h, c, l);
    def nATR = RMA(tr, atrPeriod);
    def up = src + factor * nATR;
    def dn = src - factor * nATR;
    def lowerBand;
    def upperBand;
    def up1 = if upperBand[1] then upperBand[1] else up;
    def dn1 = if lowerBand[1] then lowerBand[1] else dn;
    upperBand = if (up < up1) or (c[1] > up1) then up else up1;
    lowerBand = if (dn > dn1) or (c[1] < dn1) then dn else dn1;
    def trend;# = na
    def superTrend;# = na
    def prevSuperTrend = if superTrend[1] then superTrend[1] else up1;
    if (IsNaN(up) or IsNaN(dn)) {
        trend = 1;
    } else
    if prevSuperTrend == up1 {
        trend = if c > upperBand then -1 else 1;
    } else {
        trend = if c < lowerBand then  1 else -1;
    }
    superTrend = if trend == -1 then lowerBand else upperBand;
    plot ST = superTrend;
    plot dir = trend;
}

def masterdom = fdip(sMTF, per, speed);
def len1 = if Floor(masterdom) < 1 then 1 else Floor(masterdom);
def len  = if len1 then len1 else 1;
def lenType = if MakeItAdaptive then len else per;

def supertrend = SuperTrend(sMTF, Multiplier, lenType, hMTF,lMTF,cMTF).ST;
def direction  = SuperTrend(sMTF, Multiplier, lenType, hMTF,lMTF,cMTF).DIR;

def mini = Lowest(supertrend, flLookBack);
def maxi = Highest(supertrend, flLookBack);

def rrange = maxi - mini;
def flu = mini + flLevelUp * rrange / 100.0;
def fld = mini + flLevelDown * rrange / 100.0;
def flm = mini + 0.5 * rrange;

plot top = if showfloat then flu else na;    # "Top float"
plot bot = if showfloat then fld else na;    # "bottom float"
plot mid = if showfloat then flm else na;    # "Mid Float"

top.SetDefaultColor(Color.DARK_GREEN);
bot.SetDefaultColor(Color.DARK_RED);
mid.SetDefaultColor(Color.GRAY);
AddCloud(if !showfill then na else top, mid, Color.DARK_GREEN);
AddCloud(if !showfill then na else mid, bot, Color.DARK_RED);

def stNA = direction < 0;
plot STDn = if stNA then na else supertrend; # "Supertrend"
plot STUp = if stNA then supertrend else na;
STUp.SetLineWeight(2);
STDn.SetLineWeight(2);
STUp.SetDefaultColor(GlobalColor("10"));
STDn.SetDefaultColor(GlobalColor("90"));

# -- Signals

def goLong = direction == -1 and direction[1] == 1;
def goShort = direction == 1 and direction[1] == -1;

plot SigUp = if showsignals and goLong then low else na;
plot SigDn = if showsignals and goShort then high else na;

SigUp.SetPaintingStrategy(PaintingStrategy.BOOLEAN_ARROW_UP);
SigDn.SetPaintingStrategy(PaintingStrategy.BOOLEAN_ARROW_DOWN);

SigUp.SetDefaultColor(Color.CYAN);
SigDn.SetDefaultColor(Color.MAGENTA);

#-- Bar Color

AssignPriceColor(if !colorBars then Color.CURRENT else
                if direction == -1 then GlobalColor("20") else GlobalColor("80"));
#--- END of CODE
 

Join useThinkScript to post your question to a community of 21,000+ developers and traders.

I have been using this study on TV for a few weeks. It has become my favorite chart study. Thank you so much for converting it to thinkscript!
 
I like the sound of this one. Question...if I put this on a daily chart that shows many days ( for instance 6 months), is the cloud that is displayed on the chart based on a 15 minute timeframe for the entire day shown?

I attached a daily chart showing the clouds for this script in yellow. So what do these clouds actually represent? The average of the 15 minute periods for the day or something else?

Perhaps I did not change this in the right place (or places) I changed line 7 to just YES and nothing shows on the chart. See revised script attached. I also attached a new screen shot with just the original script with the clouds which I changed to yellow. I really appreciate your assistance. After I get the script right, I may include in a scan. If you want to communicate by email only so I dont take up a lot of space on this website, it is OK with me.
 

Attachments

  • IMG_6457.jpg
    IMG_6457.jpg
    467.1 KB · Views: 222
  • IMG_6458.jpg
    IMG_6458.jpg
    233.7 KB · Views: 239
Last edited by a moderator:
I like the sound of this one. Question...if I put this on a daily chart that shows many days ( for instance 6 months), is the cloud that is displayed on the chart based on a 15 minute timeframe for the entire day shown?
No.
You can put the cloud that is displayed on the chart based on a 15 minute timeframe onto a 5 minute chart or any chart that is less than or equal to 15 minutes.

But no, the ToS platform (nor any other platform) provides the ability to but a 15 minute timeframe onto a higher timeframe.

The reason for this is that the candle on a 5minute timeframe is calculated in 5min chunks. The system can easily add up three 5 minute chunks and voilà, a 15minute calculation is achieved.

But on the daily chart, the candle is calculated in daily chunks. That daily candle only retains what the open, close, high, and low of the day was. The daily candle retains no other intra-candle information upon which to calculate a 15min chunk.

Perhaps I did not change this in the right place (or places) I changed line 7 to just YES and nothing shows on the chart. See revised script attached. I also attached a new screen shot with just the original script with the clouds which I changed to yellow. I really appreciate your assistance. After I get the script right, I may include in a scan. If you want to communicate by email only so I dont take up a lot of space on this website, it is OK with me.

Here is a shared chart link: http://tos.mx/hrI8LLm Click here for --> Easiest way to load shared links
of the indicator in the top post.
line 7 is set to "yes"
input useChartTimeframe = {Default "Yes", "No"};
This defaults to using the daily timeframe to calculate clouds and plots
jZCvznV.png
 
No.
You can put the cloud that is displayed on the chart based on a 15 minute timeframe onto a 5 minute chart or any chart that is less than or equal to 15 minutes.

But no, the ToS platform (nor any other platform) provides the ability to but a 15 minute timeframe onto a higher timeframe.

The reason for this is that the candle on a 5minute timeframe is calculated in 5min chunks. The system can easily add up three 5 minute chunks and voilà, a 15minute calculation is achieved.

But on the daily chart, the candle is calculated in daily chunks. That daily candle only retains what the open, close, high, and low of the day was. The daily candle retains no other intra-candle information upon which to calculate a 15min chunk.


Here is a shared chart link: http://tos.mx/hrI8LLm Click here for --> Easiest way to load shared links
of the indicator in the top post.
line 7 is set to "yes"
input useChartTimeframe = {Default "Yes", "No"};
This defaults to using the daily timeframe to calculate clouds and plots
jZCvznV.png
Thanks again MerryDay...always a great help on these interesting scripts. I did note that the chart using the downloaded script from Samer on SOS looks the same as the shared link you sent to me. So, I guess if I pull up a daily chart, I will get daily clouds and if I pull up a 15 minute chart, I get the 15 minute version. I have set up the script on a daily scan for stocks but it is picking up some stocks that are below the top of the cloud! I set up a scan for those in a downtrend, but nothing shows up. Does the script have to say something about the price being below and "bottom" rather than "top"? See screenshot. Thanks
 

Attachments

  • IMG_6468.jpg
    IMG_6468.jpg
    255.2 KB · Views: 128
Last edited:
scan for those in a downtrend,
for something where the price is below and "bottom"

Sorry. No idea what you are asking. I did a search on the above script for all the terms in your question.
And got one result. The dark red line in this script; which represents # "bottom float"
plot bot = if showfloat then fld else na; # "bottom float"
bot.SetDefaultColor(Color.DARK_RED);

So I am guessing that you are asking whether you can scan for price being below bottom float:
close < bot
The answer is yes, you can put the above in a scan.

Here is a tutorial for setting up scans:
https://usethinkscript.com/threads/how-to-use-thinkorswim-stock-hacker-scans.284/
 
Good morning everyone,

I am new, but may be is someone can help me. The FDI adaptive is a great indicator but I like to trade on a range chart and the study is not plotting on it.
Is there any version for range or tick charts?
Thank you.
 
Good morning everyone,

I am new, but may be is someone can help me. The FDI adaptive is a great indicator but I like to trade on a range chart and the study is not plotting on it.
Is there any version for range or tick charts?
Thank you.

Unfortunately, indicators either work or don't work on range and tick charts.
Many of the scripts on this forum are time-dependent and will not work for you.
 
Last edited:
For some reason, with a simple copy-n-paste and after manipulating many of the settings, I cannot get the indicator to show on any chart in any time frame. Is there something I'm missing?

TIA
 
You didn't provide enough information to say where you went astray.
Newer ToS users, run into problems with indicators not showing up on charts when
they are attempting to use the MTF option but apply the script to a timeframe higher than the secondary aggregation that has been selected.
ToS platform allows higher timeframe plots to be applied to lower timeframes, but it is not possible to put lower aggregations on a higher timeframe.

To get you started, here is a chart with the indicator already applied.
Shared chart link: http://tos.mx/b1kMAoe Click here for --> Easiest way to load shared links
Manipulate your settings ONE AT A TIME! Thus you will be able to troubleshoot, which setting change is giving you problems.

Keep in mind that research has never found that any one indicator used in isolation is profitable.
Trending indicators like this one will be profitable during bullish trends, but will be subjected to whipsaws during consolidation.
Therefore, must be used as part of an overall good basic strategy.
read more: https://usethinkscript.com/threads/basics-for-developing-a-good-strategy.8058/
MuRtm4r.png
 
Last edited:

Similar threads

Not the exact question you're looking for?

Start a new thread and receive assistance from our community.

87k+ Posts
407 Online
Create Post

Similar threads

Similar threads

The Market Trading Game Changer

Join 2,500+ subscribers inside the useThinkScript VIP Membership Club
  • Exclusive indicators
  • Proven strategies & setups
  • Private Discord community
  • ‘Buy The Dip’ signal alerts
  • Exclusive members-only content
  • Add-ons and resources
  • 1 full year of unlimited support

Frequently Asked Questions

What is useThinkScript?

useThinkScript is the #1 community of stock market investors using indicators and other tools to power their trading strategies. Traders of all skill levels use our forums to learn about scripting and indicators, help each other, and discover new ways to gain an edge in the markets.

How do I get started?

We get it. Our forum can be intimidating, if not overwhelming. With thousands of topics, tens of thousands of posts, our community has created an incredibly deep knowledge base for stock traders. No one can ever exhaust every resource provided on our site.

If you are new, or just looking for guidance, here are some helpful links to get you started.

What are the benefits of VIP Membership?
VIP members get exclusive access to these proven and tested premium indicators: Buy the Dip, Advanced Market Moves 2.0, Take Profit, and Volatility Trading Range. In addition, VIP members get access to over 50 VIP-only custom indicators, add-ons, and strategies, private VIP-only forums, private Discord channel to discuss trades and strategies in real-time, customer support, trade alerts, and much more. Learn all about VIP membership here.
How can I access the premium indicators?
To access the premium indicators, which are plug and play ready, sign up for VIP membership here.
Back
Top